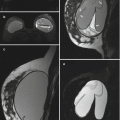
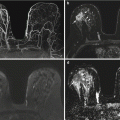
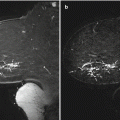
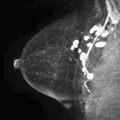
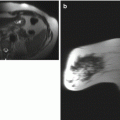
Fig. 3.1
Sagittal T1-weighted fat-suppressed post-contrast images through the right breast (a) and axilla (b)
3.2 Ductal Carcinoma In Situ (DCIS): Low Grade
Teaching Points
MRI is more sensitive than mammography in detection of all grades of DCIS, with greater sensitivity for detection of high-grade and intermediate-grade DCIS than for low-grade DCIS. Mammographically, low-grade DCIS presents as amorphous calcifications and is more likely than high-grade DCIS to present as a mass or asymmetry. On MR imaging, nonmass enhancement is usually associated with all grades of DCIS (60–81 % of cases). Low-grade DCIS typically has benign blood flow enhancement kinetics, but no kinetic pattern has been demonstrated to predict DCIS grade.
Image Findings

Fig. 3.2
(a) Sagittal T1-weighted fat-suppressed post-contrast image of the right breast demonstrates a 1.2-cm area of linear nonmass enhancement (arrows) along the right 10:00 axis. (b) Sagittal T1-weighted fat-suppressed post-contrast image of the right axilla shows no lymphadenopathy. The findings were mammographically and sonographically occult. MRI guided biopsy of the nonmass enhancement yielded low-grade ductal carcinoma in situ (DCIS)
3.3 History
32-year-old woman with high-grade DCIS for extent of disease evaluation (Figs. 3.3, 3.4, 3.5, 3.6, 3.7, 3.8, 3.9, and 3.10).


Fig. 3.3
Mammogram. Craniocaudal (CC) (a) and mediolateral (ML) (b) magnification views of the right breast

Fig. 3.4
Initial breast MRI. (a) Axial T1-weighted fat-suppressed post-contrast image of both breasts. (b, c) Sagittal T1-weighted fat-suppressed post-contrast images of the right breast

Fig. 3.5
Follow-up breast MRI performed 11 months later. (a) Axial T1-weighted fat-suppressed post-contrast image of both breasts. (b, c) Sagittal T1-weighted fat-suppressed post-contrast images of the right breast

Fig. 3.6
Coned-down axial PET image of the liver and coronal fused PET-CT image of the chest and upper abdomen
History: Same patient returns 11 months later after lost to follow up.
3.4 DCIS: High Grade 1
Teaching Points
DCIS is a heterogeneous disease varying in clinical presentation, morphology, and behavior. The published studies indicate that DCIS of all grades has the potential to progress to invasive ductal carcinoma, but high-grade DCIS has been shown to progress more rapidly than lower-grade lesions and is more likely to lead to metastatic disease with poor survival outcome. The MRI appearance of the natural progression of high-grade DCIS is illustrated in this case with dramatic increase in loco-regional disease with parenchymal spread of tumor, skin involvement, and axillary metastasis. Breast MRI is a sensitive modality for evaluating interval change of malignancy not only in patients with successful neoadjuvant therapy but also in cases of failed treatment.
Image Findings

Fig. 3.7
Mammogram. CC (a) and ML (b) magnification views of the right breast demonstrate extensive suspicious pleomorphic calcifications (arrows) involving the upper outer breast. Stereotactic biopsy yielded high-grade DCIS

Fig. 3.8
Baseline breast MRI. (a) Axial T1-weighted fat-suppressed post-contrast image of both breasts reveals extensive nonmass enhancement (arrowheads) involving most of the right breast. (b) Sagittal T1-weighted fat-suppressed post-contrast image of the right breast shows extensive segmental nonmass enhancement (arrowheads) in the upper right breast. A breast biopsy clip artifact is seen (arrow). (c) Sagittal T1-weighted fat-suppressed post-contrast image of the right breast shows extensive segmental nonmass enhancement (arrowheads) in the upper right breast, as well as two enlarged axillary lymph nodes (arrows) suspicious for metastasis

Fig. 3.9
Follow-up breast MRI performed after 11 months of nonconventional treatment. Axial (a) and sagittal (b) T1-weighted fat-suppressed post-contrast images at the level of the biopsy clip (white arrow) show increased extensive nonmass enhancement, now involving the entire right breast with associated diffuse and nodular skin thickening (arrowheads). (c) Sagittal T1-weighted fat-suppressed post-contrast image of the right breast demonstrates interval increase in enlarged axillary lymph nodes (arrows), which have a matted appearance adjacent to the axillary vasculature (arrowheads)

Fig. 3.10
PET/CT evaluation shows several FDG-avid irregular masses (teal circle) in the liver, suspicious for hepatic metastases
3.5 History
A 55-year-old woman with high-grade DCIS. Extent of disease evaluation (Figs. 3.11, 3.12, 3.13, and 3.14).


Fig. 3.11
Mammogram. ML view (a), CC spot magnification view (b), and ML spot magnification views (c, d) of the left breast

Fig. 3.12
(a, b) Sagittal post-contrast subtraction images of the left breast. High-grade DCIS with disease extent underestimated on mammography
3.6 DCIS: High Grade 2
Teaching Points
Although mammography has been the mainstay for diagnosis of DCIS, there is a tendency to underestimate the extent of disease, especially in patients without microcalcifications or in those with dense breasts or breast implants. MRI is more sensitive than mammography in detecting pure DCIS. In many instances, MRI can reveal early-stage breast cancers, including DCIS and DCIS with small invasive carcinomas, that are mammographically, sonographically, and clinically occult. However, no differences in MR morphologic or kinetic features have been reported between low-grade and high-grade DCIS.
In our example, linearly distributed pleomorphic calcifications identified on mammography correspond to linear nonmass enhancement on the T1-weighted post-contrast images, a finding more likely to be associated with high-grade DCIS.
Image Findings

Fig. 3.13
Mammogram. ML view (a), CC spot magnification view (b), and ML spot magnification views (c, d) show pleomorphic calcifications in a linear distribution in the lower outer quadrant (arrows)

Fig. 3.14
(a) Sagittal post-contrast subtraction image shows linear nonmass enhancement (black arrows) corresponding to the pleomorphic calcifications on mammography. Biopsy clip artifact is seen (white arrow). (b) An additional sagittal post-contrast subtraction image reveals additional enhancement extending towards the nipple (arrowheads), for which there is no mammographic correlate
3.7 History
51-year-old woman with right nipple itchiness and erythema (Figs. 3.15, 3.16, 3.17, and 3.18).


Fig. 3.15
Axial MR images of both breasts. (a) T1-weighted. (b) T2-weighted fat-saturated. (c) Post-contrast subtraction. (d) Corresponding computer-aided detection (CAD) images

Fig. 3.16
Mammographic images of the right breast. Mediolateral oblique (MLO) view (a) and CC view (b) with corresponding retroareolar spot magnification views (c, d)
3.8 Paget’s Disease
Teaching Points
Paget’s disease is a rare disease of the breast, accounting for 1–3 % of all breast cancer cases. The disease is characterized by involvement of the nipple-areolar complex with malignant cells called Paget cells, manifested clinically by nipple/areolar itching, erythema, scaly skin, bloody nipple discharge, and nipple erosion, ulceration, or retraction. Diagnosis is usually made by a full-thickness punch biopsy of the nipple-areolar complex. Paget’s disease of the breast is nearly always a sign of underlying breast malignancy, with most studies reporting the presence of a concurrent DCIS or invasive cancer in over 90 % of patients. Approximately 50 % of patients with Paget’s disease also present with an associated palpable mass in the breast, 90 % of whom are found to have invasive disease; a lesion without a palpable mass is usually associated with DCIS. On mammography, Paget’s disease can be seen as nipple/areolar abnormalities such as skin thickening, malignant calcifications, or discrete lesions involving the nipple-areolar complex or breast parenchyma, but mammograms can appear normal in up to 50 % of patients with Paget’s disease, so correlation with clinical examination is critical. MR imaging is usually performed to detect underlying occult malignancy. Common MR findings of Paget’s disease include asymmetric nipple enhancement and nodularity with or without associated features of DCIS and invasive carcinoma.
Image Findings

Fig. 3.17
Paget’s disease with additional disease detected on MRI. Axial T1-weighted (a) and axial T2-weighted fat-saturated images (b) demonstrate T1 hypointensity and mild T2 hyperintensity of the right nipple (arrow), as well as marked retroareolar T2 hyperintensity (arrow). Axial post-contrast subtraction (c) with corresponding CAD images (d) demonstrate marked enhancement of the nipple (arrow) with mixed enhancement kinetics and additional linear nonmass enhancement posterior to the nipple (arrowhead)

Fig. 3.18
Paget’s disease on mammography. Right MLO (a) and CC (b) views with corresponding retroareolar spot magnification views (c, d) demonstrate a suspicious group of heterogeneous calcifications (arrows), which yielded DCIS on biopsy
3.9 History
3.10 DCIS: Micropaillary
Teaching Points
Ductal carcinoma-in-situ may be classified variably, taking into account architecture, nuclear pleomorphism, and the presence or absence of necrosis. Interest in classification stems in large part from the desire to use pathological features to help predict likelihood of recurrence, progression to invasive disease, and overall prognosis.
Micropapillary DCIS is an architectural subtype in which small club-like protuberances project into dilated ducts. Although some authors have associated micropapillary DCIS with lower nuclear grade and indolence, the micropapillary subtype has also been considered conversely to have negative implications for disease extent and prognosis, especially in more recent studies. It appears in several analyses as an independent risk factor for tumor recurrence.
The mammographic and sonographic features of both screen-detected and symptomatic DCIS have been well described, with mammography being the primary modality given its sensitivity for calcifications and sonography playing an adjunctive but important role, particularly in symptomatic patients and higher-grade disease. When used, MRI is the most sensitive examination for DCIS, which most frequently appears as non-mass enhancement, as illustrated in our case. Some unique aspects of the imaging of micropapillary DCIS have been revealed. Although most DCIS is detected mammographically through the presence of suspicious calcifications, the histologic extent of the disease is frequently greater than the extent of suspicious mammographic features. This discrepancy has been shown to be more pronounced in the architectural subtype of micropapillary DCIS. The imaging characteristics of micropapillary DCIS on mammography, sonography, and MRI were specifically reviewed by Lee et al. in a study of 42 tumors which were composed predominantly of micropapillary DCIS on pathology. Notably, the patient is often asymptomatic despite what may turn out to be extensive disease and, similarly, sonography is often negative. Pleomorphic calcifications were the most common imaging presentation. In this study, the infrequently used MRI showed non-mass enhancement in a segmental or regional distribution similar to other types of DCIS. Importantly, MRI was the only modality to accurately size the disease in the cases it was used. Debate on the appropriate preoperative use of breast MRI for both invasive or in-situ cancer is ongoing, but as the recommendations become more refined, consideration may be given to its use in the evaluation of micropapillary DCIS.
Image Findings

Fig. 3.20
Micropapillary DCIS. There is a 1.3 cm linear non-mass enhancement in the upper outer mid right breast. This area underwent MRI-guided biopsy, yielding micropapillary DCIS
3.11 History
67-year-old woman with newly diagnosed left breast IDC (Figs. 3.21, 3.22, 3.23, and 3.24).


Fig. 3.21
(a) T1 post contrast axial 3D MIP. (b) Selected axial T1 post-contrast fat-saturated image

Fig. 3.22
(a) ADC. (b) DWI. DWI demonstrates high signal on b = 800 s/mm2 corresponding to the non-mass enhancement representing
3.12 DCIS: DWI
Teaching Points
The application of DWI for DCIS has to address several different questions including the following: (1) Can DCIS be distinguished from normal breast tissue and benign lesions? (2) Can DCIS be distinguished from invasive malignancy? (3) Can DCIS grades be differentiated?
Studies of DWI have demonstrated a mean apparent diffusion coefficient (ADC) value of DCIS that is intermediate between normal breast tissue and invasive disease. In three of these studies, the mean ADC of DCIS was shown to be 1.35–1.50 × 10⁻³ mm2/s, compared to the mean ADC of normal breast tissue was 2.01–2.09 × 10⁻³ mm2/s (sensitivity for DCIS was 91 % with an ADC value of <1.81 × 10⁻³ mm2/s according to one study). The mean ADC of invasive disease investigated by two of these same authors was shown to be 1.2–1.29 × 10⁻³ mm2/s. Woodhams et al. directly compared DCIS and invasive disease and found them statistical different. Concerns have been raised concerning the overlap of ADC values in malignant disease and benign lesions with potential false positives or false negatives depending on the threshold chosen.
High-nuclear grade (HNG) DCIS is considered more likely to progress to invasive cancer than lower-grade DCIS (non-HNG DCIS), and is considered more clinically significant. Using DWI to discriminate between grades of DCIS has had mixed results. Although Lim et al. in 2011 demonstrated statistically significant difference between the ADC values of grades of DCIS, other studies have not replicated that result. A 2012 study by Rahbar et al. did not demonstrate significant differences in the ADCs of HNG versus non-HNG DCIS. Further work is needed to determine the clinically applicability of DWI for assessing DCIS.
Image Findings

Fig. 3.23
(a) 3D MIP image demonstrates an 8 mm mass in the posterior left breast (arrow head) which underwent biopsy yielding IDC. (b) In the right breast segmentally distributed non mass enhancement is present spanning 9 cm

Fig. 3.24
(a) Low-grade DCIS. (b) ADC values are within the malignant range (1.35 × 10⁻³ mm2/s), but higher than typical for invasive disease. Two site MR-guided biopsy demonstrated low nuclear-grade DCIS
3.13 History
42-year-old woman with recent diagnosis of left breast cancer. Breast MRI was performed to evaluate extent of disease (Figs. 3.25, 3.26, 3.27, and 3.28).


Fig. 3.25
(a) Axial T1-weighted fat-saturated image of both breasts. (b, c) Contiguous axial T2-weighted fat-saturated images of both breasts

Fig. 3.26
(a) Axial T1-weighted fat-saturated post-contrast image of both breasts. (b) Corresponding axial post-contrast subtraction image
3.14 Invasive Ductal Carcinoma, Papillary
Teaching Points
Papillary carcinoma of the breast is a rare type of invasive ductal carcinoma. It accounts for about 2 % of all breast cancers and usually occurs in post-menopausal women with an average age of 65 years. Clinically it can manifest as a palpable mass or nipple discharge and occurs most commonly in the retroareolar region. These lesions are classified as papillary DCIS, intracystic papillary carcinoma (ICPC) with or without invasion, or solid papillary carcinoma (if no cystic component is present). Invasive elements are typically detected at the periphery of the lesion. Histologically, it is characterized by a frond-like growth pattern on a fibrovascular core lacking a myoepithelial layer. Mammographically, papillary carcinoma can present as a round, oval, or lobulated mass, usually with a circumscribed margin. Sonographically, papillary carcinoma presents as a complex, cystic solid mass with posterior acoustic enhancement or as a hypoechoic solid mass. Increased vascularity is often present. On MRI, intracystic papillary carcinoma appears as complex, cystic solid mass or multicystic masses with heterogeneous internal composition with enhancing nodular masses and variable fluid content. Hemorrhagic contents can be hyperintense on both T1- and T2-weighted images and fluid-fluid levels may be seen, as illustrated in this case. Serous contents can show T1 hypointensity and T2 hyperintensity. Post-contrast images can show variable enhancement involving the cyst walls, septa, and mural nodules. Patients with papillary carcinoma have a more favorable prognosis than those with invasive ductal carcinoma–not otherwise specified (NOS).
Image Findings

Fig. 3.27
Intracystic papillary carcinoma with surrounding DCIS. An axial T1-weighted fat-suppressed image (a) and axial T2-weighted fat-saturated images (b, c) show a complex, multicystic mass in the medial left breast with a fluid-fluid level (arrows) and T1- and T2-hyperintense layers reflecting hemorrhage (arrowheads). Additional T2-hyperintense cystic components are noted in the far posterior medial breast associated with a T1-hypointense mass (arrowhead)

Fig. 3.28
(a) Axial T1-weighted fat-saturated post-contrast image shows a solid mass (arrowheads) within the posterior aspect of the multicystic mass. A clip artifact (arrow) within this solid component is from a biopsy, which yielded papillary carcinoma. (b) Axial post-contrast subtraction image reveals that the solid mass has mild enhancement. In addition, diffuse adjacent enhancement (arrows) is present in the central and outer breast, corresponding to an area of suspicious calcifications on mammography. Stereotactic biopsy of the calcifications yielded DCIS. The patient underwent left mastectomy, with final pathology revealing intracystic papillary carcinoma and extensive DCIS. No axillary lymph node metastases were present
3.15 History
59-year-old woman with newly diagnosed left breast malignancy with axillary metastasis. Breast MRI was performed to evaluate extent of disease (Figs. 3.29, 3.30, 3.31, 3.32, 3.33, 3.34, 3.35, 3.36, 3.37, 3.38, 3.39, and 3.40).


Fig. 3.29
(a) Sagittal T1-weighted fat-saturated post-contrast image of the mid left breast. (b) Corresponding sagittal T2-weighted fat-saturated image

Fig. 3.30
(a) Sagittal T1-weighted fat-saturated post-contrast image of the outer left breast. (b) Corresponding sagittal T2-weighted fat-saturated image. (c) Corresponding sagittal T1-weighted fat-saturated pre-contrast image

Fig. 3.31
(a) Sagittal T1-weighted fat-saturated post-contrast image of the medial left breast. (b) Corresponding sagittal T2-weighted fat-saturated image

Fig. 3.32
Mammogram. Left breast CC view (a) and MLO view (b)

Fig. 3.33
Targeted ultrasound images of the left upper outer breast (a) and left axilla (b)

Fig. 3.34
(a) Axial localizer image. (b) Corresponding axial T1-weighted fat-saturated delayed post-contrast image
3.16 Invasive Ductal Carcinoma, Mucinous
Teaching Points
Mucinous carcinoma of the breast, a form of invasive ductal carcinoma, is sometimes called colloid carcinoma. The tumor is made up of abnormal cells within pools of mucin, a key component in the slimy, slippery mucus. It can histologically be divided into pure mucinous breast cancer or mixed mucinous breast cancer. Mucinous carcinoma is extremely rare in men and in women (2 % of all breast cancers). It is more common after menopause, in the 60s or early 70s. Mammographically, the presence of mucin results in a low-density and well-defined lobular mass. Sonographically, mixed cystic and solid components, posterior acoustic enhancement, and micro-lobulated margins are commonly seen. On MRI, they can have very high signal intensity on T2-weighted images, as illustrated in this case, because of the water component in mucin. Post-contrast enhancement can be variable. Typically, a pure mucinous subtype carries a better prognosis than invasive ductal carcinoma NOS. Mixed mucinous carcinoma of the breast tends to demonstrate more aggressive behavior than the pure subtype, as illustrated in this case with distant metastasis.
Image Findings

Fig. 3.35
Mucinous carcinoma. (a) Sagittal T1-weighted fat-saturated post-contrast image demonstrates several large, conglomerate, irregular masses (arrows) occupying most of the mid to anterior breast, with central clip artifact (arrowhead) from a biopsy that yielded invasive ductal carcinoma with mixed mucinous features. (b) Sagittal T2-weighted fat-saturated image shows these masses to have homogeneous high T2 signal, likely reflecting both the water content of mucin and areas of necrosis

Fig. 3.36
(a) Sagittal T1-weighted fat-saturated post-contrast image of the outer breast shows the irregular masses extending into the outer breast and superficially to the skin (arrows). Posteriorly, enlarged low axillary lymph nodes are present, corresponding to the known metastases (arrows). (b) Sagittal T2-weighted fat-saturated image shows the masses and axillary lymph nodes to have homogeneous T2 hyperintensity (arrows). Both focal and diffuse skin enhancement and edema are present owing to the combination of direct skin invasion and secondary obstruction from axillary adenopathy. (c) Sagittal T1-weighted fat-saturated pre-contrast image shows subareolar linear branching high signal intensity (arrows), representing mildly dilated ducts containing hemorrhagic or proteinaceous debris

Fig. 3.37
Sagittal T1-weighted fat-saturated post-contrast image (a) of the medial breast demonstrates an enlarged left internal mammary lymph node (arrow) with peripheral enhancement and diffuse high T2 signal (b) (arrow). The peripheral enhancement pattern suggests central necrosis. PET/CT imaging (not shown) demonstrated focal FDG uptake involving the left internal mammary lymph node, suspicious for metastatic disease

Fig. 3.38
CC (a) and MLO (b) mammographic images show large irregular masses occupying most of the upper outer left breast with associated diffuse skin thickening, axillary adenopathy, and cutaneous extension of the low-density mass involving the upper breast (arrows)

Fig. 3.39
(a) Sonography shows a partially imaged large hypoechoic mass with irregular margins in the upper outer left breast, corresponding to the known malignancy. Mild posterior acoustic enhancement is present (arrows). (b) Irregular large hypoechoic lymph nodes are sonographically evident in the low axilla, corresponding to the known metastatic disease

Fig. 3.40
(a) Axial localizer image shows T2 hyperintense lesions in the right lower lobe of the lung (arrows). (b) Corresponding axial T1-weighted fat-saturated post-contrast image shows enhancement of these lesions, suspicious for pulmonary metastases. In addition, enlarged left internal mammary and low axillary lymph nodes are seen (arrows). Subsequent biopsy confirmed metastatic disease
3.17 History
A 61-year-old woman with recently diagnosed left breast malignancy. Breast MRI was performed to evaluate extent of disease (Figs. 3.41, 3.42, 3.43, and 3.44).


Fig. 3.41
(a) Sagittal T1-weighted fat-saturated post-contrast image of the left breast. (b) Corresponding sagittal T2-weighted fat-saturated image. (c) Axial T1-weighted fat-saturated post-contrast image of both breasts. (d) Corresponding axial T2-weighted fat-saturated image


Fig. 3.42
Mammogram. CC image (a) and MLO image (b) of the left breast. CC spot compression image (c) and MLO spot compression image (d) of the left breast. (e) A targeted left breast ultrasound
3.18 Invasive Ductal Carcinoma, Pure Mucinous 1
Teaching Points
Mucinous carcinoma of the breast is a rare form of invasive ductal carcinoma. On mammography, the presence of mucin results in a low-density and relatively well-defined lobular mass. On sonography, a homogeneously hypoechoic mass is seen with posterior acoustic enhancement. On MRI, the masses can have very high signal intensity on T2-weighted images. All these imaging features are illustrated in this patient with a diagnosis of pure mucinous carcinoma. The pure mucinous subtype carries a better prognosis with a lower chance of axillary metastasis. The patient underwent breast conservation with final pathology of pure mucinous carcinoma, stage T1N0.
Image Findings

Fig. 3.43
Pure mucinous carcinoma. Sagittal (a) and axial (b) T1-weighted fat-saturated post-contrast images show a 1.6-cm irregular mass (arrow) in the retro-areolar left breast. Corresponding axial post-contrast (c) and axial T2-weighted fat-saturated (d) images show the mass (arrow) to have high T2 signal


Fig. 3.44
CC (a) and MLO (b) mammography images of the left breast show a 1.5-cm partially circumscribed irregular mass (arrow) in the slightly medial subareolar left breast, which persists on spot compression views (c, d). (e) Targeted left breast ultrasound demonstrates a corresponding 1.5-cm oval circumscribed, homogeneously hypoechoic mass with posterior acoustic enhancement (arrows). The patient underwent ultrasound-guided core biopsy, yielding invasive ductal carcinoma, mucinous type
3.19 History
58-year-old woman with recently diagnosed left breast malignancy. Breast MRI was performed to evaluate extent of disease (Figs. 3.45 and 3.46).


Fig. 3.45
Sagittal post-contrast subtraction image of the left breast (a) with CAD color overlay (b). (c) Corresponding sagittal T2-weighted fat-saturated image
3.20 Invasive Ductal Carcinoma, Pure Mucinous 2
Teaching Points
Mucinous carcinoma of the breast is a rare form of invasive ductal carcinoma. On MRI, these tumors can have very high signal intensity on T2-weighted images, as illustrated in this case. In addition, post-contrast enhancement is variable; a benign-appearing, persistent enhancement pattern (as seen in this patient) may occur. The pure mucinous subtype carries a better prognosis than invasive ductal carcinoma NOS, with a lower chance of axillary metastasis. The patient underwent breast conservation, with final pathology yielding pure mucinous carcinoma, stage T1N0.
Image Findings

Fig. 3.46
Pure mucinous carcinoma. Sagittal post-contrast subtraction image (a) shows a 1.3-cm irregular mass (arrow) along the 12:00 axis of the left breast, demonstrating persistent enhancement color-coded as blue on CAD (b). (c) Corresponding sagittal T2-weighted fat-saturated image shows the T2-hyperintense mass (arrow) to be larger than the area of enhancement. The patient underwent ultrasound-guided core biopsy yielding invasive ductal carcinoma, mucinous type
3.21 History
Extent of disease evaluation (Figs. 3.47, 3.48, 3.49, and 3.50).


Fig. 3.47
Sagittal MRI images of the right breast. T1-weighted fat-saturated post-contrast image (a) and CAD color overlay on a post-contrast subtraction image (b)

Fig. 3.48
Sagittal MRI images of the right breast obtained 12 months later: a T2-weighted fat-saturated image (a), post-contrast subtraction image (b), and post-contrast subtraction image with CAD color overlay (c)
3.22 Invasive Ductal Carcinoma, Tubular Carcinoma
Teaching Points
Tubular carcinoma of the breast is a well-differentiated form of invasive ductal carcinoma. It typically occurs in younger women (middle to late 40s) and tends to have a more favorable prognosis than other breast cancers. Pure tubular carcinoma is rare and accounts for less than 2 % of all breast cancers. The diagnosis of tubular carcinoma requires a minimum percentage of tubular elements ranging from 75 to 90 %.
Tubular carcinoma is often detected as a small, spiculated mass on screening mammography, usually less than 1 cm, but it may be discovered as a palpable mass. The spiculations correspond to reactive stroma extending from the neoplasm. On MRI, tubular carcinoma appears similar to invasive ductal carcinoma NOS, with a variable kinetic enhancement pattern.
Image Findings

Fig. 3.49
Initial MRI images obtained in a patient with tubular carcinoma detected on high-risk screening MRI follow-up. (a) Sagittal T1-weighted fat-saturated post-contrast image shows a focus of enhancement along the posterior right 12:00 axis (arrow). (b) CAD enhancement kinetic analysis demonstrates a mixed pattern (arrow), with predominantly progressive and plateau kinetics

Fig. 3.50
12-month follow-up MRI images demonstrating tubular carcinoma. (a) Sagittal T2-weighted fat-saturated image of the right breast shows minimal T2 hyperintensity (arrow) in the posterior breast. (b) Sagittal post-contrast subtraction image shows interval enlargement of the previously seen enhancing focus, which is now a heterogeneously enhancing, irregular, spiculated mass (arrow) in the posterior right breast. (c) CAD enhancement kinetics analysis shows a mixed enhancement pattern, predominantly washout (arrow), suspicious for malignancy. Biopsy yielded tubular carcinoma
3.23 History
46-year-old woman with newly diagnosed left breast malignancy. Breast MRI was performed to evaluate extent of disease (Figs. 3.51, 3.52, 3.53, 3.54, 3.55, and 3.56).


Fig. 3.51
(a) Axial T1-weighted image of both breasts. (b) Corresponding axial T2-weighted fat-saturated image. (c) Corresponding axial T1-weighted fat-saturated post-contrast image with CAD kinetic analysis color overlay. (d) Axial post-contrast 3D maximum intensity projection (MIP) image

Fig. 3.52
Mammogram. CC view (a) and MLO view (b) of the left breast. CC (c) and MLO (d) spot compression views of the left breast

Fig. 3.53
Targeted left breast ultrasound image
3.24 Invasive Ductal Carcinoma, Medullary Carcinoma
Teaching Points
Medullary carcinoma of the breast is a rare type of invasive ductal carcinoma that accounts for about 3 % of all breast cancers. This tumor can occur in younger women, including 10 % of cases in women under 35 years. On histology, medullary carcinomas have been classified as either typical or atypical. Atypical medullary carcinomas are now classified as invasive ductal carcinomas with medullary features. Patients with medullary carcinoma have a more favorable prognosis than those with atypical medullary carcinoma and nonmedullary carcinoma. The morphologic features of medullary carcinomas and fibroadenomas can overlap. Mammographically, medullary carcinoma is a round, ovoid, or lobular mass with ill-defined or circumscribed margins. On ultrasound, the mass can be either homogeneously hypoechoic or hypoechoic with mild heterogeneity. Posterior acoustic enhancement may be present. On MRI, medullary carcinomas appear as masses with an oval or lobular shape and circumscribed margins. The tumors are isointense or hypointense on T1-weighted images and isointense or hyperintense on T2-weighted images relative to the surrounding breast tissue. Kinetics curves demonstrate a rapid initial increase in enhancement and a washout or plateau delayed enhancement pattern. Many of the imaging features typical for medullary carcinoma were present in our case. The patient underwent breast conservation with final pathology showing typical medullary carcinoma, stage T2, N0.
Image Findings

Fig. 3.54
Medullary carcinoma. Axial T1-weighted image (a) and fat-saturated T2-weighted image (b) demonstrate a 2.6-cm, T1-hypointense and T2-hyperintense round mass (arrow) in the posterior upper outer breast with central clip artifact from a biopsy, which yielded malignancy. (c) Corresponding axial T1-weighted fat-saturated post-contrast image with CAD kinetic analysis shows rapid uptake of contrast with delayed washout color-coded as red. (d) Axial post-contrast 3D MIP image shows the unifocal mass in the left breast. No other suspicious enhancement is present in ether breast or axilla

Fig. 3.55
(a, b) Mammography (spot compression views) shows a 2.5-cm partially obscured round mass (arrows) in the upper outer left breast

Fig. 3.56
Targeted ultrasound of the 2:00 axis of the left breast shows a partially circumscribed, round mass with some irregular margins and marked posterior acoustic enhancement (arrows), corresponding to the mammographic and MRI masses. The patient underwent ultrasound-guided core biopsy yielding medullary carcinoma
3.25 History
A 64-year-old woman with newly diagnosed left breast malignancy. Breast MRI was performed to evaluate extent of disease (Figs. 3.57, 3.58, 3.59, 3.60, and 3.61).


Fig. 3.57
Screening mammogram. Left (a) and right (b) MLO views. Left (c) and right (d) CC views

Fig. 3.58
Prior screening mammogram for comparison. Left MLO (a) and CC (b) views

Fig. 3.59
(a) Axial T1-weighted image of both breasts. (b) Corresponding axial T2-weighted fat-saturated image. (c) Axial T1-weighted fat-saturated post-contrast image with (d) CAD kinetic analysis color overlay. (e, f) Contiguous sagittal T1-weighted fat-saturated post-contrast subtracted images of the outer left breast
3.26 Invasive Lobular Carcinoma 1
Teaching Points
Breast MRI is commonly performed for extent of disease evaluation and preoperative planning, but its routine preoperative use is controversial because the long-term benefits for patient survival outcome are unclear, especially in the setting of adjuvant chemotherapy and radiation therapy. Breast MRI may be most important in patients who are relying only on surgery for their treatment. For patients with invasive lobular carcinoma (ILC), there is literature supporting preoperative MRI for better estimation of disease and additional findings, especially in patients with dense breasts. This patient underwent wide excision yielding 8.2 cm of disease with negative margins on final pathology. In this case, the breast MRI gave a more accurate estimation of disease than the mammogram. It is important to note that breast MRI can over-estimate disease extent owing to enhancement of tissue surrounding the tumor related to edema, inflammation, and desmoplastic reaction. The ILC in this case demonstrated a persistent, benign-appearing delayed enhancement pattern. This case illustrates the importance of utilizing morphology as the most important feature to be analyzed, as the kinetic enhancement pattern can be misleading.
Image Findings

Fig. 3.60
Invasive lobular carcinoma (ILC). There is a new focal asymmetry in the upper outer posterior left breast (arrow), spanning 4 cm on the mammographic MLO view (a) and CC view (b). The focal asymmetry persisted on the spot compression views (not shown), but no definite sonographic correlate was reported. The focal asymmetry underwent stereotactic biopsy yielding ILC

Fig. 3.61
Axial T1-weighted (a) and fat-saturated T2-weighted (b) images demonstrate a T1-hypointense and T2-mildly hyperintense irregular region (arrows) in the upper outer left breast, spanning at least 7.8 cm. Localizing clip artifact is seen within the medial aspect of this region (arrowhead on a), which yielded ILC at biopsy. Incidentally noted is curvilinear T2 hyperintensity (arrowheads on b) along the anterior right thorax, consistent with trace pleural fluid. (c) There is irregular nonmass enhancement (arrows) on the axial T1-weighted fat-saturated post-contrast image in the upper outer left breast. (d) Persistent enhancement is denoted by the color blue (arrow). (e, f) Sagittal T1-weighted fat-saturated post-contrast images further illustrate the disease extent (arrows)
3.27 History
A 49-year-old woman with newly diagnosed right breast malignancy. Breast MRI was performed to evaluate extent of disease (Figs. 3.62, 3.63, 3.64, 3.65, 3.66, 3.67, 3.68, and 3.69).


Fig. 3.62
Mammogram. Left (a) and right (b) MLO views. Left (c) and right (d) CC views

Fig. 3.63
Targeted ultrasound image of the right breast

Fig. 3.64
Sagittal post-contrast subtraction images of the medial right breast (a), central right breast (b), and lateral right breast (c, d)

Fig. 3.65
Targeted ultrasound images of the upper outer right breast (a) and retroareolar right breast (b)
3.28 Invasive Lobular Carcinoma 2
Teaching Points
Preoperative breast MRI can detect additional sites of disease in the ipsilateral breast in 20–30 % of cases and in the contralateral breast in 5 % of cases, especially in patients with invasive lobular cancer and dense breasts, as illustrated in this case. Such findings impact clinical management. It is important to note that pathology confirmation is needed to document multicentric disease despite the suspicious appearance of additional findings on MRI. Sonographic features of certain malignancies can be subtle, and breast MRI can help to direct ultrasound for localization of the finding, as shown in this case.
Image Findings

Fig. 3.66
Multicentric invasive lobular carcinoma. Mammography shows a focal asymmetry in the far posterior inferior and slightly medial right breast on MLO (a) and CC (b) views (arrows). The focal asymmetry persisted on spot compression views (not shown), and ultrasound was performed for further evaluation. The MLO view (a) also showed an asymmetry (arrowhead) in the upper right breast without a definite correlate on the CC view, and no sonographic correlate was reported. (c) An asymmetry (arrow) is noted in the posterior lower left breast without a definite correlate on the CC view. The appearance was similar to prior mammograms, and the finding was considered benign

Fig. 3.67
Targeted right breast ultrasound demonstrates a 2.5-cm irregular hypoechoic mass along the 5:00 axis corresponding to the mammographic focal asymmetry. This mass underwent biopsy yielding ILC


Fig. 3.68
Sagittal T1-weighted post-contrast subtraction images of the right breast demonstrate a 3.1-cm irregular mass (a, arrows) in the posterior 5:00 axis of the right breast with central localizing clip artifact (arrowhead), which yielded malignancy on biopsy. Additional suspicious enhancement is noted in the retroareolar right breast (b, arrows) and along the 10:00–10:30 axis (c and d, arrows)

Fig. 3.69
Second-look ultrasound was performed for the additional MRI findings. (a) Targeted ultrasound of the upper outer right breast shows two adjacent mildly hypoechoic masses (arrows) likely corresponding to the areas of 10:00–10:30 MRI enhancement (and, in retrospect, to the mammographic asymmetry). (b) Targeted ultrasound of the retroareolar right breast demonstrates a hypoechoic mass (arrow) likely corresponding to the subareolar MRI enhancement. The 10:00 mass underwent ultrasound-guided biopsy yielding ILC. This proved multicentric disease, and the patient underwent mastectomy rather than lumpectomy
3.29 History
56-year-old patient newly diagnosed with breast cancer undergoing breast MRI extent of disease evaluation (Figs. 3.70, 3.71, 3.72, and 3.73).


Fig. 3.70
(a) Sagittal T1-weighted fat-suppressed image of the left breast. (b) Sagittal post-contrast subtraction image of the left breast. (c) Axial T1-weighted fat-suppressed post-contrast image of both breasts. (d) Sagittal post-contrast subtraction image of the left breast with CAD color overlay

Fig. 3.71


Mammogram. (a) MLO spot compression view of the left breast. Post-biopsy ML view (b) and exaggerated lateral craniocaudal (XCCL) view (c) of the left breast
Stay updated, free articles. Join our Telegram channel

Full access? Get Clinical Tree


