Cardiovascular magnetic resonance (CMR) provides a noninvasive and three-dimensional (3D) assessment of masses involving the cardiac chambers, the pericardium, and extracardiac structures. CMR has become an established method to yield complementary diagnostic information and to guide cardiac surgeons in the design of an appropriate therapeutic strategy. The goals of CMR for assessing cardiac and paracardiac masses are to confirm or to exclude a mass initially suspected by echocardiography, to assess the location, mobility, and its relationship to surrounding tissues, to image the degree of vascularity, to distinguish solid from fluid lesions, and to determine tissue characteristics and the specific nature of a mass.
Technical Considerations
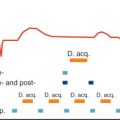
For adequate image quality with reduced motion artifacts, CMR is performed using electrocardiogram (ECG) gating. Alternatively, the navigator techniques allow for combined ECG and respiratory triggering. Spin echo (SE) sequences provide detailed morphologic information of the heart, the great vessels, and the adjacent structures. For T1-weighted sequences, the echo time (TE) is usually 20 to 30 ms, and the repetition time (TR) is dependent on the R-R interval. A longer TR is used for T2-weighted sequences and the TE is typically 50 to 90 ms. T1-weighted images provide a better signal-to-noise ratio (SNR) and excellent soft tissue contrast between epicardial fat, myocardium, and rapidly flowing blood. T2-weighted images have increased image contrast for water-laden tissues with inflammation or necrosis or fluid-filled cysts. However, T2-weighted images in general have worse SNR ( Table 38.1 ).
| Sequence | Technical Features | Indication | Advantages/Disadvantages |
|---|---|---|---|
| T1-weighted spin echo | 8–12 slices, thickness: 6–10 mm, NSA = 2, TE: 20–25 ms, TR: shortest, time 4–6 min, axial, sagittal, and coronal orientation | Defining anatomic structures, delineation of the mass to the adjacent tissue, visualization of vascular walls |
|
| T2-weighted spin echo, double echo | 8–12 slices, thickness: 6–10 mm, NSA = 2, TE: 50, 90 ms, TR: every 2nd or 3rd heartbeat, time: 5–8 min, axial orientation | Detecting the nature of cardiac masses by abnormal T2 values. |
|
| T1- and T2-weighted fast spin echo | Examination time: 2–4 min, also breath-hold technique |
| |
| Short inversion recovery | Inversion pulse, combination with spin echo or TSE | Suppression of fatty tissue | A: Eliminating artifacts from fat signal |
| T1-weighted spin echo with contrast agent administration | Axial orientation, antecubital Gd-DTPA administration (dose: 0, 1 mmol/kg) | Signal intensity behavior of suspected masses, assessment of the degree of vascularity | To assess invasive and infiltrative components of a tumor |
| Cine gradient echo with flow compensation | 1–3 slices, thickness 8–10 mm, TE: 9 ms, TR: shortest, 16 phases NSA = 2, time: 1–3 min | Imaging the hemodynamic effects of a mass, i.e., mobility, transvalvular flow, differentiation between blood flow and thrombus, identify turbulent flow regions |
|
| Cine gradient echo EPI | Breath-hold technique, 1–3 slices, thickness, 8–10 mm, TE: shortest, TR: shortest, time: 10–40 s | Equal to conventional gradient echo |
|
The fast or turbo spin echo (TSE) technique combines the acquisition of multiple profiles per excitation with the multislice mode, resulting in a marked reduction in imaging time. The contrast of those images is similar to that of SE images with the same TR and an equivalent TE. Fat is usually brighter with TSE than regular SE pulse sequences. TSE permits acquisition of T1- and T2-weighted scans in a fraction of time compared with the conventional spin echo sequence. Furthermore, this technique has a reduced susceptibility to motion artifacts and is insensitive to field inhomogeneity. The combination with inversion recovery and breath-hold techniques has led to improved image quality and tissue characterization. When combined with an inversion recovery (IR) technique, the signal from fat can be suppressed by using a short inversion time before the SE pulse. Most tissues have a T1 relaxation time longer than that of fat, resulting in a signal increase on T1- and T2-weighted images. This leads to better contrast in these images. Applications of the IR technique are the distinct recognition of fatty tissues and the improved visualization of structures that are surrounded by fatty tissue, which often makes image analysis complicated.
For evaluation of cardiac function and tumor mobility, gradient recalled echo (GRE) techniques (TE 4–12 ms) are recommended. GRE images are generally T1 weighted and are characterized by bright signal intensity (SI) from rapidly flowing blood, which is useful for the differentiation of thrombus or the assessment of turbulent flow in case of valvular regurgitation or intracardiac shunts. Because of the low soft tissue contrast, visualization of cardiac masses is not as adequate as with SE techniques, unless they are intraluminal. Steady-state free precession (SSFP) is a type of GRE optimized for assessment of cardiac function, offering the highest SNR per unit of time of all imaging sequences. The resulting weighting relies on a T2/T1 ratio, where both fat and water return high signal as opposed to low signal from the myocardium. Because of the intrinsic homogeneous contrast between the blood pool and the heart during the cardiac cycle, along with an excellent spatial and temporal resolution, SSFP is the sequence of choice to assess the dynamic relationship of masses with the heart and vessels.
Unlike two-dimensional (2D) echocardiography, CMR has the potential to some extent for tissue characterization by comparing the T1 and T2 values of the mass to a reference tissue: that is based on the observation that significant differences exist in T1 and T2 relaxation times. Previous studies have tried to determine specific T1 and T2 relaxation times of different tissues ; however, precise etiologic diagnoses are not possible. T1 and T2 mapping CMR is a novel parametric approach to tissue characterization and has shown promising results for the assessment of cardiac thrombus and may have a potential role in overcoming some of the limitations.
Contrast Agents
The most commonly used CMR contrast agent uses the paramagnetic element gadolinium in a complex with chelating molecules (e.g., with diethylenetriaminepentaacetic acid [DTPA] ) to reduce toxicity. A number of agents are available. The distribution of nearly all currently available intravenous contrast agents is extracellular and contrast is enhanced on T1-weighted images. The normal concentration is 0.1 mmol/kg body weight. Gadolinium provides a better delineation of the mass by different enhancement of myocardium and tumor tissue because of variation of tissue vascularity.
Benign Tumors of the Heart
Primary tumors of the heart are very rare, with an estimated incidence between 0.002% and 0.2% in unselected patients at autopsy. Three-quarters of the tumors are benign and nearly half of them are myxomas and about 10% are lipomas. Fibroelastomas, rhabdomyomas, fibromas, hemangiomas, teratomas, and mesotheliomas are found less frequently. Granular cell tumors, neurofibromas, and lymphangiomas are very rare.
Myxoma
Myxomas comprise 30% to 50% of all primary cardiac tumors, occur frequently between the third and sixth decade of life, and have a slight female predominance. In about 75%, myxomas originate from the left atrium, and in 15% to 20% from the right atrium. They usually develop from the interatrial septum close to the fossa ovalis. Only a few myxomas are located in the ventricles. Myxomas are generally sporadic, but may occur in multiple and unusual locations, usually as part of the autosomal dominant syndrome known as Carney complex, which is present in about 7% of cases, and also includes lentiginosis and endocrine overactivity. Rare aneurysmatic formations of part of the septum secundum can lead to a gallbladder-like cystic structure and can mimic an atrial myxoma by CMR. The histologic structure shows a typical matrix of myxoma cells, large blood vessels at the base, and variable areas of hemorrhage, calcification, or even ossification. They are generally polypoid, often pedunculated, round or oval with a smooth surface, often covered with thrombi, and are between 1 and 15 cm in diameter. Clinical symptoms appear as a consequence of embolism or intracardiac obstruction and are determined by size, location, and mobility of the myxoma.
On CMR, myxomas ( Fig. 38.1 ) are mainly diagnosed by the typically pedunculated, jellylike, and prolapsing appearance and certain signal characteristics. Therefore cine display should be obtained to show the mobility of the tumor. Due to the endocardial origin, myxomas are characterized by an intermediate, but variable signal on SE images, similar to that of the myocardium. On SSFP images, myxomas tend to be isointense or slightly hyperintense relative to the myocardium but hypointense relative to the blood pool. Therefore the tumor can always be distinguished from the higher signal of the surrounding slowly flowing blood. Intratumorous areas of subacute or chronic hemorrhage are typically characterized by high SI on both short and long TE. Myxomas show a moderately high and heterogeneous contrast enhancement after intravenous injection of gadolinium, typically at the core, which appears to be the result of relatively high vascularity. However, organizing thrombus may occur in the tumor, which will be responsible for areas of low SI on gadolinium imaging.

Lipoma
Cardiac lipomas ( Fig. 38.2 ) are relatively common and account for about 10% of all primary tumors of the heart. True lipomas are encapsulated, contain neoplastic fat cells, and occur in young age. About 50% arise subendocardially, 25% subepicardially, and 25% from the myocardium. Subepicardial lipomas may become quite large and may alter cardiac function, resulting in dyspnea or fatigue, and involvement of the coronary arteries has also been reported. Endocardial lipomas commonly arise from the interatrial septum and are located in the right atrium. Arrhythmias due to myocardial infiltration have been reported. Lipomatous hypertrophy of the atrial septum ( Fig. 38.3 ) is histologically characterized by infiltration of lipomatous cells between atrial muscle fibers. Unlike true lipomas they are unencapsulated and contain lipoblasts as well as mature fat cells. This condition has been described in older, overweight patients who frequently have atrial fibrillation.


On CMR, lipomas are characterized by bright signal on T1-weighted images and a slight decrease in signal on T2-weighted images similar to subcutaneous fat. Injection of gadolinium is not needed because the SI will remain unchanged. A drop in SI using the fat presaturation technique verifies the diagnosis. In lipomatous hypertrophy a bilobed atrial septum thickening with an SI comparable to subcutaneous fat on T1- and T2-weighted images can be visualized. In contrast to the benign lipomatous hypertrophy, the very rare liposarcoma usually shows infiltration, inhomogeneities, and fast tumor growth.
Papillary Fibroelastoma
Papillary fibroelastomas are the commonest tumors of cardiac valves. These papillary structures consist of elastin and collagen layers covered by endothelium, and predominantly involve the left side of the heart. The aortic valve is most frequently involved, followed by the mitral valve and left ventricular outflow tract. Recognition is important, because neurologic events caused by embolization are common complications. Because fibroelastomas are relatively small (usually <10 mm) and mobile structures, echocardiography is the preferred imaging modality. On CMR, they usually present as regular and round lesions attached to the cardiac valves or endothelium. They have low signal on GRE, appear isointense on T1-weighted images and hyperintense on T2-weighted images. Despite being relatively avascular, enhancement is usually seen with late gadolinium imaging ( Fig. 38.4 ).

Fibroma
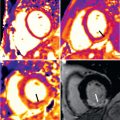
Fibromas are congenital tumors often discovered at young adulthood. They are located intramyocardially and frequently within the ventricular septum. The left ventricle is more often involved than the right ventricle. On T1-weighted SE images, fibromas tend to be isointense compared with skeletal muscle. Because of the short T2 relaxation time of fibrous tissue, fibromas show a decrease in SI relative to the myocardium on T2-weighted SE images. These masses have low signal on perfusion images and early after gadolinium injection because of low tumor vascularity. However, late after gadolinium injection, they typically show significant enhancement ( Fig. 38.5 ), presumably because of the increased collagen and elastic tissue surrounding the fibroblastic-type tumor cells. Surgical excision is recommended even in asymptomatic patients, attributed to the potential risk of sudden death caused by arrhythmias.

Rhabdomyoma
Rhabdomyomas are also congenital in origin and the commonest heart tumors diagnosed in fetuses and infants. They characteristically arise from the ventricular myocardium at multiple locations as opposed to fibromas, which are usually solitary. In about 50% of patients, tuberous sclerosis can be diagnosed. Rhabdomyomas have typically a solid and homogeneous appearance, are often isointense to the myocardium on T1-weighted images, and slightly hyperintense on T2-weighted images. These masses typically enhance after gadolinium injection ( Fig. 38.6 ).

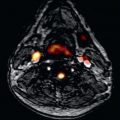
Hemangioma
There are only a few cases reported of arteriovenous hemangiomas of the interventricular septum of the heart. The location of the tumor is predominantly at the right or left ventricular free walls, but involvement of the septum and multiple locations have been reported. The distinction between a hemangioma and a vascular malformation can be difficult. On CMR, hemangiomas are characterized as regions of increased SI on T1- and T2-weighted images compared with the myocardium because of slow flowing blood. They characteristically show rapid filling during first-pass perfusion, sometimes with higher SI relative to the adjacent myocardium, owing to the vascular nature of the tumor. In large lesions, filling can be initially appreciated in the periphery, with subsequent centripetal filling of core. The enhancement often persists in the latter stages after intravenous gadolinium injection ( Fig. 38.7 ).

Leiomyomatosis With Intracardiac Extension
Intravenous leiomyomatosis is a rare pathologic entity, and all tumors have been observed in females, most of whom were white and premenopausal. The tumor arises either from a uterine myoma or from the wall of the vessel. The tumor generally appears as a large mobile mass in the right atrium ( Fig. 38.8 ). Because the preoperative evaluation should include assessment of all cardiac chambers and the region of the inferior vena cava, CMR can be considered to be a primary diagnostic method. As a result of the myomatous tissue, SI characteristics are similar to that of muscle.

Other Benign Tumors
There are a large number of unusual conditions affecting the heart causing tumors. These may be degenerative, such as mitral annular calcification, infective, such as hydatid cysts ( Fig. 38.9 ), or inflammatory (Behçet syndrome mimicking myxoma), among other rare causes.

Mitral annular calcification (MAC) is a chronic noninflammatory process characterized by calcium deposition in the annular fibrous ring of the mitral valve. It usually occurs at an older age and is linked to chronic renal disease and abnormalities of calcium phosphate metabolism. It presents as an immobile mass in the basal posterior mitral valve and adjacent ventricular myocardium, although in more severe cases it can extend circumferentially to involve the whole annulus. It is characterized by a low signal on GRE, T1- and T2-weighted sequences. After intravenous gadolinium administration, there is no enhancement at the core as opposed to a peripheral rim of circumferential enhancement, in keeping with a calcified core surrounded by a fibrotic envelope. Caseous calcification of the mitral valve is a rare variant of MAC, in which the mass undergoes liquefaction necrosis. The core is a mixture of fatty acids, cholesterol, and amorphous eosinophilic material encased by a rim of fibrosis, calcification, and inflammatory cell infiltration. As a result, the fatty proteinaceous material in the core can generate high signal on T1-weighted images (and on T2-weighted images as well), as opposed to the low signal in MAC. Another differentiating sign will be the central enhancement in both early and late phases after gadolinium injection. These entities are believed to be benign because they are usually asymptomatic and discovered as incidental findings. However, complications such as mitral stenosis or regurgitation, embolization, and infective endocarditis have been described, all of which may prompt surgical intervention.
Malignant Tumors of the Heart
Nearly 25% of all primary cardiac tumors are malignant tumors. Metastases are 20 to 40 times more common than primary malignant tumors and appear in 6% of postmortems in malignant diseases. The most common primary malignant cardiac tumors are various types of sarcomas and lymphomas.
Because of the small number of studied cardiac malignancies, and the differences in tumor age and vascularity, and a widespread variability in water content, a reliable tissue differentiation of cardiac malignancies is often not possible. Distinct features of malignant tumors are the presence of necrosis, calcification, a high degree of vascularity, infiltration of the adjacent tissues, inhomogeneous appearance, and peritumorous edema.
Sarcoma
Sarcomas of the heart or the great vessels comprise the largest group, accounting for 75% of all primary malignant cardiac tumors in adults. There are various histologic types of sarcoma, such as angiosarcomas, leiomyosarcomas, fibrosarcomas, synovial sarcomas, rhabdomyosarcomas, undifferentiated pleomorphic sarcomas, and liposarcomas. Angiosarcoma ( Fig. 38.10 ) is the most frequent primary malignant cardiac tumor. It is located within the right atrium near the atrioventricular groove in 80% of cases. They appear preferentially between the third and fifth decade of life, with a male-to-female ratio of about 2 : 1. In contrast, other types of sarcoma often occur in the left side of the heart, where they are often clinically mistaken for myxoma. Morphologically, angiosarcomas are usually hemorrhagic, often with poorly defined borders. They frequently invade contiguous structures such as the venae cavae and tricuspid valve, and are characterized by irregular anastomosing sinusoidal structures with papillary intraluminal tufting. On CMR, angiosarcomas have a polymorphic appearance, with a central region of hyperintensity consistent with necrosis, and moderate SI in peripheral regions in T1- and T2-weighted images. Because of the high degree of vascularity, signal enhancement is seen after intravenous injection of gadolinium. The typical appearance of angiosarcoma on CMR is a “cauliflower” aspect on black-blood images and an avid enhancement with “sunray” aspect after administration of contrast agent.

Primary leiomyosarcomas are rare, highly aggressive, locally invasive tumors with a frequency of 0.25%. They arise in 75% from the inferior vena cava, but also have been reported with an origin of the superior vena cava or in the pulmonary veins. This neoplasm demonstrates a SI on T1-weighted SE images slightly higher than liver parenchyma, but not as bright as the adjacent mediastinal fat. The SI is high on T2. After injection of gadolinium, a slight contrast enhancement of the tumor can be detected. The advantage of CMR is the ability to assess intravascular tumor extension into the superior vena cava, the pulmonary veins, and the heart chambers.
Liposarcomas ( Fig. 38.11 ) are very rare and not represented in most surgical series of tumors. Grossly, they are bulky tumors as large as 10 cm. Liposarcomas often have a pericardial origin and CMR is able to detect this pericardial mass with heterogeneous high signal on T1-weighted images and epicardial infiltration. After injection of gadolinium, liposarcomas may show a slight signal enhancement.

Related posts:
 Use of Navigator Echoes in Cardiovascular Magnetic Resonance and Factors Affecting Their Implementation
 Clinical Cardiovascular Magnetic Resonance Imaging Techniques
 Atherosclerotic Plaque Imaging: Aorta and Carotid
 T1 and T2 Mapping and Extracellular Volume in Cardiomyopathy
 Cardiovascular Magnetic Resonance Assessment of Right Ventricular Anatomy and Function
 Noncardiac Pathology
Stay updated, free articles. Join our Telegram channel

Full access? Get Clinical Tree


