Accurate noninvasive assessment of right ventricular (RV) mass and systolic function is important in several pathologies, such as grown-up congenital heart disease, pulmonary hypertension, interstitial lung disease, valvular heart disease, and arrhythmogenic RV cardiomyopathy. Right ventricular function is also a prognostic factor in coronary artery disease and heart failure, even after cardiac resynchronization therapy. This chapter aims to summarize the features of the normal right ventricle, briefly describe cardiovascular magnetic resonance (CMR) techniques for assessing RV dimensions and function, and give reference values for the assessment of the right ventricle.
Normal Right Ventricular Anatomy
The right ventricle is a thin, highly trabeculated structure that is triangular in form and, on gross inspection, appears to be wrapped around the left ventricle. It has three well-differentiated components with specific structure and function. The inlet portion extends from the tricuspid valve to the insertions of the papillary muscles on the ventricular wall, the trabecular portion involves the RV body and apex and is the main pumping component, and the outlet portion or infundibulum extends up to the pulmonary valve and has a thin, nontrabeculated wall ( Fig. 39.1 ). The anterosuperior wall of the right ventricle is rounded and convex, its inferior surface is flattened and forms a small part of the diaphragmatic surface of the heart, and its posterior wall is formed by the ventricular septum, which bulges into the right ventricle, owing to the much greater left ventricular (LV) systolic pressure, so a transverse section of the cavity presents a semilunar outline. The right ventricle has a continuum of muscle bands that rotate by approximately 160 degrees from the epicardium to the endocardium. The principal axis of these fibers is oblique to the long axis of the right ventricle. RV contraction is then more dependent on longitudinal shortening than that of the LV. In the normal adult, the total RV free wall mass is 21 ± 13 g/m 2 .

The right ventricle has several distinctive features. In its upper left portion, there is a conical pouch called the conus arteriosus or infundibulum, from which the pulmonary artery arises. A tendinous band connects the posterior surface of the conus arteriosus to the aorta. Also, as a subpulmonary ventricle, the RV has a lower ejection fraction and thinner walls than the left ventricle. RV wall thickness is usually 3 to 5 mm, the proportion between right ventricle and left ventricle being as 1 to 3 ; it is thickest at the base and gradually becomes thinner toward the apex. The whole inner surface except the conus arteriosus is covered by more or less prominent muscular columns called trabeculae carneae and from some of them (papillary muscles), the chordae tendineae connect the myocardium to the tricuspid valve, with its septal leaflet more apically placed than the septal leaflet of the mitral valve. The anterior tricuspid valve leaflet is usually the largest and extends from the infundibular region anteriorly to the inferolateral wall posteriorly; the septal leaflet extends from the interventricular septum to the posterior ventricular border; the posterior leaflet attaches along the posterior margin of the annulus from the septum to the inferolateral wall. Finally, a muscular band frequently extends from the base of the anterior papillary muscle to the ventricular septum. This band is considered to prevent overdistension of the ventricle and is called the moderator band.
The depictions of the moderator band, the infundibulum, and the different levels of insertion of the tricuspid and mitral septal leaflets are important diagnostic features for identification of the right ventricle, which can be difficult in some congenital cardiomyopathies.
Importance of Assessing Right Ventricular Dimensions and Function
The measurement of RV dimensions, morphology, and function is important in several situations, such as congenital heart disease, LV heart failure, pulmonary hypertension, pulmonary embolism, valvular heart disease, lung disease, and arrhythmogenic RV cardiomyopathy.
RV failure may result from conditions that lead to impaired RV contractility, such as RV infarction, right-sided cardiomyopathies, valvular heart disease or severe sepsis; to RV pressure overload, including pulmonic stenosis, pulmonary primary hypertension, and pulmonary hypertension secondary to left heart disease, lung disease, or thromboembolic disease; and to RV volume overload, for instance, tricuspid or pulmonary regurgitation. Many disorders, such as corrected and uncorrected adult congenital heart disease and intracardiac shunts, may result in right ventricle failure through a combination of pathophysiologic mechanisms. Also, decompensated right ventricle (both acute and acute-on-chronic) is increasing as the prevalence of predisposing conditions grows.
The prognostic value of RV function has been shown in several conditions such as LV heart failure, valvular heart disease, pulmonary hypertension, congenital heart disease, or myocardial infarction (MI). Thus the early detection of RV dysfunction can have an impact on therapeutic decision making and on prognosis. Finally, improved understanding of the RV response to pressure and volume overload might lead to more optimal surgical and medical treatments.
Techniques for Assessing Right Ventricular Dimensions and Function
Global RV function has been traditionally difficult to assess, given its irregular shape, which cannot be assumed to any geometrical model. Several imaging techniques have been used in the past to assess RV dimensions and function. The chest radiograph is a simple method to assess RV size with the cardiothoracic ratio, but this may be misleading because an enlarged RV may compress the LV, resulting in a normal cardiothoracic ratio. Angiography used to be the gold standard for assessment of RV volumes and regional and global function. But this technique is invasive, involves ionizing radiation and the use of potentially nephrotoxic contrast, and is not as accurate as CMR. Echocardiography and radionuclide ventriculography have been used for the assessment of RV dimensions and function. More recently, “nongeometric” techniques such as three-dimensional (3D) echocardiography, CMR, and multidetector-row computed tomography (CT) permit accurate assessment of RV volumes, function, and mass.
Echocardiography
Echocardiography is the most frequently used technique for assessing the right ventricle; it is cheap, widely available, and can be used bedside in very ill patients. It provides information about RV morphology, dimensions, septum convexity, function, tricuspid regurgitation, and estimates of pulmonary arterial pressure and RV pressure. But the assessment of the right ventricle with echocardiography has several limitations. First, the location of the right ventricle behind the sternum restricts the window that can be accessed by the ultrasound beam. Second, the complex shape and thin walls of the right ventricle make it necessary to image the right ventricle from several projections, although the short-axis view is usually the most helpful. Third, the thick trabeculations in the chamber may be confused with a thrombus, a tumor, or hypertrophic cardiomyopathy. Finally, there is a lack of accurate mathematical models to quantify RV mass and volumes with M-mode or two-dimensional echocardiography (2DE) because quantitative measurements are based on geometric assumptions that do not apply to the right ventricle. A qualitative approach for RV volume assessment is usually applied, with the RV size being described as either normal or mildly, moderately, or severely enlarged. If the RV is the same size as the LV, it is usually characterized as moderately enlarged, and if larger than the LV, it is severely enlarged. Also, qualitative evaluation of RV function is usually applied with RV characterized as normal or mildly, moderately, or severely dysfunctional. An approximation to quantification has been introduced with M-mode measurement of the tricuspid annular plane systolic excursion (TAPSE). This parameter provides a rough estimate of RV function but it is not angle independent: it only takes into account the longitudinal function of the RV, which is the predominant, but not unique, component of RV systolic function, and, because it is measured at the basal segment, the presence of regional wall motion abnormalities will affect its accuracy. The fractional area change in the four-chamber view has also been used but, again, this takes into account only the lateral free wall and the presence of regional wall motion abnormalities or RV dilatation might affect its accuracy ( Fig. 39.2 ). Other indicators of RV function are flow Doppler-derived indices such as the myocardial performance index, tissue Doppler measurements of myocardial tricuspid annular myocardial velocities and time intervals, and strain and strain rate measurements of contractility whether with tissue Doppler or speckle tracking imaging (STI). Tissue Doppler is an angle-dependent technique, and incorrect alignment with the ultrasound beam, poor signal-to-noise ratio (SNR) and variability because of placement of the region of interest may affect the results. Speckle tracking imaging is a promising technique that has been applied to the right ventricle to measure longitudinal strain in the six segments in which the right ventricle is classically divided. This technique is useful for the diagnosis of various right heart diseases, but it may have problems in the case of thin wall or poor image quality in the RV lateral wall, and there is variability across vendors. Doppler transesophageal echocardiography is another echocardiographic method of RV assessment, but it is semiinvasive, is not well suited for evaluation of anteriorly positioned right ventricles, and requires special skills. Three-dimensional echocardiography (3DE) has emerged as a more accurate and reproducible approach to ventricular quantitation, mainly by avoiding the use of geometric assumptions of the ventricular shape. Real-time 3DE is an online acquisition of a 3D dataset of the heart without the need for electrocardiographic and respiratory gating. It calculates right ventricular ejection fraction (RVEF) using the volumetric semiautomated border detection method, which needs to be manually adjusted, and after acquisition and display of end-diastolic and end-systolic frame, long-axis, planes, and volumetric data of the right ventricle are analyzed offline. Eventually, curves of regional and global RVEF are produced and analyzed. However, there are practical problems, such as full cardiac visualization, good-quality endocardial border recognition for manual endocardial tracing, and time consumption. Also, these methods need a stable cardiac rhythm and constant cardiac function during image acquisition, although new single-beat 3DE techniques allow a fast acquisition in one short breath-hold. 3DE has been compared with CMR for the evaluation of RV function, and improved results in comparison with 2D echocardiography have been obtained, both with the usual technique and with the new single-beat 3DE, with consistent underestimation of RV volumes and ejection fraction with 3DE. Although 3DE has been used mainly for the left ventricle, assessment of the right ventricle with 3DE is feasible during routine standard echocardiography.

Radionuclide Angiography
This technique provides a reliable quantitative measurement of ventricular function not based on geometric assumptions with good agreement with CMR. Although echocardiography and CMR are the two most commonly used imaging techniques for noninvasive assessment of the right ventricle, nuclear imaging provides new opportunities for comprehensive evaluation of the right ventricle from a single study, because it can assess RV perfusion and metabolism as well as morphology and ejection fraction. Some years ago this technique did not work well for the right ventricle, owing to problems such as the limited count numbers in this chamber and the overlap of other cardiac chambers. Currently, gated positron emission tomography (PET) has shown moderate-to-high correlation with CMR and CT in the assessments of RV volume and ejection fraction simultaneously with quantification of myocardial glucose metabolism in conditions such as pulmonary hypertension. Gated blood-pool single-photon emission computed tomography (SPECT) appears a promising technique because it does not require geometric assumptions and provides both global and regional RV function quantification with good diagnostic accuracy compared with CMR. Still, these techniques have disadvantages compared with other imaging modalities, such as poor resolution, the use of ionizing radiation, the need for an adequate bolus injection for first-pass studies and a regular rhythm, and the lack of clinical experience. Therefore they have been of limited use for the study of the right ventricle so far.
Multislice Computed Tomography
Multislice CT (MSCT), although not a first-line technique for RV function quantification, is emerging as an alternative tool, especially for patients with implantable devices (a contraindication for CMR). However, MSCT uses ionizing radiation and potentially nephrotoxic contrast, and requires a low and stable heart rate during acquisition. The quantification of ventricular volumes throughout the cardiac cycle requires retrospective electrocardiogram (ECG)-gated helical acquisition, which increases the radiation significantly. Postprocessing is with either a volume threshold approach or, similar to CMR, myocardial analysis is automated but most times requires manual adjustment ( Fig. 39.3 ). In a study that compared accuracy and reproducibility of MSCT with CMR in the quantification of RV function, spiral MSCT with reconstruction at 5% intervals had good agreement with CMR for RVEF and volumes, with good accuracy and reproducibility, but at the expense of an average radiation dose of 12 to 18 mSv. Another study that compared volumetric quantification of RV-shaped phantoms with CMR, MSCT, and real-time 3DE showed that CMR images yielded the most accurate measurements, whereas MSCT measurements showed slight but consistent overestimation; and 3DE showed small underestimation.

Cardiovascular Magnetic Resonance
CMR has some important advantages over other imaging techniques, which have led to the growing enthusiasm for its use. CMR offers accurate and reproducible tomographic, static, or cine images of high spatial and temporal resolution in any desired plane without exposure to contrast agents or ionizing radiation. It allows the acquisition of true RV short-axis images encompassing the entire right ventricle with high spatial and temporal resolution, thereby providing highly accurate and reproducible quantitative RV mass and functional data regardless of its position in the thorax. Nowadays, this technique is considered the gold standard for quantitative assessment of RV volume, mass, and function.
Imaging Strategies for Cardiovascular Magnetic Resonance of the Right Ventricle
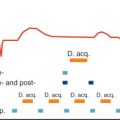
Before the study begins, it is essential to obtain an accurate ECG gating with minimal ectopy and to instruct the patient in breath-holding. Sometimes oxygen may be applied to improve breath-hold length. Ventricular ectopy can be a problem, mainly in patients with congenital heart disease or with suspicion of arrhythmogenic RV cardiomyopathy (ARVC). If this condition is present, pretreatment with an antiarrhythmic agent should be considered or, if this is unavailable or unsuccessful, prospective triggering with acquisition window limited to systole can diminish artifacts.
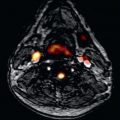
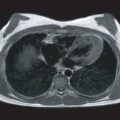
Spin echo (black-blood) sequences (including turbo spin echo, half-Fourier acquisition single-shot turbo spin echo, or spin echo-echo planar imaging) are used mainly for anatomic assessment ( Fig. 39.4 ), because the detection of fatty replacement/infiltration in the RV free wall is subject to high interobserver variability and, at the moment, is not considered a diagnostic criteria for ARVC to improve their specificity.

Functional evaluation of the RV is performed by using steady-state free precession (SSFP) cines with segmented fast imaging, allowing the whole stack of images to be acquired in 5 to 8 minutes, thereby reducing breathing and movement artifact ( Fig. 39.5 ). Moreover, real-time SSFP imaging can acquire the whole stack in just one breath-hold with acceptable accuracy and image quality. In patients who are unable to hold their breath consistently, solutions using the same sequence with more signal averages or combined with navigator echo are successful with free breathing, with a slight increase in the scanning time.

RV function can be estimated by CMR, in a way analogous to echocardiography, with the fractional area change method ( Fig. 39.6 ). This is a fast method but lacks accuracy, owing to the need for geometric assumptions. A better method of measuring volumes, and thereby function, is by using Simpson’s rule. This method requires a stack of contiguous tomographic slices to be acquired that encompass both ventricles entirely.

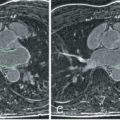
The right ventricle is well shown in the transaxial plane from the tricuspid valve to the apex. Consequently, a stack of transverse images was primarily used for quantification, with good agreement with pulmonary flow and LV stroke volume ( Fig. 39.7 ), as well as better interobserver and intraobserver reproducibility than the short-axis plane. However, it can be problematic because it is subject to considerable partial volume effects, especially in the anterior and inferior walls. The question has been raised as to whether the RV volumes should always be measured in the axial orientation. Yet the interstudy reproducibility of RV measurements in the short-axis orientation is good, with differences not clinically significant and this orientation allows the LV and RV dimensions to be measured simultaneously, thus saving time ( Fig. 39.8 ). A recent study has shown comparable reproducibility for the two approaches when measuring volumes of the systemic right ventricle in 22 patients with congenital heart disease. Although ejection fraction and stroke volume were measured more consistently in the axial orientation, ventricular mass was measured more consistently in the short-axis orientation. Nowadays, nearly all CMR units have adopted the short-axis stack approach, leaving the axial orientation for specific congenital heart disease patients.


As commented, Simpson’s rule is used for measuring volumes and function. A standardized method of combined ventricular functional analysis is described in Chapter 16 . When using this method, it is critical to ensure that the most basal part of the free wall of the right ventricle in diastole is included in the most basal cine slice because it can be easily truncated. Manual or semiautomatic planimetry of the endocardial borders of each ventricle at both end diastole and end systole and of the epicardial borders at end diastole is done. Care must be taken to exclude the right and left atria as they come into the basal imaging planes during systole. The ventricular volume is equal to the sum of the endocardial areas multiplied by the distance between the centers of each slice ( Fig. 39.9 ). The stroke volume is equal to the difference between the end-diastolic volume (EDV) and the end-systolic volume (ESV). The ejection fraction (EF) is calculated as the stroke volume divided by the EDV. The mass is calculated as the volume of tissue occupied by the free wall multiplied by an assumed density of 1.05 g/mL. The volumes obtained by this method are independent of geometric assumptions and dimensionally accurate. Mass measurements agree well with autopsy studies. RV parameters obtained with this technique are reproducible, with an interobserver variability of 6.3% for EDV, 8.6% for ESV, 7% for stroke volume, 4.4% for EF, and 7.8% for RV mass and an intraobserver variability of 3.6% for EDV, 6.5% for ESV, 5.9% for stroke volume, 4% for EF, and 5.7% for RV mass. Current analysis software allows for automated quantification of the RV, with automated endocardial border detection of the right ventricle in contiguous short-axis slices and tracking of the tricuspid valve throughout the cardiac cycle. A volume–time curve can then be produced from which a velocity–time curve can be derived for subsequent calculation of diastolic function parameters.

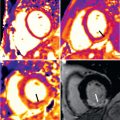
If necessary, other CMR techniques could be used in the assessment of the right ventricle. Flow velocity maps allow for accurate assessment of pulmonary valve regurgitation (regurgitant fraction) and systemic-to-pulmonary flow ratio. Magnetic resonance angiography (MRA) must be done in case assessment of great vessel anatomy is advisable, such as in a number of congenital cardiac conditions. New free-breathing time resolved MRA techniques enable accurate diagnosis and vessel measures compared with conventional breath-hold MRA and can be performed in children and adults who find breath-holding difficult. Recently, four-dimensional (4D) flow has been shown to be able to detect mild impairment of RV function in a small group of patients with ischemic heart disease, and RV kinetic energy, a 4D flow-derived parameter, has been suggested as a more robust measure of RV efficiency than RV function. Diffusion tensor imaging has also been applied to the assessment of RV fibers’ geometry. Although promising, these techniques are still in development and more work is needed to fully understand all the information that can be derived from them, along with their potential clinical use ( Fig. 39.10 ). Myocardial tissue tagging, feature tracking, and myocardial phase contrast are briefly summarized later. Finally, CMR with LGE can detect myocardial fibrosis in a number of both ischemic and nonischemic cardiomyopathies.

Normal Right Ventricular Volumes and Systolic Function
There have been a number of human series describing the normal characteristics of RV size and function using autopsy, echocardiography, x-ray angiography, radionuclide angiography, CMR, and ultrafast CT. We have reported on RV reference parameters for mass, volumes, and systolic and diastolic function using cine SSFP CMR techniques and analysis from 120 healthy adult subjects. These gender-specific data are summarized in Tables 39.1–39.5 . We observed that many clinical parameters of RV volumes and systolic and diastolic function are significantly dependent on gender, age, and body surface area (BSA). On multivariable analysis, BSA was found to significantly influence RV mass, EDV, ESV, stroke volume, and early tricuspid peak filling rate (PFR E ). Gender had a significant independent influence on absolute and normalized RV mass, EDV, and stroke volume ( Figs. 39.11 and 39.12 ). It was also an independent predictor of absolute and normalized active tricuspid peak filling rate (PFR A , PFR A /BSA). There was a significant decrease with age of normalized RV mass and of absolute and normalized EDV and ESV in both males and females. There was a significant increase with age in absolute RVEF in both males and females and a significant increase in normalized EF in males. For diastolic function, absolute and normalized PFR E decreased significantly with age in males and females, whereas absolute and normalized PFR A increased in males. Accordingly, PFR E /PFR A decreased significantly. In a multivariable analysis, age was an independent predictor of absolute and normalized ventricular mass and volumes (EDV, ESV, stroke volume, EDV/BSA, ESV/BSA, stroke volume/BSA) and of EF. It was also an independent predictor of diastolic variables (PFR E , PFR A , PFR E /PFR A , PFR E /EDV, PFR A /EDV, PFR E /BSA, PFR A /BSA). Thus the interpretation of RV parameters in borderline clinical cases, especially in arrhythmogenic RV cardiomyopathy, cardiovascular shunting, and adult congenital heart disease, should be referred to age-, gender-, and BSA-normalized values to determine normality or severity of abnormality. In 2016 new sex-specific normative values for RV measurements with CMR obtained from a much larger series of 1336 adults (64 ± 9 years, 576 men) free of prevalent cardiovascular and pulmonary disease have been published, with slight differences in methodology.
| 20–29 Years | 30–39 Years | 40–49 Years | 50–59 Years | 60–69 Years | 70–79 Years | |
|---|---|---|---|---|---|---|
| Absolute Values | ||||||
| EDV (mL) SD 25.4 | 177 (127–227) | 171 (121–221) | 166 (116–216) | 160 (111–210) | 155 (105–205) | 150 (100–200) |
| ESV (mL) SD 15.2 | 68 (38–98) | 64 (34–94) | 59 (29–89) | 55 (25–85) | 50 (20–80) | 46 (16–76) |
| SV (mL) SD 17.4 | 108 (74–143) | 108 (74–142) | 107 (73–141) | 106 (72–140) | 105 (71–139) | 104 (70–138) |
| EF (%) SD 6.5 | 61 (48–74) | 63 (50–76) | 65 (52–77) | 66 (53–79) | 68 (55–81) | 70 (57–83) |
| Mass (g) SD 14.4 | 70 (42–99) | 69 (40–97) | 67 (39–95) | 65 (37–94) | 63 (35–92) | 62 (33–90) |
| Normalized to BSA | ||||||
| EDV/BSA (mL/m 2 ) SD 11.7 | 91 (68–114) | 88 (65–111) | 85 (62–108) | 82 (59–105) | 79 (56–101) | 75 (52–98) |
| ESV/BSA (mL/m 2 ) SD 7.4 | 35 (21–50) | 33 (18–47) | 30 (16–45) | 28 (13–42) | 25 (11–40) | 23 (8–37) |
| SV/BSA (mL/m 2 ) SD 8.2 | 56 (40–72) | 55 (39–71) | 55 (39–71) | 54 (38–70) | 53 (37–69) | 52 (36–69) |
| EF/BSA (%/m 2 ) SD 4 | 32 (24–40) | 32 (25–40) | 33 (25–41) | 34 (26–42) | 35 (27–42) | 35 (27–43) |
| Mass/BSA (g/m 2 ) SD 6.8 | 36 (23–50) | 35 (22–49) | 34 (21–48) | 33 (20–46) | 32 (19–45) | 31 (18–44) |
| 20–29 Years | 30–39 Years | 40–49 Years | 50–59 Years | 60–69 Years | 70–79 Years | |
|---|---|---|---|---|---|---|
| Absolute Values | ||||||
| EDV (mL) SD 21.6 | 142 (100–184) | 136 (94–178) | 130 (87–172) | 124 (81–166) | 117 (75–160) | 111 (69–153) |
| ESV (mL) SD 13.3 | 55 (29–82) | 51 (25–77) | 46 (20–72) | 42 (15–68) | 37 (11–63) | 32 (6–58) |
| SV (mL) SD 13.1 | 87 (61–112) | 85 (59–111) | 84 (58–109) | 82 (56–108) | 80 (55–106) | 79 (53–105) |
| EF (%) SD 6 | 61 (49–73) | 63 (51–75) | 65 (53–77) | 67 (55–79) | 69 (57–81) | 71 (59–83) |
| Mass (g) SD 10.6 | 54 (33–74) | 51 (31–72) | 49 (28–70) | 47 (26–68) | 45 (24–66) | 43 (22–63) |
| Normalized to BSA | ||||||
| EDV/BSA (mL/m 2 ) SD 9.4 | 84 (65–102) | 80 (61–98) | 76 (57–94) | 72 (53–90) | 68 (49–86) | 64 (45–82) |
| ESV/BSA (mL/m 2 ) SD 6.6 | 32 (20–45) | 30 (17–43) | 27 (14–40) | 24 (11–37) | 21 (8–34) | 19 (6–32) |
| SV/BSA (mL/m 2 ) SD 6.1 | 51 (39–63) | 50 (38–62) | 49 (37–61) | 48 (36–60) | 46 (34–58) | 45 (33–57) |
| EF/BSA (%/m 2 ) SD 5.2 | 37 (27–47) | 38 (27–48) | 38 (28–49) | 39 (29–49) | 40 (30–50) | 41 (31–51) |
| Mass/BSA (g/m 2 ) SD 5.2 | 32 (22–42) | 30 (20–40) | 29 (19–39) | 27 (17–37) | 26 (16–36) | 24 (14–35) |
Related posts:
 Use of Navigator Echoes in Cardiovascular Magnetic Resonance and Factors Affecting Their Implementation
 Atherosclerotic Plaque Imaging: Aorta and Carotid
 T1 and T2 Mapping and Extracellular Volume in Cardiomyopathy
 Pulmonary Vein and Left Atrial Imaging
 Noncardiac Pathology
Stay updated, free articles. Join our Telegram channel

Full access? Get Clinical Tree


