Chapter 5 Cardiac Computed Tomography
The clinical potential of computed tomography (CT) of the heart had always been limited by relatively long acquisition time and poor spatial resolution. The introduction of spiral multidetector CT scanning, and in particular, achievement of isotropic voxel acquisition, has shortened acquisition time, increased spatial and contrast resolution, and resulted in a dramatic expansion of the use of CT for evaluation of patients with acquired and congenital heart disease. Cardiac diagnosis by CT had always been limited to identification of abnormal calcification, or the observation of incidental findings, such as pleural or pericardial effusion. CT diagnosis and the characterization of pericardial, myocardial, and valvular disease, as well as the cause and sequelae of ischemic coronary heart disease, are now not only possible, but are rapidly becoming an imaging modality of choice in certain patient populations and clinical circumstances.
APPROACH TO CARDIAC COMPUTED TOMOGRAPHY
Study Acquisition and Processing
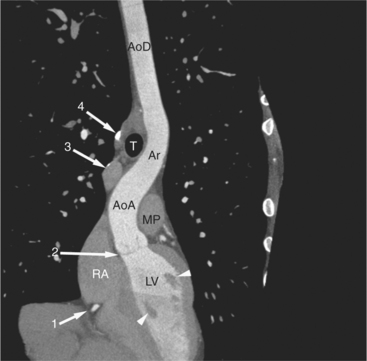
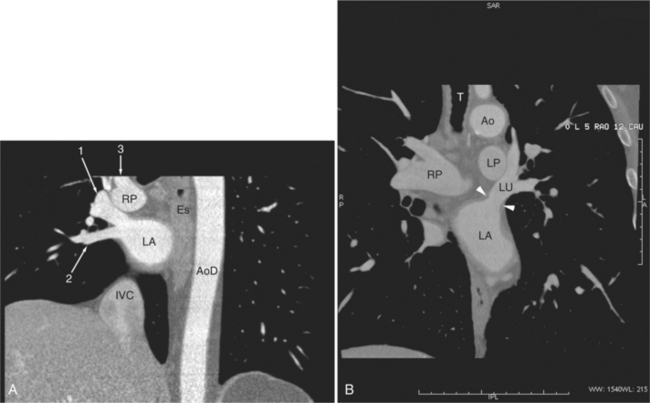
A typical study commences with scout image acquisition to locate the cephalad and caudad limits (Fig. 5-1) of the examination (i.e., from above the aortic arch to the diaphragm if coronary artery bypass grafts are to be evaluated or from about the level of the tracheal carina to the diaphragm for evaluation of the epicardial coronary arteries). From the scout images, typically one identifies the aortic root or origin of the left main artery as the anatomic level for performing a contrast timing run to estimate time to maximum arterial opacification (Fig. 5-2). However, if, for example, the examination is being performed for evaluation of the cardiac veins (for placement of additional ventricular pacing leads, etc.) then timing may be based on maximum opacification of the coronary sinus, the confluence of the epicardial cardiac venous tributaries.
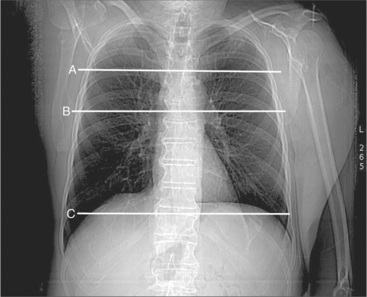
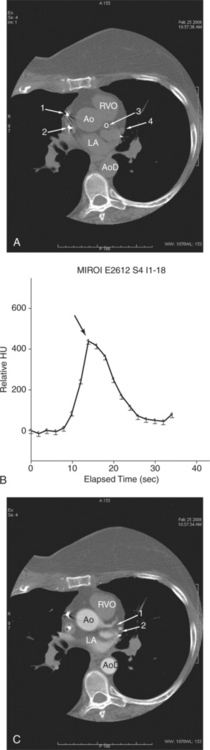
Image Post-Processing
Intravenous contrast administration and radiation exposure are the two significant risk factors associated with performing cardiac CT. Thus, all examinations should be performed using the least intravenous contrast and radiation dose to assure a diagnostic study. The initial image data obtained from the CT scanner is axial images obtained at one particular phase of the cardiac cycle. In fact, using so-called snapshot acquisition, only one phase of the cardiac cycle is used for image acquisition, and thus only single phase data displayed. In principle, all the information in a volume of the chest obtained by CT examination is contained in the axial image data. The traditional approach to CT image interpretation is in the axial (acquisition) plane. However, the heart sits obliquely in the chest, oblique to all body planes (Fig. 5-3). Therefore, cardiac structure may not be visualized to best advantage in this section. Furthermore, many cardiac structures, most notably the epicardial coronary arteries, do not reside within only one isolated plane and are therefore best visualized using more advanced reconstruction methods. Unless obtained only at one phase of the cardiac cycle, image data obtained from a cardiac CT examination covers the entire cardiac cycle and can thus be best viewed not only in arbitrary tomographic section, but also serially in a cine loop mode, allowing qualitative and quantitative analysis of function. Comprehensive review of a case now involves a more integrated approach to the three- and four-dimensional data set (so-called volume visualization). The case is approached as a volume of information, using different means of data manipulation as needed to best view and elucidate a particular clinical problem. Most advanced image processing algorithms have been evaluated in the arterial bed. That is, the advantage of one technique over another for evaluation of the heart and heart disease has been restricted to date to the coronary arteries. Therefore, their value is limited to increasing lesion conspicuity, but not necessarily diagnostic precision. Nevertheless, if use of such techniques increases confidence in the diagnosis of an abnormality, then there exists at least a potential role in clinical cardiac imaging.
Axial and Oblique Tomograms
Axial tomograms are the most basic of CT imagery and are the mainstay of cardiac CT interpretation (Fig. 5-4). Images are viewed in their thinnest reconstruction (i.e., a 64-detector scanner produces isotropic voxels 0.6 mm on an edge, and these slices are 0.6 mm thick. Axial tomograms should be analyzed in an interactive way by scrolling up and down through the slices. An organized approach to cardiac analysis is less likely to produce errors of omission. Therefore, a rigorous approach to image analysis should be adopted. That is, there is no one way to interpret a series of CT images. Rather, by adopting a method and keeping to it, such errors may be avoided. For example, one may scroll back and forth, analyzing one structure at a time, such as the ascending aorta, then the superior vena cava, and then the pulmonary arteries. Alternatively, one may follow the flow of blood through the heart and analyze structures in that order (i.e., the superior and inferior vena cava, followed by the right atrium, followed by the right ventricle and pulmonary arteries, etc.). No one axial slice should be used alone without its neighboring slices for analysis. Furthermore, the robust data set acquired by cardiac CT examination lends itself to the rapid image processing software available on workstations designed for these scanners. Reconstruction of particular structures in oblique tomographic section is frequently helpful for elucidating a perplexing series of images and provides a great deal of information concerning the severity of an abnormality and the effect of a particular abnormality on adjacent cardiac structures. Oblique tomograms may be constructed in arbitrary plane, depending on the problem at hand, or in the so-called standard planes, parallel and orthogonal to the intrinsic cardiac axes (Fig. 5-5). These planes are useful for the assessment of cardiac volumes, ejection fraction, and for comparison of CT findings with imagery obtained by other modalities (namely nuclear cardiology, angiocardiography, and echocardiography).
Maximum Intensity Projections
A maximum intensity projection (MIP) is produced by selecting the highest attenuation voxels along lines projected through the volume data set, that is, the line of sight of the observer (Fig. 5-6). The subset of these high attenuation voxels is used to produce a two-dimensional image. MIP imagery is more accurate for evaluating arteries than is volume rendering. However, the presence of other (nonvascular, namely, calcified) voxels confound the appearance of a structure. Furthermore, MIPs are twodimensional representations (projections) that do not accurately depict the actual three-dimensional relationships of nonadjacent structures.
Mutiplanar (Curved) Reformats
Multiplanar reformats (MPRs) are generally used to “untangle” a complex three-dimensional structure (such as a blood vessel) by displaying a plane constructed by a reference in the object (such as a centerline) in a planar two-dimensional manner. By identifying the x and y coordinates of a point within the object in each of a series of a stack (volume) of axial-acquired data, the “three-dimensional course” of the object can be ascertained. Then, the resultant “curved plane” is mathematically flattened out and displayed as a two-dimensional object (Fig. 5-7). These images are often confusing because of the unusual apparent course of a structure and distribution of adjacent structures.
Three-Dimensional Volume-Rendered Images
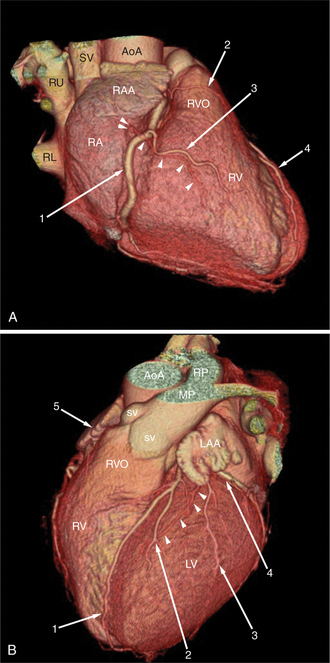
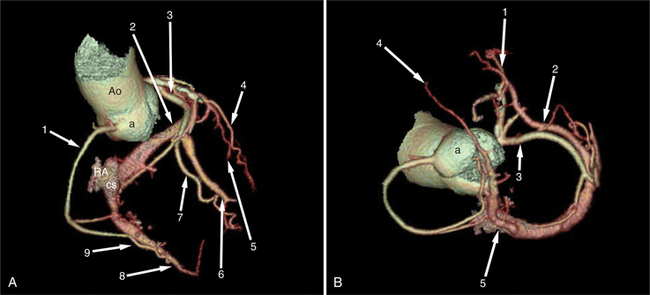
Surface-rendered images are displays of the surfaces of a particular object within a three-dimensional data set. The processing algorithm asks whether a voxel is within an object or not based on comparison of attenuation of the voxel with a “threshold” value. Thus, the outermost voxels of similar attenuation form the surface of the object; those voxels “outside” this surface are not part of the object and not displayed. The “surface” of the object is further modeled as a collection of small polygons and displayed with surface shading based on expected appearance to an observer (Figures 5-3A, 5-8). Reducing the large three-dimensional data set to a surface drastically reduces the amount of data processed per manipulation and thus allows real time interaction between observer and object. These images are excellent for the visualization of gross cardiac structure and the relationship of the heart to surrounding organs.
NORMAL ANATOMY
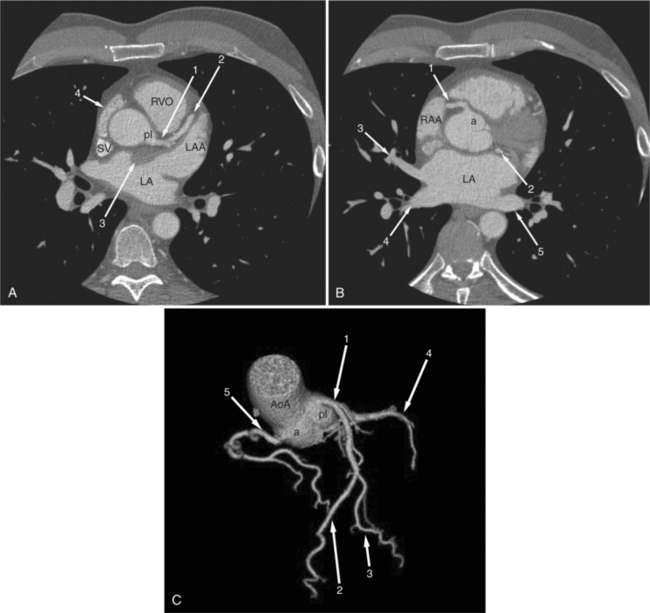
The heart is enveloped in the pericardium. The visceral pericardium cannot be resolved on CT, but with contrast enhancement, the parietal pericardium appears as a thin, bright structure, sandwiched between the pericardial space (and epicardial fat) and the pericardial fat- or air-filled lungs (Fig. 5-9). The pericardium reflects over the top of the main pulmonary artery, the ascending aorta at about the level of the insertion of the azygos vein, and along the diaphragmatic surface of the heart. The pericardial sac contains potential spaces anterior to the aorta (preaortic recess), between the aorta, pulmonary artery and left atrium (superior pericardial recess), and behind the heart, between the insertions of the left and right pulmonary veins (lateral recesses), which become more apparent in face of pericardial effusion or hemorrhage (Fig. 5-10). The coronary arteries are epicardial and are identified as contrast-enhanced cross sections within the epicardial fat, subjacent to the pericardial space, parietal pericardium, and pericardial fat (see Figure 5-9). They arise from the aortic sinuses of Valsalva, immediately cephalad to the aortic annulus (Fig. 5-11).
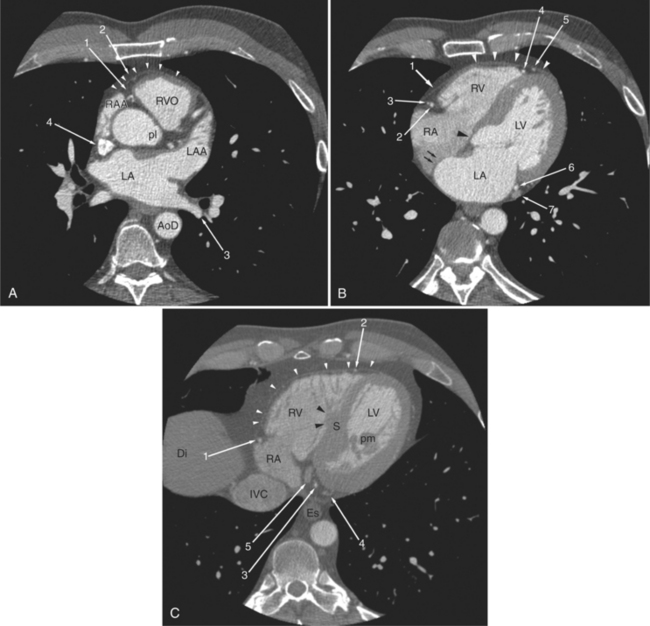
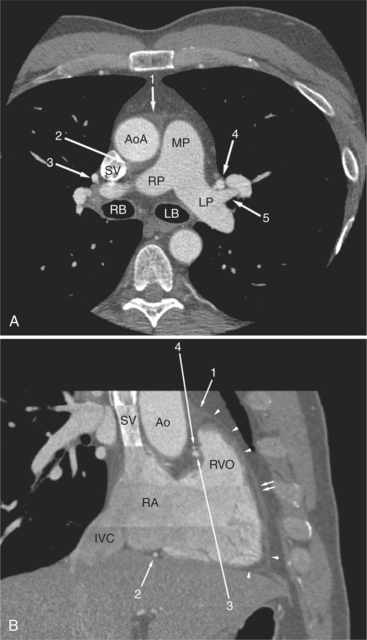
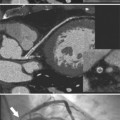
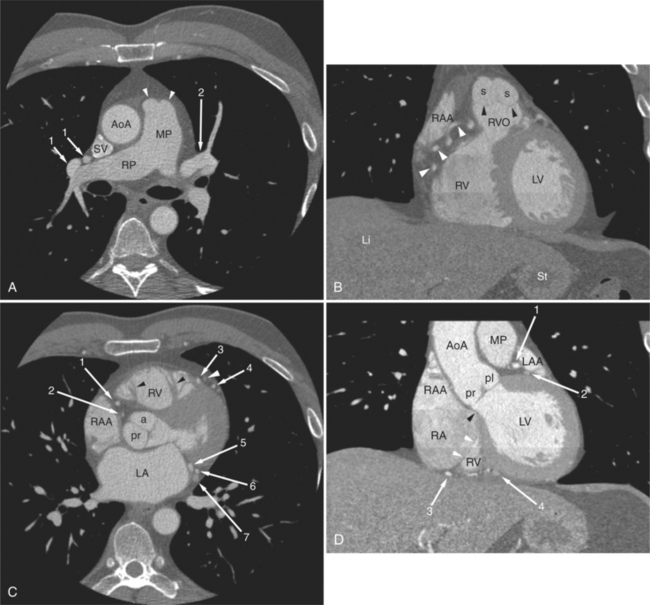
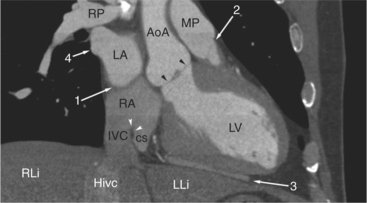
FIGURE 5-10 Images obtained from the patient in Figure 5-9. A, Axial acquisition through the main (MP) and left (LP) pulmonary artery. The preaortic recess is a fluid attenuation collection (arrow 1) between the ascending aorta (AoA) and MP. Similarly, the superior pericardial recess (arrow 2) is the fluid attenuation space between the superior vena cava (SV), AoA, and proximal right pulmonary artery (RP). The right upper lobe pulmonary vein (arrow 3) lies anterior to the prehilar right pulmonary artery, and the left upper lobe pulmonary vein (arrow 4) lies anterior to the left upper lobe pulmonary artery (arrow 5). The left bronchus (LB) and right bronchus (RB) are labeled. B, Right anterior oblique sagittal reconstruction from the patient in Figure 5-9 through the right ventricular outflow (RVO) and the aortic root (Ao). The pericardium (arrowheads) is a thin line separating the epicardial and pericardial fat. A small amount of fluid (double white arrows) has accumulated over the right ventricular sinus, increasing the width of the pericardial space. The preaortic recess (arrow 1) is a homogeneous fluid density bounded by the Ao, the RVO, and the reflection of the pericardium over the pulmonary artery and onto the aorta. The distal right coronary artery (arrow 2) runs in the inferior aspect of the anterior atrioventricular ring. The proximal right coronary artery (arrow 3) and the proximal portion of the conus branch (arrow 4) run embedded in fat in the superior aspect of the anterior atrioventricular ring. The suprahepatic inferior vena cava (IVC) enters the right atrium (RA) from its posterolateral aspect.
The aortic root lies nearly in the geographic center of the heart. In axial section, the normal relationship of the ascending aorta to main pulmonary artery is aorta to the right. The plane of the aortic valve lies inferior and to the right of the pulmonary valve. Thus, when the pulmonary valve and main pulmonary artery are visualized, the ascending aorta is in field to the right. When the aortic root and sinuses of Valsalva are in field, the free wall myocardium of the right ventricular outflow is in view (Fig. 5-12). Measurement of aortic or pulmonary caliber should be expected to be inaccurate on axial CT examination as a result of their oblique course from the heart. Nevertheless, recognition of arterial enlargement is conveniently based on comparison of great artery caliber. The superior vena cava is formed by the confluence of the left and right innominate veins, immediately inferior to the origins of the branches of the aortic arch. The superior cava courses to the right of the ascending aorta and passes anterior to the right pulmonary artery before entering into the right atrium at about the level of the ostium of the right atrial appendage (Figures 5-9A, 5-10A, 5-10B, 5-13). The azygos vein passes over the right hilum to enter the superior cava from behind.
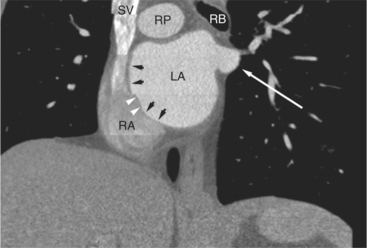
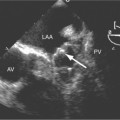
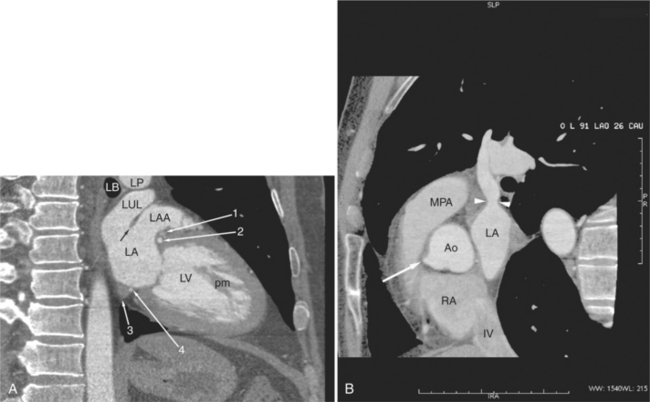
The left atrium is located high and posterior in the heart between the aortic root and the descending aorta and spine, nearly in the midline (see Figures 5-2A, 5-9A, 5-12C). The left atrial wall should be bald smooth and the cavity free of filling defects. The relationship between the left upper lobe pulmonary vein and orifice of the left atrial appendage is constant, and well-demonstrated on CT. The left upper lobe vein passes behind the orifice of the left atrial appendage to enter the posterior aspect of the atrial cavity. A redundant fold of endothelium (the “Q-tip sign”) separates their orifices (Fig. 5-14). The course of the right upper lobe pulmonary vein is nearly constant as well. As it passes medial and inferior from the right pulmonary parenchyma, it passes from anterior-to-posterior to the right pulmonary artery and superior vena cava to enter the superolateral aspect of the left atrium (Figures 5-10A, 5-11B, 5-12A, 5-15). The left lower lobe pulmonary vein often takes a horizontal course, passing between the anterior aspect of the descending aorta and the posterior wall of the left atrium (see Figures 5-5D, 5-9A, 5-11B). The right middle and right lower lobe pulmonary veins frequently form a confluent structure before draining into the left atrium. A common anatomic variant is for the middle lobe veins to drain independently (see Figure 5-15), and slightly superior to the drainage of the right lower lobe vein. Pulmonary vein stenosis, whether of primary or secondary origin, appears as focal narrowing of vessel at an arbitrary location. Juxtaorificial narrowing (see Figures 5-14B, 5-15B) secondary to radiofrequency ablation is, luckily, much less common than in the past.
The left atrium shares the interatrial septum with the inferior, anterior, and right-sided right atrium (the sinus venosus interatrial septum separates the inferior aspect of the superior vena cava from the left atrium; see Figures 5-9B, 5-13). The left atrium forms a posterior border of the heart. The esophagus is intimately related to the posterior wall of the left atrium. The left atrial appendage forms part of the left border of the heart, immediately inferior to the main pulmonary artery (see Figures 5-8B, 5-9A, 5-12D). The right atrium receives the superior vena cava and inferior vena cava. The inferior vena cava enters the inferior aspect of the atrium inferior and lateral to the drainage of the coronary sinus. The two structures share a redundant fold of endothelium, the eustachian valve (Figures 5-9C, 5-16). The coronary sinus is the confluence of the cardiac veins (Fig. 5-17). The anterior interventricular vein runs with the anterior descending artery along the anterior interventricular groove (see Figures 5-6, 5-8B, 5-9B, 5-12C, 5-17) and then passes along the base of the heart to the posterior atrioventricular ring to run with the circumflex coronary artery as the great cardiac vein. This vein receives a lateral ventricular vein from the lateral ventricular wall and then passes beneath the left atrium. It picks up the posterior interventricular vein (which runs with the posterior descending coronary artery) to become the coronary sinus and enter the right atrium. The right atrium is divided by a constant mural filling defect, the crista terminalis (see Figure 5-5A). This remnant of the vein of the sinus venosus divides the right atrium into a trabeculated anterior portion and a smooth walled posterior portion. The hepatic veins usually drain to the suprahepatic inferior vena cava before entering the right atrium (see Figures 5-10B, 5-16), but on occasion, they drain directly to the floor of the right atrium. The two atria share the interatrial septum. The plane of the interatrial septum is oblique to the coronal body plane and bows toward the right atrium (see Figures 5-3C, 5-4, 5-5D, 5-9B, 5-13, 5-16). From superior to inferior, the septum is divided into the lateral sinus venosus portion, the medially located secundum portion, and the inferior and medial primum septum. The primum septum is in fibrous continuity with the anterior mitral leaflet, the membranous and atrioventricular septum, and the septal tricuspid leaflet (see Figures 5-4, 5-12C). The interatrial septum is fat laden and thins in the region of the foramen ovale.
The tricuspid valve lies within the anterior atrioventricular ring with the right coronary artery, protecting the inflow to the right ventricle (see Figure 5-17). The leaflets are usually poorly visualized in less-enhanced right ventricles. The mitral valve lies within the posterior atrioventricular ring, along with the circumflex coronary artery and the great cardiac vein, and protects the inflow to the left ventricle (see Figures 5-5B, D, 5-14, 5-17). The right ventricular inflow lies anterior, inferior, and to the right of the left ventricular inflow. Thus, the left ventricle lies slightly superior and posterior and to the left of the right ventricle (see Figures 5-3A, C, 5-5A, C, 5-8B). The two ventricles share the interventricular septum. The right ventricular side of the septum contains the septomarginal trabeculation and is therefore irregular and trabeculated (see Figures 5-9C, 5-12B). The basal aspect of the trabeculation contributes to the crista supraventricularis and right ventricular infundibulum (see Figures 5-8B, 5-10B, 5-12B). The right ventricle gives papillary muscles from both the septomarginal trabeculation along the interventricular septum and also from the free wall. These myocardial trabeculations appear as filling defects distributed within the right ventricular cavity. The left ventricle gives two large papillary muscles from the posterior (lateral) ventricular wall. Muscle bundles divide into heads and subheads, appearing as branching intracavitary filling defects (see Figures 5-3B, 5-5A, C, D, 5-9C, 5-14). Tricuspid valve chordae are generally not well visualized on CT. However, mitral chordae tendineae are frequently exquisitely visualized. They appear as stringlike filling defects connecting the papillary muscle heads and the mitral leaflets (see Figures 5-5B, D). Because the left ventricle gives no papillary muscles from the interventricular septum, the left ventricular side of the septum appears smoother than the right ventricular side. However, interconnected left ventricular myocardial trabeculations are commonly seen along the lateral wall and toward the ventricular apex.
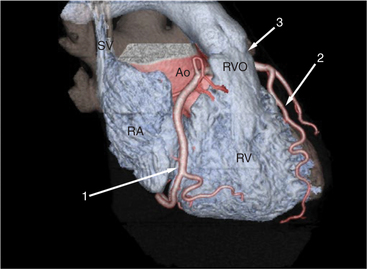
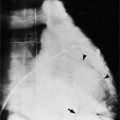
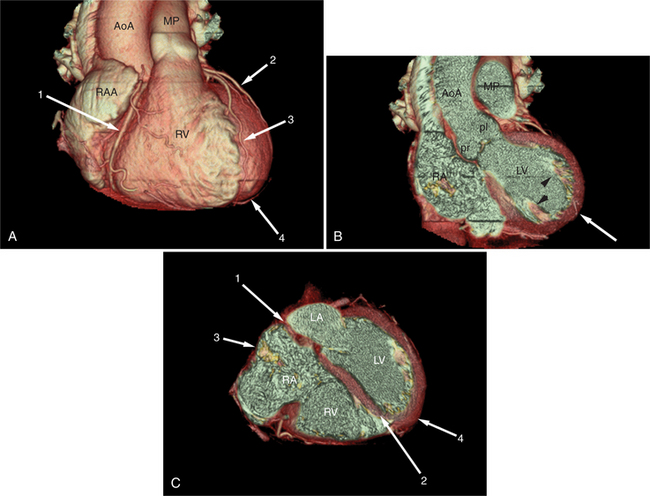
The right ventricle lies in the midline, posterior to the sternum (Figures 5-3A, 5-4, 5-5A, 5-9B, C, 5-12B, C). The right ventricular infundibulum separates the tricuspid and pulmonary valves, and thus the ventricular inflow and outflow. This results in the unique shape of the right ventricle (Fig. 5-18). The right ventricular free wall is only about 2 to 3 mm thick (see Figure 5-9). Low attenuation epicardial fat within the visceral pericardium sharply defines the structure of the outer wall. The contrast-enhanced epicardial coronary arteries appear as round and tubular high attenuation objects. On a contrast-enhanced scan, the right ventricular subendocardial trabeculae appear as scalloped, interconnected filling defects along the internal surface of the free wall. The septomarginal trabeculation is a band of myocardium that runs obliquely along the right ventricular surface of the interventricular septum. As it courses toward the intersection of the interventricular septum and right ventricular free wall, it is associated with small intracavitary filling defects. These represent small papillary muscles of the tricuspid valve. Occasionally, myocardial bundles extend from the interventricular septum clear across to the free wall. The moderator band is a distal branch of the septomarginal trabeculation that carries the right bundle branch to the right ventricular free wall. It is usually seen distally toward the intersection of free wall and septum (see Figure 5-9C).