Conditions Associated With Cardiac Iron Loading
There are several conditions that can potentially lead to cardiac iron loading with cardiac complications. Cardiac iron loading can occur via two distinct mechanisms: first, primary disruption of iron regulation (genetic hemochromatosis syndromes) where excess gastrointestinal absorption is slow and symptoms often present in middle age; and, second, via transfusional iron overload where the iron accumulation rate is much faster and children can develop cardiac iron accumulation within a few years of initiating regular transfusion therapy. Excess iron cannot be naturally excreted in humans because of the lack of such a regulatory excretory pathway.
The most common pathology leading to severe iron accumulation is thalassemia major (TM). This is a genetic condition with severe reduction or absent production of the beta-globin chain constituent of hemoglobin A (HbA). Excess alpha-chains result from ineffective erythropoiesis, and there is a life-threatening anemia by 2 years of age. Not only does this require treatment with regular, lifelong, repeated blood transfusions, but it is compounded by a mild increase in gastrointestinal iron uptake related to hepcidin suppression. TM occurs predominantly where malaria is endemic because heterozygote genetic hemoglobin mutations confer resistance. In other parts of the world it occurs primarily through immigration.
The detail of the hemoglobinopathy plays a role in the pattern and pathology of transfusion-dependent iron loading. For example, in the less severe condition of thalassemia intermedia, pulmonary hypertension and thrombosis play a greater clinical role and iron loading occurs at a later age. In sickle cell disease (SCD), the defining clinical features include sickle cell crises (intermittent attacks of severe pain), pulmonary hypertension, thrombosis, and stroke. Even where SCD patients are transfused to prevent cardiovascular complications, extrahepatic iron deposition is lower compared with other transfusional anemias. Conversely, in Diamond-Blackfan anemia, where the intrinsic bone marrow activity is low, patients are very prone to nonhepatic tissue iron accumulation.
Prevalence of Cardiac Iron Overload and Cardiomyopathy
The introduction of chelation therapy in the 1960s with deferoxamine changed the natural progression of TM patients receiving regular transfusions, where the most common cause of death was heart failure at a very young age. Despite initially promising data and an increased life expectancy with the introduction of deferoxamine, cardiac iron overload continued to dominate, accounting for 70% of deaths. However, as shown in a UK cohort, by the year 2000 the median age at death was 35 years because by this time patients had been exposed to regular chelation therapy from a young age. Improving survival with deferoxamine by later birth cohort has been confirmed in other countries. In the current millennium, data using T2* from TM patients across the world show that cardiac iron overload continues to be common, using definitions from T2* cardiovascular magnetic resonance (CMR) of severe cardiac iron loading of <10 ms, and mild-to-moderate cardiac iron loading of 10 to 20 ms ( Table 33.1 ). The prevalence of cardiomyopathy is more difficult to measure. It can be estimated from either the prevalence of clinical heart failure or the presence of detectable left ventricular (LV) dysfunction, with the latter being higher in any given population. Prevalence generally increases with age and decreases with a more recent year of birth. For example, in a cohort of patients born before 1976, 37% had heart disease as defined by need for inotropic or antiarrhythmic medications, but in a survey in 2004 the number of TM patients of all ages receiving cardiac medication was only 10%.
| Country | Sample Size | Severe | Mild-to-Moderate | Normal |
|---|---|---|---|---|
| T2* <10 ms | T2* 10–20 ms | T2* >20 ms | ||
| United Kingdom | 109 | 20% | 43% | 37% |
| Hong Kong | 180 | 26% | 24% | 50% |
| Turkey | 28 | 46% | 39% | 14% |
| Australia | 30 | 37% | 27% | 37% |
| Oman | 81 | 24% | 22% | 54% |
| United States of America | 141 | 13% | 21% | 66% |
| Italy | 167 | 13% (<8 ms) | 52% (8–20 ms) | 35% |
| Italy | 220 | 30% <20 ms | 66% | |
| Greece | 159 | 68% <20 ms | 32% | |
| Worldwide survey | 3445 | 20% | 22% | 58% |
| Egypt | 89 | 25% <20 ms | 75% | |
| Pakistan | 83 | 47% | 16% | 37% |
| Indonesia | 162 | 5% | 10% | 85% |
Mechanisms of Cardiac Iron Entry and Toxicity
The mechanism of human cardiac iron loading is incompletely understood. In vitro and animal studies suggest cardiac entry of iron is mediated by calcium channels, and indeed nifedipine hinders iron uptake into cardiac cells. Accumulation of myocardial iron eventually leads to increased levels of intracellular free iron. The toxicity of free iron is mediated via several mechanisms ( Fig. 33.1 ) : (1) membrane damage caused by lipid peroxidation; (2) mitochondrial damage and perturbation of the respiratory enzyme chain ; (3) altered electrical function, including ryanodine release channel interference ; (4) cardiac fibrosis, which was reported as prominent in early autopsy studies ; and (5) changes in gene expression. Iron that is safely stored in ferritin or hemosiderin is nontoxic, yielding hearts with low T2* and normal function. However, high iron stores predispose patients to development of cardiac dysfunction in the future. The result is that the natural history and clinical course in untreated patients is one of a long asymptomatic phase of progressive myocardial iron accumulation with sudden onset of either malignant arrhythmias or acutely impaired myocardial function in early adulthood. There was a significant mortality once symptomatic, and 5-year survival for patients presenting in heart failure was only 48%. One factor behind this is that although evidence suggested that intensive iron chelation therapy could completely restore cardiac function in most patients with asymptomatic cardiac dysfunction and even some clinical heart failure, there was a risk of relapse caused by a lag between the clearance of cardiac iron and improvements in systolic function. Even in asymptomatic patients, treatment of severe cardiac siderosis by aggressive chelation therapy is associated with improvements in ventricular function. Improved life expectancy for TM patients in the United Kingdom has resulted from the increasing availability of T2* CMR and earlier escalation of therapy. Even with modern-day chelation regimens, it is important to avoid stage IV heart failure in thalassemia as in-hospital mortality remains in excess of 50%.

Of significant clinical interest is that cardiac iron loading is commonly associated with endocrinologic complications including hypothyroidism, diabetes, hypoadrenalism, growth hormone deficiency, and hypoparathyroidism. This suggests a common or similar iron uptake mechanism. In untreated cardiac iron accumulation, historical series also showed more cardiac complications, such as pericarditis and myocarditis, that occurred in addition to heart failure and arrhythmias. Chelation seems to have has altered this, with myocarditis and pericarditis now being unusual. Chelation has also led to a significant reduction in the historical occurrence of dense replacement fibrosis of myocytes, even in those who die from heart failure, although occasional small patches of fibrosis may be present. In the modern era of chelation therapy, dilated cardiomyopathy (with restrictive features) and arrhythmia (predominantly atrial fibrillation) persist. Ventricular arrhythmias are more common in severe cardiac iron loading. Iron deposition throughout the myocardium in TM patients is nonuniform, being preferentially deposited in the subepicardium, but no systematic variation occurs between myocardial regions such that iron deposition in the interventricular septum is highly representative of total cardiac iron. There are other cardiac changes such as decreased left atrial (LA) function, impaired right ventricular (RV) function, impaired diastolic function, and impaired endothelial function.
Assessment of the Heart in Thalassemia Major
New-onset electrocardiogram (ECG) abnormalities are usually evident in TM patients with heart failure and may include supraventricular arrhythmias, ECG findings suggesting right heart involvement, new-onset T-wave inversion, and small QRS complexes. In patients without heart failure, an abnormal ECG was found in 46%. It is not known if progressive alterations in ECG tracings occur before heart failure develops, casting doubt over the use of serial ECG monitoring to assess disease progress. A chest x-ray may show cardiomegaly, signs of congestive heart failure, and, on occasion, extramedullary hematopoiesis. B-type natriuretic peptide is significantly increased in documented LV diastolic dysfunction, which may be helpful. Exercise stress testing may be able to unmask subclinical LV dysfunction in TM, but results are influenced by many other factors, and it seems to have questionable value.
Before the development of CMR-derived T2*, cardiac function was the key marker of disease progression despite a number of factors limiting its use. The limitations and reproducibility of echocardiography around operator experience and acoustic windows are well documented but should be tempered against the widespread, safe, economical, and routinely available nature of this test. Before the advent of three-dimensional (3D) techniques, the need to make geometric assumptions for the quantification of volumes and mass, which often break down in abnormal remodeled ventricles, led to significant interobserver variability. Despite this, impaired resting LV function by echocardiography correlated with increased cardiac mortality over 12 years. Echocardiography provides less accurate quantification than CMR, and accuracy decreases with worsening LV function as geometric assumptions become an ever-greater approximation. Echocardiography is the preferred second-line technique after CMR. It is important that echo is done in experienced centers used to scanning large numbers of TM patients.
Although radionuclide ventriculography during exercise can detect preclinical myocardial dysfunction in patients with iron overload, concerns over radiation dose in young people, considerable intercenter variation, and the availability of other techniques have limited the use of this technique. Similarly, cardiac computed tomography (CT) can assess cardiac function, and to some extent liver iron concentration, but use of this technique is also limited because of concerns over repeated ionizing radiation exposure.
CMR is noninvasive, reliable, and free of ionizing radiation. Although increasingly seen as a mainstream cardiology investigation, the widespread use of CMR is limited by the cost and claustrophobia, although the latter is less of an issue with new-generation wide-bore scanners. The limitation with implanted cardiac devices is progressively being overcome. For the assessment of LV and RV function, the lack of geometric assumptions optimizes accuracy and reproducibility. Indeed, CMR is widely accepted as the gold standard for all biventricular measurements and indices. Routine use of steady-state free precession (SSFP)-based acquisitions for cine imaging with end-expiratory breath-hold are acquired in the four-chamber and two-chamber long-axis views along with contiguous short-axis cines from the atrioventricular ring to the apex. The optimal end-diastolic volume (EDV) and end-systolic volume (ESV) are derived from LV volume/time curves generated from all frames of all cines and should include systolic valve tracking to adjust for systolic valve descent. LV mass should be calculated using the epicardial and endocardial borders of the LV in the end-diastolic frame. Papillary muscles should be included in the LV mass and excluded from the LV volumes. This method of volumetric assessment then has the benefit of having recognized normalized values for gender, body surface area, and age for both the LV, and the RV. These covariates have substantial impact on the normal ranges. Even where this stringent analysis method is not possible, CMR is more reproducible than other techniques, particularly where patients can be followed over time to allow longitudinal analysis of data.
Consequent to the low hemoglobin from anemia, an adaptive response leads to increased cardiac output, usually through an increase in EDV, stroke volume, and heart rate. TM therefore represents a chronic, high-output state produced by volume-loaded ventricles (high preload) with the ejection fraction increased caused by a decreased afterload and an increased preload. Because of this state, the appropriate normal ranges to use are those derived from nonanemic TM patients because for both the LV and the RV there are differences compared with standard normal cohorts. Pediatric normal ranges are also available. The hyperdynamic circulation also leads to an increased LV mass. The same pattern is true for the RV indices, but the differences are not as marked. Using these adjusted “normal for TM” ranges may enhance diagnostic accuracy for detection of cardiomyopathy.
Whereas CMR offers several other techniques such as late gadolinium enhancement for the detection of myocardial fibrosis and myocarditis, and myocardial perfusion imaging for coronary artery disease, these are uncommon findings in this group of patients and routine cardiac assessment with these techniques is not advocated. Although possible, diastolic function using CMR is time consuming and more operator dependent and in clinical practice is more readily assessed using echocardiography.
Cardiovascular Magnetic Resonance of Cardiac Iron Using T2*
In simple terms, radiofrequency (RF) pulses cause spinning protons to be deflected from their equilibrium state. Immediately after this RF pulse, protons begin to return to equilibrium by two separate processes: namely, T1 recovery and T2 relaxation. Magnetic field inhomogeneity accelerates these processes whereby the protons return to equilibrium. As myocardial stores increase in the heart, ferritin breakdown increases into particulate hemosiderin, which is a form of ferrihydrite (hydrated iron oxide). The hemosiderin to ferritin ratio is significantly higher in cardiac siderosis than in normal hearts. It is this particulate intracellular iron that markedly increases magnetic field inhomogeneity and thereby accelerates both T1 and T2 relaxation. Because the influence on these parameters as a result of particulate iron is much greater than normal field inhomogeneity, changes in these parameters become a biomarker for myocardial iron deposition. Magnetic resonance (MR) relaxometry is the use of specific MR sequences that repeatedly sample image data every few milliseconds from which relaxation or recovery curves can be derived. These techniques do not require contrast media.
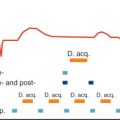
Given that it is increased field inhomogeneity which is affected by increased iron deposition, it follows that the sequence most sensitive to this parameter should be chosen. Gradient echo sequences are much more susceptible to field inhomogeneity than spin echo sequences and are particularly affected by particles of hemosiderin iron. Gradient echo sequences measure T2*, whereas spin echo sequences measure T1 and T2. In addition, a T2* multiecho gradient echo can repeatedly sample image data at different echo times (TE) in a single 10-second to 15-second breath-hold from which T2* can be derived, and such sequences are T1 independent ( Fig. 33.2 ). A gating delay of 0 ms after the R-wave ensures all images are obtained at the same point in the cardiac cycle and removes any variability caused by changing heart rates. Such sequences are well validated, initially with “bright-blood” images and then subsequently with “black-blood” images, further refining reproducibility and reducing artifacts. T2* and T2 are related by the formula 1/T2* = 1/T2 + 1/T2′, where T2′ represents magnetic inhomogeneity. There is no particular advantage to a multislice method, which has been reported, because iron concentration in the septum is representative of mean total iron concentration.

The method of calculation of T2* values from raw datasets may be prone to error if care is not taken. Susceptibility artifacts at tissue borders, such as the lung myocardial interface and near the great cardiac veins in the anterior and posterior interventricular grooves, need to be minimized. For this reason, for routine analysis of T2*, a full-thickness region of interest (ROI) in the interventricular septum should be chosen to measure mean signal intensity for each echo time, thereby avoiding the above areas. Care is needed to ensure that the blood-pool signal and other artifacts are excluded from the ROI, which can be easier with a black-blood image. Signal intensity is plotted against TE, and a monoexponential decay curve is fitted to derive T2*, which represents the time taken for the signal intensity to decay to 37% of its initial value ( Fig. 33.3 ). The signal intensity (SI) at each echo time is given by the following equation (where SI 0 represents the signal intensity at time zero and TE represents the echo time):
Signal intensity(SI)=SI0⋅e−TE/T2*


In severe myocardial iron loading, the myocardial signal obtained from the images with longer echo times becomes predominantly background noise, motion, and blood-pool artifacts. Because the true decay at these low signal values is masked by these effects, this will affect T2* calculations and may lead to spuriously high values. The simplest way to deal with these points at long TE, which are in effect just noise, is to delete them from the analysis and curve fitting, which is known as truncation ( Fig. 33.4 ). To ensure the most robust analysis, dedicated and validated analysis software is preferable.

T2* is highly robust and has a high interobserver and intraobserver reproducibility as well as high reproducibility between different studies performed a few hours or days apart and across different sites and scanner platforms. Critically this means that T2* measurements at 1.5 T are independent of the scanner, site, or country where they were obtained. Although it is also possible to derive T2* using a 3 T scanner, clinical experience is much more limited in TM, and there are potentially more artifacts. Current recommendations are that that clinical T2* MR is performed at 1.5 T. Finally, in very simple terms, increasing cardiac iron will lead to a decrease in the measured cardiac T2* value.
Although T2* has become the established technique for the assessment of myocardial iron loading, previous work used the ratio of signal intensity between the myocardium and skeletal muscle on a T2-weighted spin echo image. Because T2-weighted images are less susceptible to field inhomogeneity (indeed part of the refocusing of the RF pulse in a spin echo image is designed to mitigate effects attributed to field inhomogeneity), small changes in imaging parameters had a significant effect on results, and reproducibility was poor. It is, however, possible to construct multiecho spin echo sequences from which T2 can be derived in a similar way to T2*. Although T2 does shorten with increasing myocardial iron load, T2 assessment has not been validated to the same extent as T2*, and is not routinely used.
Similarly, T1 can be used to assess myocardial iron. T1 is measured using an inversion-recovery sequence with T1 representing the time taken for the magnetization to recover to 63% of its equilibrium value following an 180-degree RF pulse and a series of inversion-recovery images can be acquired with a range of inversion times. As with T2* multiecho, a modified Look-Locker inversion (MOLLI) sequence can produce a map of T1 values for the heart in a single breath-hold. T1 mapping techniques are increasingly being used for clinical assessment in a range of pathologies such as cardiac amyloidosis. For cardiac iron assessment, T1 does not yet provide any additional clinical value to T2*. T1 yields improved reproducibility at normal levels of myocardial iron loading, but this has no current clinical value in TM. Low native (noncontrast) T1 values are seen in two conditions affecting the heart: namely, myocardial siderosis and Anderson-Fabry disease. The normal range for T1 in noniron loaded hearts is approximately 800 to 1000 ms, but is variable and can require different centers to perform T1 mapping on normal subjects to establish local “normal” values, which is a significant limitation when compared with T2* techniques.
T2*, Prediction of Heart Failure, and Prognosis
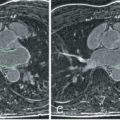
Serum ferritin measurements are simple to undertake and are widely available. Although trends in ferritin are useful in monitoring the direction of body iron loading, they do not fully predict cardiac iron loading and, critically, a low ferritin measurement does not predict the future absence of heart failure. In particular, a single ferritin measurement can be misleading and does not reflect cardiac iron burden. There is a similar problem with liver iron, where single liver iron measurements in patients on long-term iron chelation may be misleading because they do not correlate with cardiac iron levels. Over time, poor liver iron control probably increases the risk of cardiac iron loading. Similarly, noncompliance with chelation therapy leading to elevated serum ferritin levels (and thereby elevated liver iron) is a major predictive factor for cardiac iron loading in patients. Therefore high liver iron levels per se may not be the best way to view the cardiac risk associated with liver iron loading, and although control of liver iron over time is likely to be important in prevention of cardiac iron accumulation, a low liver iron does not guarantee absence of cardiac iron loading. Early on in the development of myocardial T2* the differential organ iron loading became apparent and disparate loading between the liver and heart was revealed as the reason for the limitations of these biomarkers ( Fig. 33.5 ).


An increased risk of clinical heart failure has been demonstrated for patients with a falling left ventricular ejection fraction (LVEF) or absolute values below the lower limit of the normal range. Limitations of the use of LVEF are that it requires meticulous attention to detail, but more importantly, changes in LVEF are a late event compared with falling T2* levels <20 ms and with low-to-moderate levels of cardiac iron, the change in LVEF is modest if at all present. Although absolute LVEF measurements vary between centers, volumetric analysis by CMR is superior to echocardiography. There is a tipping point at which a marked deterioration in LVEF will occur with only a slight additional increase in cardiac iron loading. Because it is free iron that is toxic (but T2* measures storage iron in the form of hemosiderin) with intensive chelation treatment the LVEF will improve rapidly. However, the storage iron loading of the heart will only have decreased marginally in this time period. Prolonged periods of chelation are therefore required to remove all the stored iron in the heart. Although most focus has been on deteriorating LV function, myocardial iron deposition is also strongly associated with RV dysfunction.
Cardiac T2* has been directly calibrated to human cardiac iron concentration ( Fig. 33.6 ). The practical and commonly used lower limit of normal is 20 ms, although it is not appropriate to consider cardiac iron as a dichotomous variable. Historical data suggest the upper limit of normal for cardiac iron is approximately 0.5 mg/g dry weight. The probability of a reduced EF increases as cardiac iron increases, and a cardiac T2* <10 ms predicts heart failure. In one study, 98% of patients who developed heart failure had a myocardial T2* <10 ms and patients with a cardiac T2* <6 ms had a 50% likelihood of development of heart failure within 12 months ( Fig. 33.7 ). A normal cardiac T2* has a very high negative predictive value for exclusion of heart failure for at least 12 months. T2* is the most significant predictor of the development of heart failure compared with liver iron or serum ferritin.

Related posts:
 Use of Navigator Echoes in Cardiovascular Magnetic Resonance and Factors Affecting Their Implementation
 Clinical Cardiovascular Magnetic Resonance Imaging Techniques
 Atherosclerotic Plaque Imaging: Aorta and Carotid
 T1 and T2 Mapping and Extracellular Volume in Cardiomyopathy
 Pulmonary Vein and Left Atrial Imaging
 Noncardiac Pathology
Stay updated, free articles. Join our Telegram channel

Full access? Get Clinical Tree


