Chapter 3 Cardiac Magnetic Resonance Imaging
INTRODUCTION
Cardiac magnetic resonance imaging (CMRI) provides reproducible morphologic and functional information for the evaluation and management of patients with cardiovascular disease. CMRI has improved substantially over the past decade, and it is now entering the mainstream of diagnostic cardiac imaging. CMRI is already considered the procedure of choice for quantification of ventricular volume and mass, as well as in the evaluation of myocardial viability, pericardial disease, and intracardiac and pericardiac masses, for imaging the right ventricle and pulmonary vessels, and for assessing many forms of congenital heart disease, especially after corrective surgery.
The use of CMRI imaging lies in the adaptation of motion suppression techniques to cancel out complex cardiac contractile motion. Thus, the most important difference between cardiac and other-organ magnetic resonance imaging (MRI) is the application of electrocardiogram (ECG) gating to the acquisition pulse sequences. ECG gating acts by applying a timing signal coincident with cardiac motion to image acquisition. That is, by timing each phase encoding step in a magnetic resonance (MR) acquisition to a particular point in the electrocardiographic cycle of the heart, reconstructed images are temporally coherent.
MAGNETIC RESONANCE IMAGING TECHNIQUES
Spin Echo Magnetic Resonance Imaging
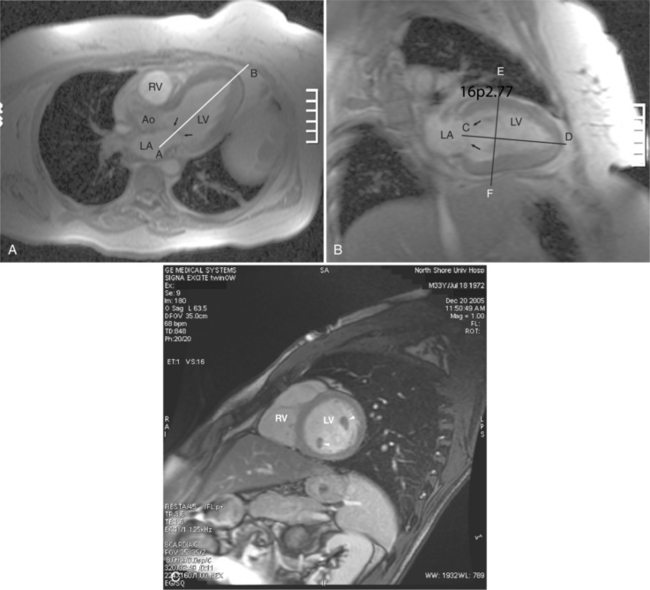
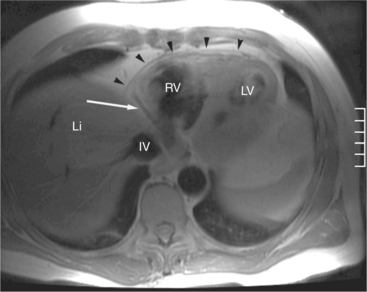
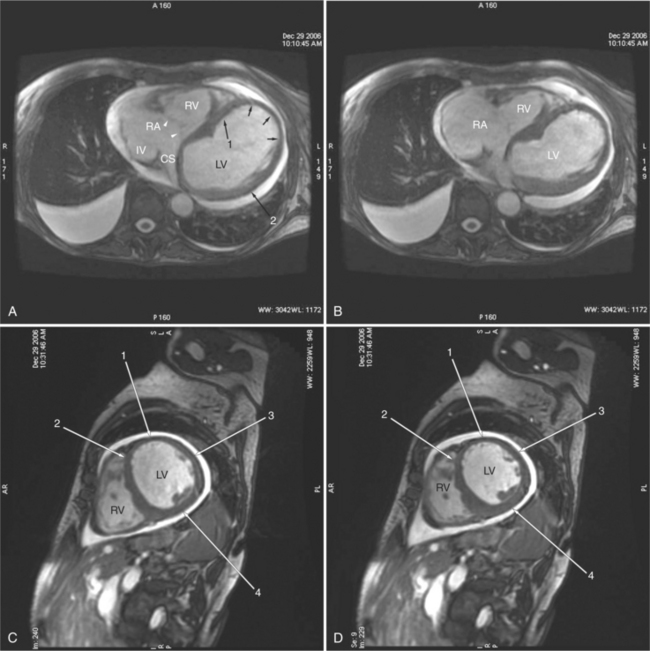
ECG gated spin echo (SE) MRI provides imaging with the highest contrast resolution, resulting in high anatomic detail (Fig. 3-1). Furthermore, characterization of wall thickness and content of the arterial wall provides tissue-specific findings encouraging early diagnosis. Adaptation of k-space segmentation to the acquisition of image data allows rapid image acquisition within single breath holds. These techniques (namely, turbo SE and double inversion recovery) are actually modified gradient echo pulse sequences and provide the same high contrast imagery of conventional SE in dramatically less imaging time.


FIGURE 3-1 Double inversion recovery acquisition images. Images A through F in axial section. A, Image obtained through the right ventricular outflow tract (RVO) and the confluence of the main (MP) and proximal right (RP) pulmonary artery. At this level, the RP is viewed passing posterior to the ascending aorta (AoA) and superior vena cava (SV) to enter the right hilum. The trabeculated right atrial appendage (arrow 1) and the tip of the left atrial appendage (arrow 2) lie along the right and left heart borders, respectively. Caudad to the tracheal carina, the right bronchus (arrow 3) lies posterior to the RP, and the left bronchus (arrow 4) lies medial and anterior to the descending left pulmonary artery (LP) and anterior to the descending aorta (AoD). Immediately posterior to the right bronchus, the azygos vein (arrow 5) is viewed in cross section. The left upper lobe pulmonary vein (arrow 6) is seen entering the left atrium posterior to the left atrial appendage. B, Section through the posterior left aortic sinus of Valsalva (pl), left main (arrow 1) and proximal anterior descending (arrow 2) coronary arteries. The trabeculated right atrial appendage (arrow 3) lies immediately anterior to the SV. The right upper lobe pulmonary vein (arrow 4) is seen anterior to the right pulmonary artery (arrow 5) between the right upper lobe pulmonary artery (arrow 6) and the SV. The right bronchus (arrow 7) is viewed posterior to the right pulmonary artery. The left upper lobe pulmonary vein (arrow 8) is viewed just posterior to the left atrial appendage (arrow 9) and anterior to the left pulmonary artery (arrow 10). C, At this level, the origin of the right coronary artery from the right, or anterior (a), sinus is shown. The proximal right coronary artery (arrow 1) is embedded in the fat of the anterior atrioventricular ring. A portion of the anterior descending artery (arrow 2) and the anterior interventricular vein (arrow 3) are seen passing within the epicardial fat along the anterior left ventricular wall. The signal of the right ventricular (RV) free wall (arrowheads) volume averages myocardium and epicardial fat. The right upper lobe (arrow 4) and left lower lobe (arrow 5) pulmonary veins enter the left atrium (LA) in this section. At this level in the heart, the sinus venosus atrial septum (arrow 6) is seen separating the SV and LA. D, The anterior mitral leaflet (arrow 1) and atrioventrioventricular septum (arrow 2) are confluent. The muscular interventricular septum (arrow 3) separates the RV from the left ventricle (LV) and is of homogeneous signal. A muscular trabeculation (arrow 4) extends from the interventricular septum to the RV free wall. The right lower lobe pulmonary vein (arrow 5) is seen draining into the LA at the level of the primum interatrial septum (arrow 6). Embedded within the fat of the posterior atrioventricular ring, the great cardiac vein (arrow 7) and circumflex coronary artery (arrow 8) are viewed in cross section. E, Coronary sinus (arrow 1) drainage into the right atrium (RA) is segregated from flow from the inferior vena cava (IV) by the eustachian valve (arrow 2). Note the trabeculation of the RV free wall and the relative smoothness of the LV endocardium. The right coronary artery (arrow 3) is viewed in cross section within the anterior atrioventricular ring. F, The distal right coronary artery (arrow 1) is seen passing within the inferior aspect of the anterior atrioventricular ring. The suprahepatic IV is separated from the heart. Notice the marked trabeculation of the RV as compared to the LV. Images G through K in right anterior oblique sagittal section. G, The RA and right atrial appendage (arrow) are separated from the cavity of the RV by the fat of the anterior atrioventricular ring. H, Immediately to the left, the SV enters into the RA. The tricuspid valve (arrow 1) separates the RA from the inflow portion of the RV. The right coronary artery (arrow 2), viewed in cross section, is embedded in the fat of the anterior atrioventricular ring. The RVO is superior to the sinus portion and lies anterior and to the left of the AoA. I, Just to the left, the relationship of the RA cavity, the aortic root (Ao), and the right ventricular outflow and proximal pulmonary artery (PA) is displayed. The infundibular septum (IS) lies between the RVO and Ao. Notice the reflection of the pericardium (arrowheads) over the top of the PA. J, On the other side of the interventricular septum, the outflow portion of the LV is seen immediately inferior to the Ao. The LA lies high and posterior to the Ao, beneath the transverse portion of the RP. The left-sided aortic arch (AA) and left subclavian artery (arrow 1) lie to the left of the trachea (T). A small portion of the RA is seen inferior to the LA and posterior to the fat of the anterior atrioventricular ring (arrow 2). K, The LA is seen behind the cavity of the LV and anterior to the soft tissue of the collapsed esophagus (E). The coronary sinus (arrow) passes beneath the LA, to the right of the fat of the posterior atrioventricular groove. The AA and main PA are of nearly equal caliber.
Multi-Echo Spin Echo Imaging
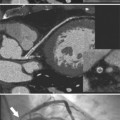
In an SE acquisition, a rephasing pulse is applied at a time interval after the spins have dispersed, resulting in an SE. If these spins are allowed to diphase again, their signal decreases, and if a second rephrasing pulse is applied, a second SE is obtained, of signal exponentially less than the first. If this process is continued, using a chain of rephrasing pulses, a series of sequentially exponentially decreased signal SEs are obtained. The loss of signal over time is directly related to the transverse relaxation time (T2) of a particular tissue. Thus, imagery obtained with each successive SE will display a map of signal intensities reflecting the T2s of the tissues in the imaging field (Fig. 3-2). The more or less rapid loss of signal in a particular region or tissue can then be used to characterize that tissue (i.e., tissues that lose signal rapidly over the chain of echoes have shorter T2 than those that lose signal less rapidly). This technique may be useful for differentiating cystic from solid masses or for enhancing the appearance of interstitial tissue involvement in a disease process.

FIGURE 3-2 Intrapericardial mass (M) on the roof of the left atrium (LA), causing extrinsic compression of the LA from above and elevation of the right pulmonary artery (RP) from below. A, TR 1060; TE 20 msec. The bright signal of the mass appears slightly greater than the liver (Li), but less than pericardial fat (F). B, TR (repetition time) 1060; TE (echo time) 60 msec. The more rapid loss of signal of both Li and F than the M since the first echo indicates the prolonged T2 of the mass (i.e., it is fluid filled). This is an intrapericardial pericardial cyst.
Gradient Echo Magnetic Resonance Imaging
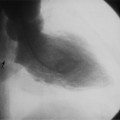
Gradient echo (GE) cine imaging allows a short acquisition time. The bright signal of the blood pool in these images results from flow-related enhancement obtained by applying intermittent rapid radiofrequency pulses to saturate a volume of tissue. The images may be reconstructed in the different phases of the cardiac cycle and can be displayed in cine format (Fig. 3-3). Consistent imaging artifacts caused by flow accelerating across a luminal stenosis or turbulence within a dilated chamber may be used to identify these conditions and to assess their significance (Fig. 3-4). Cine loop display demonstrates dynamic changes in the morphology of the heart, providing a means for evaluating regional wall motion, ventricular function, and valvular dysfunction. GE images may be analyzed quantitatively, providing accurate indices of ventricular function and valvular dysfunction.

FIGURE 3-3 Gradient echo short-axis acquisitions from two normal subjects. A, Image obtained at midventricular level at end diastole. The two left ventricular papillary muscles (1 arrows) appear as filling defects in the high signal left ventricular cavity (LV). Notice how the interventricular septum bows toward the right ventricle (RV). Also note that the RV side of the septum is more trabeculated than the LV side. The RV free wall can barely be seen. B, Image obtained at the same anatomic level at end systole. The papillary muscles and ventricular myocardium is thickened, and the cavitary area is diminished. The right ventricular walls are now visible. C, Image obtained through the aortic valve at end diastole. The anterior (a), posterior left (pl), and noncoronary (n) sinuses are labeled. The left upper lobe pulmonary vein (arrow 1) is seen passing anterior to the descending thoracic aorta (AoD) to enter the left atrium immediately posterior to the orifice of the left atrial appendage (arrow 2). The filling defect of the tricuspid valve (arrowheads) separates the cavities of the right atrium (RA) and RV. Note the relationship between the interatrial septum (arrow 3) and the noncoronary aortic sinus of Valsalva. D, Image obtained at the same anatomic level at end systole. The aortic valve is open.

FIGURE 3-4 Gradient echo acquisitions from two patients with valvular heart disease. A, Diastolic left anterior oblique sagittal acquisition from a patient with valvular pulmonic stenosis. The left atrium (LA) and left ventricle (LV) are separated by the anterior mitral leaflet (arrow). The LV and right ventricle (RV) are separated by the interventricular septum. Note the hypertrophied RV myocardium and the marked dilatation of the main pulmonary artery (MP). B, Image obtained at the same anatomic level at end systole. The ventricular myocardium has thickened and their respective cavities are smaller. Note the signal void jet (arrow) of accelerating flow across the stenotic pulmonary valve. C, Short-axis acquisition obtained in early diastole in a patient with aortic regurgitation. The signal void jet extends from the aortic annulus (arrow 1) into the cavity of the LV. The smaller signal void just inferior to the origin of the jet (arrow 2) is a fleck of calcium.
Phase Contrast (Blood Flow) Mapping
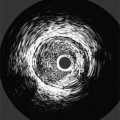
When a pulse sequence is applied to a patient in an MRI scanner, two sets of data are obtained. The “real” (amplitude) data contains the map of protons within the slice, that is, the “stuff” of a cross-sectional image. The other set of data obtained is the “imaginary” (phase) data. This latter data provides a map of the net velocity of the protons within the slice. The intensity of a pixel in an imaginary image reflects the velocity and phase of the protons within that pixel. Following the intensity of a region of pixels in a series of images provides us with time-intensity curves reflecting the flow of blood through a portion of the heart in a manner analogous to the peak velocity measured by continuous wave Doppler echocardiography. This technique uses modified GE sequences with image reconstruction from the phase rather than the amplitude of the MR signal. On phase images, the gray value of a pixel depends on velocity and direction with respect to the imaging plane (Fig. 3-5). Thus, the flow mapping technique allows determination of the peak velocity of blood flow within a stenosed blood vessel or total flow through a vessel over time. Flow velocity, flow volume, and mean blood flow may be quantitated within areas of interest.

FIGURE 3-5 Systolic phase contrast acquisition from a 12-year-old boy with a conduit repair of pulmonary atresia. A, Modulus (“real”) image. The conduit is seen as a bright round signal (arrow) adjacent to the defect caused by a sternal suture. B, Phase (“imaginary”) image obtained at the same anatomic plane. Only flowing blood in the conduit (arrow 1), the pulmonary artery (arrow 2), and the descending aorta (arrow 3) displays a signal.
Myocardial Tagging
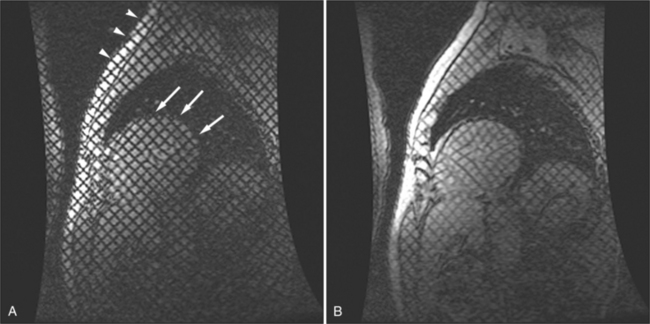
By applying saturation planes perpendicular to the imaging plane at the electrocardiographic trigger signal before image acquisition, tagging sequences create noninvasive markers within the heart wall. During image acquisition, reduced signal is obtained from the presaturated tissue, resulting in images formed with orthogonal or radial black lines on the images (depending on the method of tagging). Because the tag lines are a property of the tissue (i.e., the slice of the heart), the lines move with the myocardium through the cardiac cycle. When created at end diastole, the lines deform as the myocardium contracts and then become undeformed as the myocardium relaxes. Tracking the motion of the tag lines through the cardiac cycle allows visual evaluation of intramural myocardial deformation (Fig. 3-6). In this way intramyocardial motion can be evaluated. Application of sharp, closely spaced tag lines allows qualitative or quantitative analysis of myocardial deformation from which strain analysis, that is, change in the shape of the myocardium, can be performed.

FIGURE 3-6 Short-axis gradient echo images obtained with orthogonal myocardial tagging in a patient with hypertrophic cardiomyopathy. A, In this end-diastolic image, tag lines have been created over all tissues in the image field, including within the chest wall (arrowheads) and the left ventricular myocardium (arrows). The tag lines themselves are dark, and their intersections are orthogonal. B, In this end-systolic image, notice that the tag lines have faded and that the angles of the intersections in the heart have changed, but those of the chest wall have not. The ventricular myocardium has deformed over the cardiac cycle, but the tissues of the chest wall have not.
Perfusion and Delayed Hyperenhancement Imaging
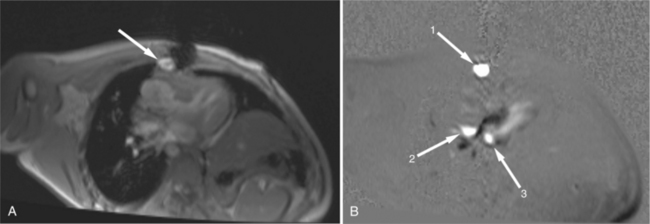
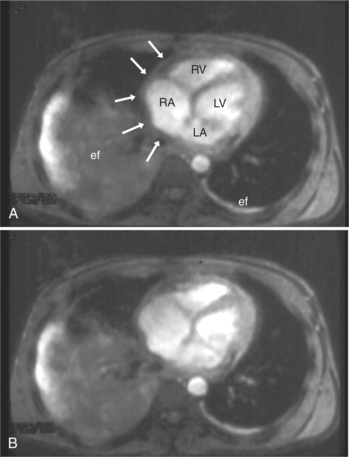
Rapid imaging over the heart after bolus intravenous contrast administration will produce a series of images displaying the passage of the contrast through the cardiac circulation. Contrast enhancement of the blood pool within the right atrium and ventricle is followed, after passage through the lungs, to the cavities of the left atrium and left ventricle, and then via the coronary circulation into the interstitial space of the ventricular myocardium (Fig. 3-7). Areas of decreased myocardial blood flow appear as relative signal voids within a segmental distribution corresponding to the upstream arterial narrowing. Thus, regional distribution of blood flow and the assessment of myocardial perfusion can be performed in much the same manner as in a nuclear perfusion examination. The sensitivity of detecting myocardial ischemia is improved by imaging after administration of a pharmacologic vasodilator. A hemodynamically significant coronary arterial stenosis is present if coronary blood flow cannot be increased by vasodilator stimulus. When hybrid echo planar pulse sequences and pharmacologic vasodilatation are used, 87% to 90% sensitivity and 85% specificity for detecting significant coronary stenosis can be obtained. Gadolinium-chelate contrast material remains in the extracellular space when administered by intravenous route. If the normal signal of ventricular myocardium is nulled by administration of a presaturation pulse, delayed imaging 10 minutes after intravenous contrast administration visualizes the heart after the contrast has cleared the cardiac cavities and the myocardium, revealing a relative signal void in normal myocardium (Fig. 3-8). Delayed washout kinetics and an increased volume of gadolinium distribution in the interstitial space of abnormal myocardium result in delayed myocardial enhancement. This technique has been found useful in characterizing myocardial infarction and fibrosis in other cardiac disorders.

FIGURE 3-7 Short-axis perfusion images of the heart obtained after intravenous administration of Gd-DTPA. A, Contrast has not yet reached the heart. Differentiation between left ventricular myocardium (arrow) and cavity is difficult. B, Contrast has reached the right ventricular cavity. The left ventricular myocardium (arrow) is unchanged in appearance. C, Subsequently, contrast within the right ventricular cavity has diminished, and now the left ventricular cavity has opacified. The left ventricular myocardial signal (arrow) remains low. D, Contrast is clearing the left ventricular cavity, and the left ventricular myocardium (arrow) enhances homogeneously, indicating normal perfusion.

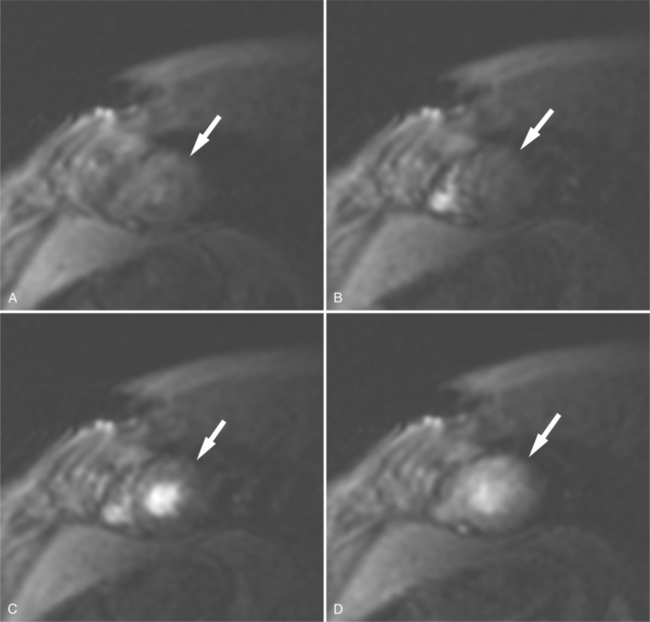
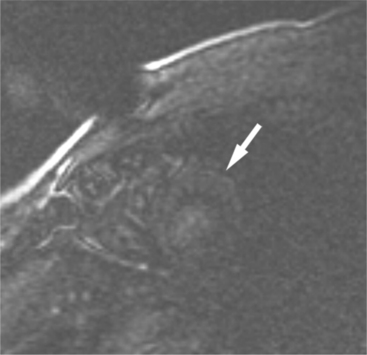
FIGURE 3-8 Short-axis image of the heart obtained 10 minutes after intravenous administration of Gd-DTPA (see Figure 3-7A) and immediately after a presaturation pulse. The viable left ventricular myocardium (arrow) is barely visible.
In this chapter, we will review the use of ECG-gated MRI techniques for the diagnosis and evaluation of patients with acquired heart disease. This chapter details the process of planning, performing, and interpreting a CMRI examination. We focus our comments on discussing pathophysiologic mechanisms and recognizing their effect on cardiac morphology and function as displayed in MR images.
PERICARDIAL DISEASES
Normal Pericardium
Although the initial evaluation of the pericardium is usually with echocardiography, MRI frequently adds useful information for confirming and characterizing pericardial disease. The pericardium consists of the visceral pericardium, the parietal pericardium, and about 40 ml of pericardial fluid contained between them. The visceral pericardium is a monolayer of mesothelial cells that covers the external surface of the heart. Beneath the visceral pericardium is either myocardium or epicardial fat. This layer extends for short distances along the pulmonary veins, the superior vena cava to just below the azygous vein, the inferior vena cava, the ascending aorta to a point 20 to 30 mm above the root, and the main pulmonary artery as far as its bifurcation. It then reflects on itself to become the parietal pericardium, which is a 1-mm-thick outer fibrous layer composed of dense collagen lined on the inside by a monolayer of mesothelial cells.
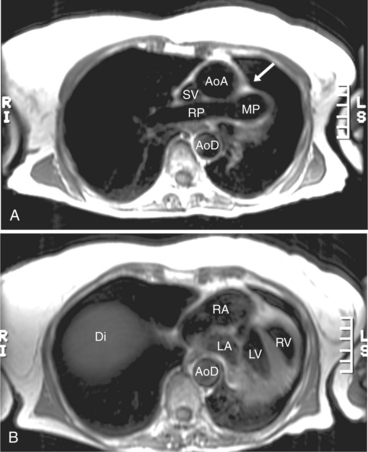
The visceral pericardium is normally thin and not visualized separately by any imaging modality. The combination of the visceral pericardium and the small volume of physiologic pericardial fluid constitutes the normal pericardium routinely visualized on MRI as a 1- to 2-mm-thick layer, which can appear focally thicker at the sites of its major attachments. On SE MR the normal pericardium appears as a pencil-thin line of low signal intensity between the epicardial and pericardial fat (Fig. 3-9). The low signal is attributed to the fibrous nature of the parietal pericardium, the low protein content of pericardial fluid, and the nonlaminar flow patterns caused by cardiac pulsation.

FIGURE 3-9 Axial double inversion recovery acquisition through the suprahepatic inferior vena cava (IV) and dome of the liver (Li). The pericardium (arrowheads) appears as a thin low signal line separating the epicardial from pericardial fat. The distal right coronary artery (arrow) is beneath the pericardium, embedded within the fat of the inferior aspect of the anterior atrioventricular ring. The inferior aspect of the right (RV) and left (LV) ventricles are labeled.
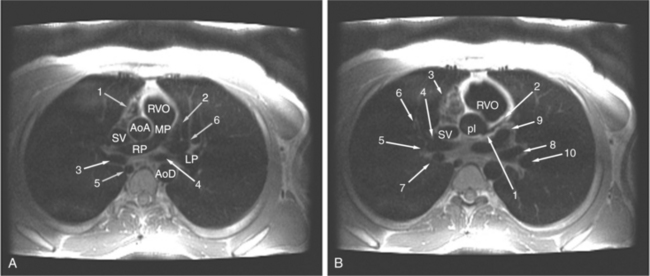
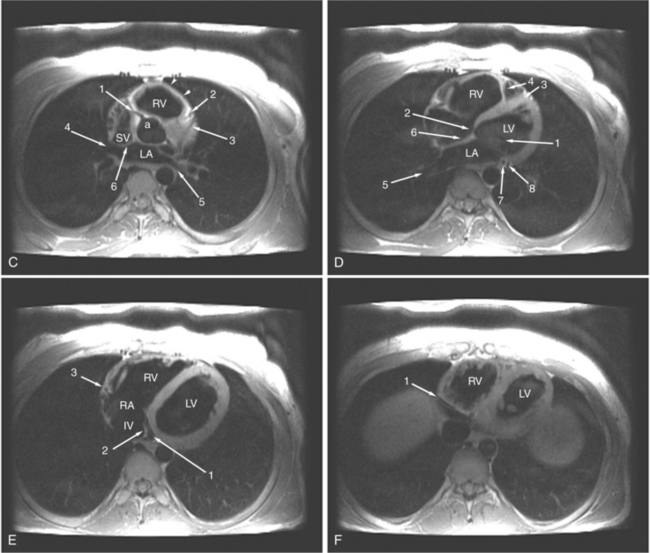
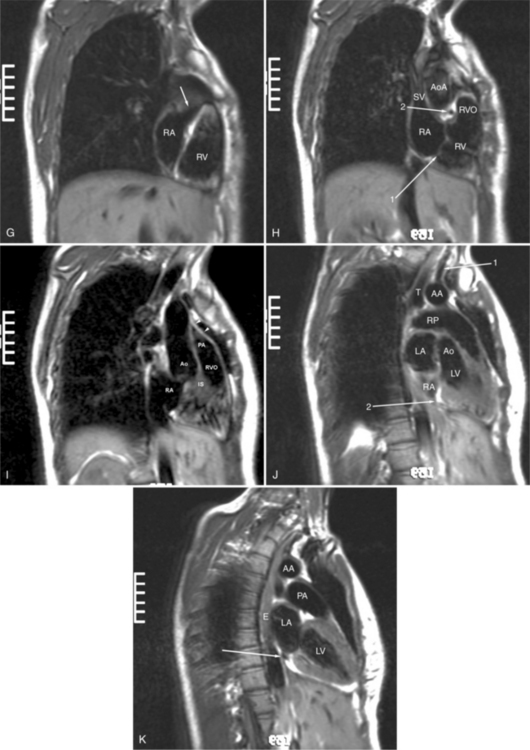
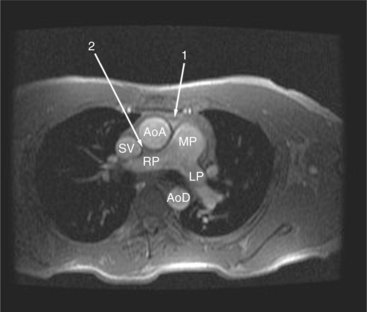
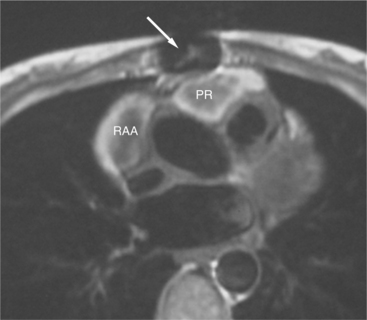
The reflection of pericardium around the great arteries and veins forms the two pericardial “appendages.” Anterior to the aorta this contiguous pericardial space is called the “preaortic recess,” whereas posteriorly it is called the “retroaortic” or superior pericardial recess (Fig. 3-10). Posterior and lateral to the heart, the extraparenchymal pulmonary veins and the superior and inferior venae cavae are enveloped by the pericardium. The intrapericardial space between the pulmonary veins is called the oblique sinus. It is essential to appreciate the anatomic extent and location of these pericardial sinuses since they are normally seen on MR.

FIGURE 3-10 Axial gradient echo acquisition through the main (MP) and proximal left (LP) and right (RP) pulmonary arteries. Fluid within the preaortic (arrow 1) and superior pericardial (arrow 2) recesses is of intermediate to bright intensity. The superior vena cava (SV) and ascending (AoA) and descending (AoD) thoracic aorta are labeled.
Pericarditis and Pericardial Effusions
Normal pericardium most commonly responds to insult by cellular proliferation or the production of fluid. Pericarditis results in pericardial thickening. The abnormal pericardium is characterized by intermediate signal intensity on both SE and GE examination (Fig. 3-11). The most common manifestation of acute pericarditis is an effusion. The character of the fluid varies with the underlying cause of the effusion. Transudative pericardial effusion may develop after cardiac surgery or in congestive heart failure, uremia, postpericardiectomy syndrome, myxedema, and collagen-vascular diseases (Fig. 3-12). Hemopericardium may be found after trauma, aortic dissection, aortic rupture, or in cases of pericardial neoplasm (especially primary pericardial mesothelioma). The typical appearance of common pericardial effusion in increased distance between the epicardial and pericardial fat, characterized by low-to-absent signal on SE and bright signal on GE images. Thus, pericarditis (with or without associated effusion) and pericardial effusion are differentiated by the signal of the pericardium and its contents.

FIGURE 3-11 Axial acquisition from a 45-year-old woman with shortness of breath. A, Double inversion recovery acquisition. Small bilateral pleural effusions layer posteriorly (arrowheads). Intermediate signal intensity of the thickened parietal (arrow 1) and visceral (arrow 2) pericardium adjacent to the right atrium (RA) is separated by the low intensity (arrow 3) of intervening pericardial fluid. B, Gradient echo acquisition from the same anatomic level. Although the anatomic detail is slightly different in this acquisition, the finding of pericardial thickening increasing the distance between the cavity and outer wall of the right atrium is conspicuous. Note the difference in signal intensity of the pleural fluid.

FIGURE 3-12 Axial acquisitions from a 57-year-old woman with shortness of breath. A, Double inversion recovery acquisition through the primum interatrial septum (arrow 1) and atrioventricular septum (arrow 2). The circumferential pericardial effusion appears as a signal void separating the parietal pericardium (arrowheads) from the heart. Note the bilateral pleural effusions and pulmonary atelectasis. B, Gradient echo acquisition obtained at the same anatomic level. The effusions now have an increased signal intensity.
On SE examination, hemorrhagic pericardial effusion presents as areas of mixed low, intermediate, and high signal, depending on the age of the blood. Nonhemorrhagic effusions on SE MR have predominantly low signal intensity as a result of spin phase change of the pericardial fluid. GE MR sequences display freely mobile pericardial fluid as high signal intensity. The high protein content of inflammatory pericardial fluid seen in uremia, tuberculosis, or trauma may have intermediate signal intensity components on SE MR, especially in dependent areas (Fig. 3-13). Furthermore, because adhesions are common in pericardial inflammation, inflammatory effusions may not have the normal free flow patterns of pericardial fluid leading to loci of increased signal intensity on SE sequences similar in appearance to loculated pericardial effusions. Pericardial inflammation, as seen in uremic or tuberculous pericarditis or trauma following resuscitation, appears as increased signal intensity as compared with myocardium on SE MR acquisition (Fig. 3-14).

FIGURE 3-13 Axial double inversion recovery acquisition from a 40-year-old man with chronic renal failure. A large circumferential pericardial collection separates the parietal pericardium (arrowheads) from the heart. The signal intensity fibrinous fluid (long arrows), collecting in the dependent posterior aspect of the enlarged pericardial space has higher signal intensity.

FIGURE 3-14 Axial double inversion recovery acquisition from a 55-year-old man 1 day after cardiac transplantation. Hemorrhage from an aortic suture failure presents as increased signal intensity surrounding the right atrial appendage (RAA), and within the preaortic recess (PR). The signal void (arrow) is caused by a sternal suture.
Congenital Absence of the Pericardium
Absence of the pericardium is thought to be a result of compromise of the vascular supply to the pleuropericardial membrane that surrounds the ventral cardiac tube during embryologic development. Pericardial defects may vary in size from small communications between the pleural and pericardial cavities to complete (bilateral) absence of the pericardium. The most common form is complete absence of the left pericardium, with preservation of the pericardium on the right side (Fig. 3-15).

FIGURE 3-15 Axial double inversion recovery images from a 52-year-old woman with an unusual chest film. A, Notice how the mediastinal structures are displaced into the left chest. No longer excluded by the pericardium, the left lung has insinuated itself (arrow) in the space previously occupied by the main pulmonary artery (MP), which is now rotated posteriorly and to the left. The ascending (AoA) and descending aorta (AoD), superior vena cava (SV), and right pulmonary (RP) artery are identified. B, Viewed at the level of the right diaphragm (Di), the heart is markedly rotated in a clockwise manner and displaced toward the left. The right atrium (RA) is now directly behind the anterior chest wall, and the right ventricle (RV) lies to the left of the left ventricle (LV). Despite this pronounced rotation, there is no evidence of cardiac abnormality. The AoD and left atrium (LA) are labeled.
Noninvasive modalities, such as MRI, have replaced cardiac angiography as the methods of choice for definitive diagnosis of this abnormality. In particular, the multiplanar capabilities of MRI allow direct identification of the absent segment of the parietal pericardium (resulting in direct contact between the heart and lung) or the profound leftward displacement and rotation of the heart in the chest. Unless associated with acquired or congenital heart disease, the intracardiac structure should be normal.
Pericardial Cysts and Diverticula
If a portion of the pericardium pinches off completely from the pleuropericardial membrane during embryologic development, a pericardial cyst forms, containing the same mesothelial lining as the normal pericardium (Fig. 3-16). Similarly, a pericardial diverticulum is a cyst that fails to completely separate, leaving persistent communication with the pericardial space. SE MR acquisition depicts these findings as fluid-filled paracardiac masses. If multi-echo acquisition is obtained, then the cyst appears to increase in signal (with respect to the surrounding organs) on longer echo time (TE) images (see Figure 3-2).

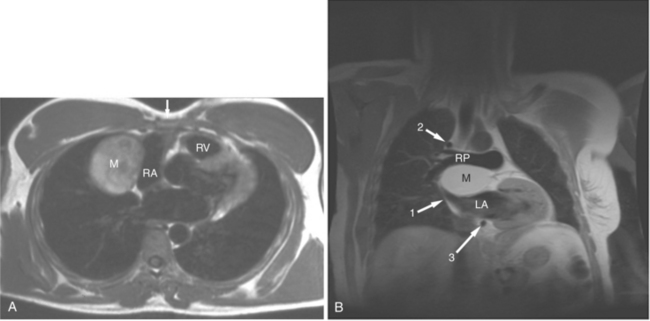
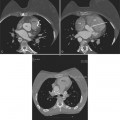
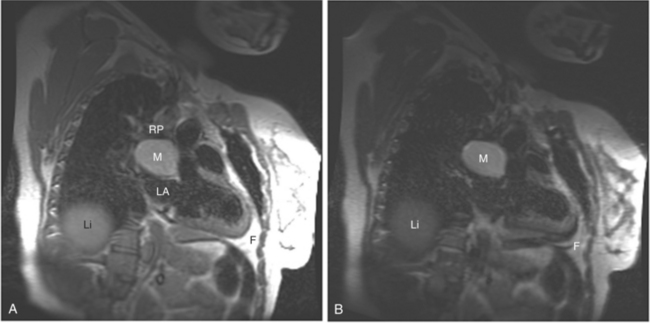
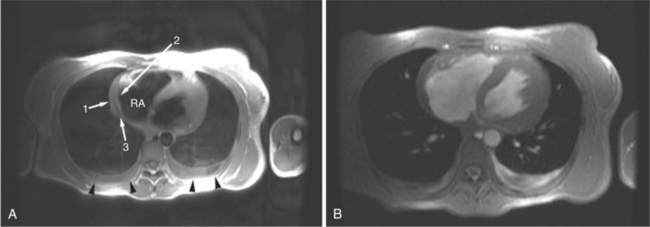
FIGURE 3-16 Two patients with pericardial cysts. A, Axial double inversion acquisition from an asymptomatic 26-year-old man with an unusual chest film. A large, circumscribed, nearly homogeneous high signal intensity mass (M) extrinsically compresses the right atrium (RA) and displaces the heart toward the left. Notice how the right ventricular (RV) free wall lies to the left of the sternum (arrow). B, Coronal spin echo acquisition from a 40-year-old woman with an unusual chest film (same patient as in Figure 3-2). A circumscribed, homogeneous, high signal intensity mass (M) elevates the right pulmonary artery (RP) and compresses the left atrium (LA) and right upper lobe pulmonary vein (arrow 1). This is an intrapericardial pericardial cyst. The azygos vein (arrow 2) and coronary sinus (arrow 3) are viewed in cross section.
Pericardial Tamponade
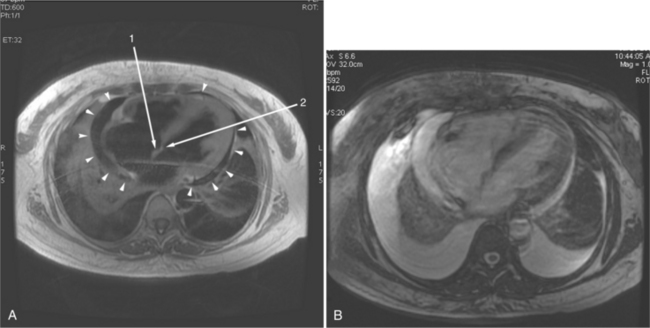
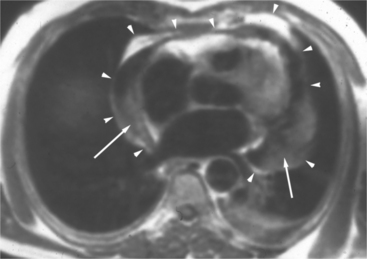
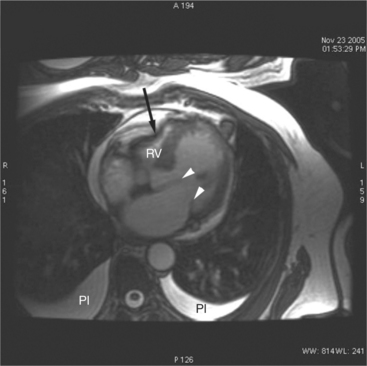
The rapid accumulation of as little as 100 to 200 ml of fluid can impede diastolic ventricular filling and lead to pericardial tamponade. Pericardial tamponade occurs when reduced stroke volume limits maintenance of cardiac output. Although MRI is not the initial diagnostic modality for evaluating tamponade, it is frequently instrumental in suggesting the cause of the effusion (i.e., hemorrhage, neoplastic involvement, inflammation resulting from tuberculosis or other infectious processes) in this acutely emergent situation. Double inversion recovery demonstrates pericardial thickening and a “tubular” right ventricle (Fig. 3-17). Cine MRI may be useful to demonstrate diastolic atrial or ventricular collapse (Fig. 3-18). In many cases, the motion of the interventricular septum is paradoxical. Earlier right ventricular filling results in diastolic bowing of the septum toward the left ventricle.

FIGURE 3-17 Diastolic gradient echo acquisition from a 64-year-old man with shortness of breath. The mitral valve leaflets (arrowheads) are separated. A circumferential pericardial fluid collection appears as high signal intensity, similar to that of the bilateral pleural (Pl) effusions. The right ventricular (RV) free wall is collapsed (long arrow) against the interventricular septum.

FIGURE 3-18 Axial gradient echo acquisition from a 26-year-old immigrant student with shortness of breath. A, End-diastolic image shows increased thickening of the pericardium, most obviously (arrows) around the right atrial (RA) and medial right ventricular (RV) borders. Notice the long or “tubular” appearance of the RV. Also notice the large right and smaller left pleural effusions (ef). B, End-systolic frame. There is little change in the appearance of the RV chamber as a result of poor filling of the constricted RV. LA, left atrium; LV, left ventricle.
Pericardial Constriction
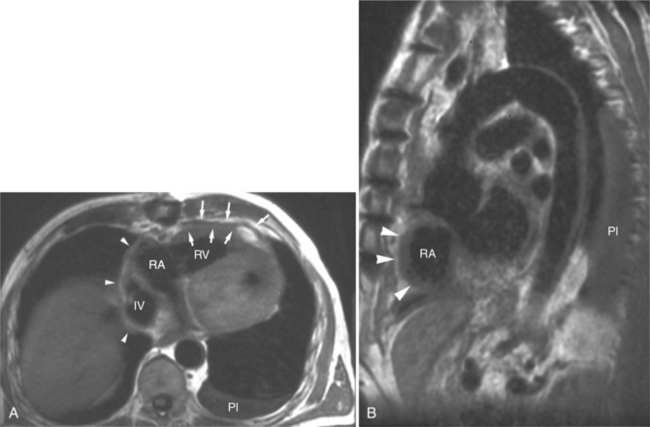
The hallmark of pericardial constriction is pericardial thickening (with or without pericardial calcification) and abnormal diastolic ventricular function. In the majority of cases, constrictive pericarditis involves the entire pericardium, compromising filling of both the right and left heart. Occasionally, however, local chronic pericardial thickening has been reported. Focal pericardial thickening is more commonly seen in the postoperative patient and is frequently located anterior to the right ventricle (Fig. 3-19). The clinical findings of constrictive pericarditis overlap with those of restrictive cardiomyopathy, a primary disorder of the myocardium. Differentiation between these two entities is imperative because patients with pericardial constriction may benefit from pericardiectomy; myocardial restriction may be rapidly progressive and necessitate cardiac transplantation. In pericardial constriction, the right ventricle may appear tubular in appearance. Gradient echo acquisition demonstrates decreased right ventricular contractile function and limited diastolic excursion, common to both restriction and constriction (Fig. 3-20). Dilatation of the right atrium, venae cavae, coronary sinus, and hepatic veins, reflecting right heart failure may be found in cases of constrictive pericarditis and in cases of restrictive cardiomyopathy. Abnormal right heart filling in constriction is visualized as early diastolic right atrial or right ventricular collapse and the septal “bounce,” which is early reversal of septal curvature.

FIGURE 3-19 Double inversion recovery acquisitions from a 70-year-old man 8 years after coronary artery bypass surgery. A, Axial acquisition shows thickening of the pericardial space anterior to the right ventricle (RV) and along the right atrium (RA) and suprahepatic inferior vena cava (IV). There is a small left pleural effusion (Pl). B, Left anterior oblique sagittal acquisition. The RA border is thickened (arrowheads). The left Pl is again evident.

FIGURE 3-20 Gradient echo acquisition from a 64-year-old man 5 years after coronary artery bypass surgery with shortness of breath. A, End-diastolic image. No significant pericardial thickening is evident. The right (RV) and left (LV) ventricles are labeled. Note the bilateral pleural effusions (Pl) and signal void of the sternal suture (SS). B, End-systolic image. In comparison with part A, notice the difference in contractile change between the LV and RV.
Symptomatic pericardial constriction may be found in the absence of conventional radiographically detectable pericardial thickening, however. Pericardial thickening is not diagnostic of pericardial constriction; demonstration of pericardial thickening greater than 4 mm in face of characteristic hemodynamic findings distinguishes constrictive pericarditis from restrictive cardiomyopathy.
Calcium produces no signal on MRI. On SE MR, pericardial fibrosis and calcification appear as irregular edges along the signal void of the pericardial space, separating the epicardial and pericardial fat pad. Direct characterization of abnormal myocardium (i.e., in restrictive cardiomyopathy) using delayed hyperenhancement imaging is a useful tool and will be discussed in detail in that section.
Myocardial Ischemia and Infarction
Myocardial ischemia is caused by increased myocardial oxygen demand, decreased myocardial oxygen supply, or both. It is always accompanied by inadequate removal of metabolites because of reduced blood flow or perfusion. Thus, it is uncommon to find symptoms of ischemia in patients with cyanotic congenital heart disease, cor pulmonale, and severe anemia, where myocardial perfusion is maintained, albeit at low arterial oxygen saturation. In the face of proximal significant (>70%) coronary arterial narrowing, an increase in myocardial oxygen requirements caused by exercise, tachycardia, or emotional stress leads to a transitory imbalance between oxygen demand and supply, resulting in chest pain. When relieved by rest or sublingual nitroglycerine, this condition is referred to as chronic stable angina. An acute decrease in oxygen supply secondary to increased coronary vascular tone (i.e., coronary vasospasm) or marked reduction or cessation of coronary blood flow caused by platelet aggregation results in episodes of unstable angina. Acute myocardial infarction is usually caused by thrombotic occlusion of an epicardial coronary artery. Lack of oxygen supply to the myocardium downstream from the occlusion leads to anaerobic glycolysis with resultant accumulation of lactic acid and other byproducts. Within an hour of the initial ischemic insult, subendocardial infarction ensues, subsequently progressing outward toward the subepicardium. The transmural pattern of progression is related to the greater systolic wall stress and oxygen consumption in the subendocardial zone, as well as limited subendocardial collateral flow, which is preferentially shunted to the subepicardial region.
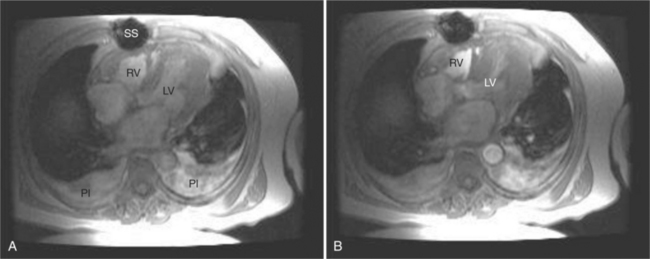
Cardiac MR has become the clinical gold standard for quantitation of cardiac chamber volume and myocardial mass. The accurate and reproducible quantitative data obtained from MR examination makes GE MRI appealing as an imaging modality for long-term follow-up of patients with ischemic heart disease. MRI is valuable for assessment of regional and global contractile function; clinically, this is usually achieved by visual inspection of cines in standard imaging planes. Quantification of wall motion and thickening using conventional techniques is possible for both the left ventricle and the right ventricle. Regions of myocardial ischemia or infarction appear as areas of thinned ventricular myocardium and segments of decreased or absent contraction (Fig. 3-21).

FIGURE 3-21 Gradient echo acquisitions from a 62-year-old woman with a history of prior acute myocardial infarction. A, End-diastolic axial acquisition through the inferior aspect of the right atrium (RA) and tricuspid valve (arrowheads) at the entry of the suprahepatic inferior vena cava (IV) and coronary sinus (CS). The antero-apical left ventricular (LV) myocardium (small black arrows) is thinner than that of the interventricular septum (arrow 1) and lateral wall (arrow 2). The circumferential pericardial effusion and bilateral pleural effusions acquire a high signal. B, End-systolic image obtained at the same anatomic level. The RA is larger, and both the right ventricle (RV) and LV are smaller. Compare the differences in thickening among the wall segments. C, End-diastolic short-axis acquisition through the midinterventricular septum. The LV side of the interventricular septum appears smoother than the RV side. The bright signal of a pericardial effusion surrounds the heart. The anterior (arrow 1) and basal interventricular septal (arrow 2) walls are thin, as compared with the lateral (arrow 3) and inferior (arrow 4) walls. D, End-systolic image obtained at the same anatomic level. Both the RV and LV are smaller. Compare the differences in thickening among the wall segments. The anterior (arrow 1), septal (arrow 2), lateral (arrow 3), and inferior (arrow 4) walls are labeled.
Quantitation of ventricular function is based on GE acquisition and planimetry of the endocardial and epicardial contours of images obtained at intervals in the cardiac cycle (Fig. 3-22). The volume of the left ventricular chamber within each slice is the planimetered endocardial area multiplied by the slice thickness (Fig. 3-23). The left ventricular end-diastolic volume is calculated as the sum of the volumes of the slices of the heart through the left ventricle obtained at end diastole. Similarly, the left ventricular end-systolic volume is the sum of the slice volumes obtained at end systole. Ventricular stroke volume is the difference between end-diastolic volume and end-systolic volume. Ejection fraction is the stroke volume indexed to (divided by) the end-diastolic volume. Cardiac output is the stroke volume multiplied by the heart rate.

Full access? Get Clinical Tree

