Radiopharmaceutical
Targeted biologic process
Uptake mechanism
Physical half-life
FDA-approved
15O-water
Myocardial perfusion
Freely diffusible
2 min
No
13N-ammonia
Myocardial perfusion
Metabolic trapping
10 min
Yes
82Rubidium
Myocardial perfusion
Na/K ATPase
76 s
Yes
18F-FDG
Myocardial metabolism
Metabolic trapping, glucose metabolism
110 min
Yes
62Cu-PTSM
Myocardial perfusion
Intracellular binding
10 min
No
11C-acetate
Myocardial metabolism
Krebs cycle flux, oxidative metabolism
20 min
No
11C-palmitate
Myocardial metabolism
Fatty acid metabolism
20 min
No
11C-glucose
Myocardial metabolism
Glucose metabolism
20 min
No
18F-FTHA
Myocardial metabolism
Fatty acid metabolism
110 min
No
11C-HED
Sympathetic innervation
Sympathetic uptake-1 and storage
20 min
No
11C-epinephrine
Sympathetic innervation
Sympathetic storage
20 min
No
18F-dopamine
Sympathetic innervation
Sympathetic uptake and function
20 min
No
11C-CGP12177
β-Adrenoceptor density
Receptor binding
20 min
No
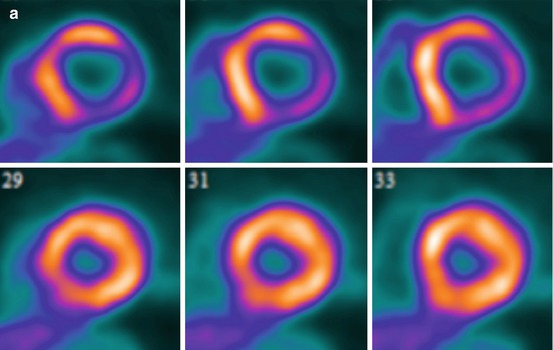
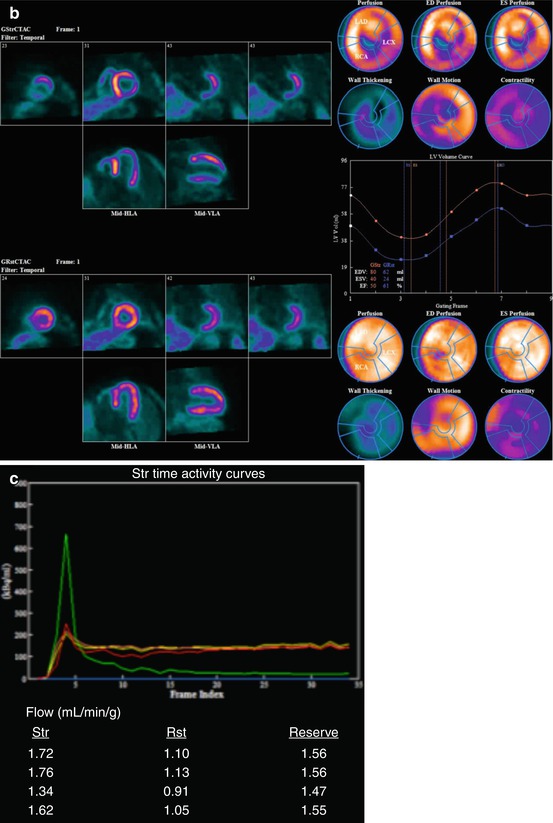
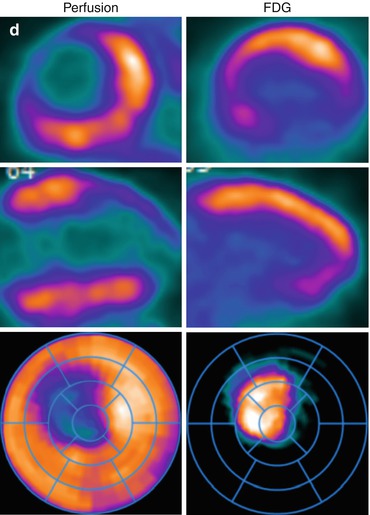
Fig. 14.1
Multidimensional PET protocol. Panel A: Stress and rest myocardial perfusion images delineating the extent of ischemia and scar. Panel B: ECG-gated images allow quantification of left ventricular volumes and ejection fraction at peak (or post) stress and at rest. Panel C: Multiframe or dynamic data allows tracer kinetic analysis and quantification of regional and global myocardial blood flow (in mL/min/g of tissue) and coronary flow reserve. Panel D: Metabolic imaging allows investigation of myocardial metabolism and tissue viability
14.1.2 Radiopharmaceuticals
Table 14.1 lists the most common radiopharmaceuticals used with PET in translational research and clinical practice.
14.2 Imaging Markers of Coronary Artery Disease from Hybrid PET/CT
The integrated PET/CT approach provides access to a comprehensive list of quantitative imaging markers that have been used successfully in clinical research and are quickly being incorporated into clinical practice.
14.2.1 Atherosclerotic Burden
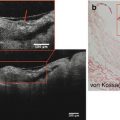
ECG-gated scanning for coronary artery calcium (CAC) offers a reproducible, easy-to-perform method to reliably determine whether coronary calcification is present or absent, without the need of intravenous contrast administration. The extent and severity of calcification, reflecting the burden of atherosclerosis in the coronary arteries, can be quantified by validated scoring techniques (e.g., Agatston score). A score of 0 indicates no coronary calcification and portends very low risk of adverse cardiovascular events, whereas a score ≥400 indicates severe calcification and higher clinical risk [1]. Coronary calcium scanning is often performed in patients without known CAD undergoing myocardial perfusion PET/CT imaging. In selected patients, it is also possible to use ECG-gated CT imaging to obtain high-quality images of the coronary arteries after the administration of intravenous contrast, which allows visualization of both calcified and noncalcified plaques, as well as estimation of the severity of coronary artery narrowing resulting from those plaques.
14.2.2 Myocardial Perfusion and Metabolism
The myocardial perfusion imaging method is designed and targeted on the identification of flow-limiting stenoses. It is a robust approach to delineate flow-limiting CAD, quantify the magnitude of ischemic myocardium, and assess the extent of tissue viability. Semiquantitative assessments of ischemia and scar with radionuclide imaging are accurate and highly reproducible. In the integrated hybrid imaging approach, the assessment of ischemia provides instant feedback regarding the physiologic significance of upstream epicardial coronary stenosis, thereby guiding therapeutic management (i.e., selection of patients for revascularization).
There are two important limitations to the semiquantitative assessment of myocardial perfusion images: the underestimation of the extent of ischemia when all three coronary artery territories are affected and inability to characterize patients with nonobstructive atherosclerosis. At the moment, PET is the most validated technique to quantify myocardial blood flow (in mL/min/g of tissue) and estimate coronary flow reserve (CFR; as the ratio of peak myocardial blood flow over that at rest). As discussed below, these measurements of myocardial blood flow and CFR are powerful tools for clinical investigation and are emerging as clinically useful imaging markers that help improve diagnosis and risk stratification of patients with CAD.
14.2.3 Myocardial Neuronal Function
The use of imaging probes designed to evaluate pre- and postsynaptic targets of the cardiac autonomic nervous system allows quantification of autonomic function and offers insights into the pathophysiology of a variety of cardiovascular disorders. For example, recent data suggest that quantitative imaging of the cardiac sympathetic nervous system may help identify patients with heart failure at risk for sudden cardiac death [2, 3]. In experimental models of myocardial infarction, the presence of functional sympathetic denervation within areas of viable myocardium identifies sites at higher risk of ventricular tachycardia inducibility [4]. There is emerging clinical trial data suggesting that this approach may provide a useful method for identification of patients at highest risk for sudden cardiac death [2, 3].
14.2.4 Left Ventricular Function
Left ventricular ejection fraction is one the most powerful predictors of prognosis in cardiovascular medicine. ECG-gated myocardial perfusion imaging allows accurate and reproducible quantification of the left ventricular volumes and ejection fraction.
14.3 Use of PET/CT Imaging Markers in Translational Research and Clinical Practice with a Focus in Atherosclerosis
14.3.1 Preclinical Characterization of Atherosclerosis
14.3.1.1 Coronary Artery Calcification
Coronary artery calcification is part of the development of atherosclerosis. The process begins early and accelerates as the disease progresses. CAC occurs exclusively in atherosclerotic arteries and is absent in normal vessels. Although the extent of CAC correlates with the histologic plaque burden, its absence does not necessarily exclude atheromatous plaque especially in the young and in symptomatic populations. Because calcification is a surrogate measure of coronary atherosclerosis, clinical interest has focused on the usefulness of noninvasive detection of calcium as a coronary risk stratification tool. The Multiethnic Study of Atherosclerosis (MESA) involved 6,722 individuals with no known cardiovascular disease who were followed up for a median of nearly 4 years [1]. In comparison to participants without calcification (CAC score 0), those with a score >300 had a nearly sevenfold higher adjusted risk of a major coronary event. Importantly, the presence of coronary calcification provided predictive information beyond that derived from standard risk factors (i.e., Framingham risk score). Moreover, a recent study of 44,052 asymptomatic subjects followed for a median of 5 years demonstrated a stepwise increase in mortality risk with increasing CAC among individuals without traditional risk factors [5]. The observation that CAC improves risk prediction beyond that of conventional risk factor-based algorithms has been confirmed by multiple large observational studies, and guidelines now recommend the use of CAC for select low- to intermediate-risk individuals.
14.3.1.2 Coronary Vasomotor Dysfunction
Coronary vasomotor dysfunction is an early manifestation of atherosclerosis. As discussed above, PET allows direct measurements of coronary blood flow and flow reserve in response to vasodilator stress and cold pressor testing. There is an extensive literature documenting the presence of impaired coronary flow reserve in asymptomatic patients with coronary risk factors without obstructive CAD [6, 7]. These abnormalities have been associated with the deleterious effects of oxidative stress, hyperglycemia, low-level systemic inflammation, as well as the fluid dynamic effects of diffuse atherosclerosis and microvascular remodeling on coronary vasodilator function.
There is consistent evidence supporting quantitative CFR as a powerful marker of vascular health and, as such, a useful marker to improve diagnosis and risk stratification and to monitor response to treatment, particularly in the context of clinical trials. The accuracy of quantitative noninvasive PET measures of myocardial blood flow and flow reserve by PET has been extensively validated in experimental animals [8] and humans [9–12]. The reproducibility of this technique is also well established [11, 12]. PET is considered the gold standard for quantifying coronary blood flow and flow reserve. There is also growing evidence that quantitative CFR as a measure of coronary vascular dysfunction is a modifiable imaging biomarker, which has been tested in the context of clinical trials (Table 14.2) [13–21]. This suggests that CFR can also be used as a surrogate end point to assess efficacy of treatments aimed at reducing the burden of risk factors.
Table 14.2
Clinical trial experience using PET imaging end points
Author | Trial design | Setting | Cohort | Sample size | Intervention | Exposure | End point | Result | P value |
|---|---|---|---|---|---|---|---|---|---|
Alexanderson [13] | Open label | Single center | Dyslipidemia w/o CAD | 14 | Ezetimibe/simvastatin | 8 weeks | CFR | 13 % | NS |
Ling [18] | RCT | Single center | Dyslipidemia w/CAD | 72 | Pravastatin, simvastatin, placebo | 8 weeks | CFR | – | NS |
Baller [14] | Open label | Single center | Dyslipidemia w/o CAD | 23 | Simvastatin | 6 months | CFR | 20 % | 0.01 |
Guethlin [15] | Open label | Single center | Dyslipidemia w/ CAD | 15 | Fluvastatin | 6 months | CFR | 38 % | <0.05 |
Ilveskoski [16] | RCT | Single center | Dyslipidemia w/o CAD | 44 | Pravastatin | 6 months | CFR | 18 % | 0.05 |
Lehtimaki [17] | RCT | Single center | Dyslipidemia w/o CAD | 34 | Pravastatin | 6 months | CFR | 18 % | 0.002 |
Sdringola [21] | RCT | Multicenter | Dyslipidemia w/CAD | 145 | Atorvastatin | 6 months | Semiquant TPD | – | NS |
McMahon [19] | RCT | Single center | Type 2 DM w/o CAD | 16 | Pioglitazone | 12 weeks | CFR | – | NS |
Schelbert [20] | RCT | Multicenter | Dyslipidemia w/CAD | 274 | Atorvastatin + avasimibe vs. atorvastatin | 12 months | CFR | – | NS |
Adler (unpublished) | RCT | Single center | Type 2 DM w/o CAD | 64 | Spironolactone vs. HTCZ vs. placebo | 6 months | CFR | 15 % | 0.006 |
14.3.1.3 Interaction Between CAC and Coronary Vasomotor Dysfunction
Postmortem studies have shown that there are many noncalcified plaques for every calcified plaque [22]. Thus, it is unclear whether CAC itself increases the risk of adverse coronary outcomes or whether CAC deposition serves as a proxy for the extent and magnitude of noncalcified atherosclerosis and its adverse functional consequence of coronary vasomotor function. Measures of coronary flow reserve (reflecting both endothelial and smooth muscle cell dysfunction) are weakly correlated with CAC and also with the total plaque burden as assessed by coronary CT angiography. Indeed, there is wide variability in abnormal coronary vasomotor function in each level of CAC score or luminal angiographic severity (Fig. 14.2) [23, 24]. The scatter of coronary flow reserve values within varying degrees of coronary plaque burden suggests that epicardial coronary plaque burden is not a complete reflection of overall disease activity within the coronary circulation. Indeed, circulating inflammatory biomarkers (including CRP, IL-6, fibrinogen, MMP-9, MCP-1, TNF-alpha, and others) were found to have only a weak association with the burden of coronary artery calcifications [25]. Moreover, a recent study demonstrates that for any level of coronary artery calcification, the presence of abnormal coronary flow reserve is consistently associated with a higher rate of adverse cardiac events [24]. Together, these findings may help explain the relatively low numbers of coronary events even among patients with high coronary artery calcium scores [1, 26] and support the notion that measures of CAC and coronary vasomotor function provide distinct and complementary information regarding the extent of anatomic atherosclerosis and its physiologic significance.
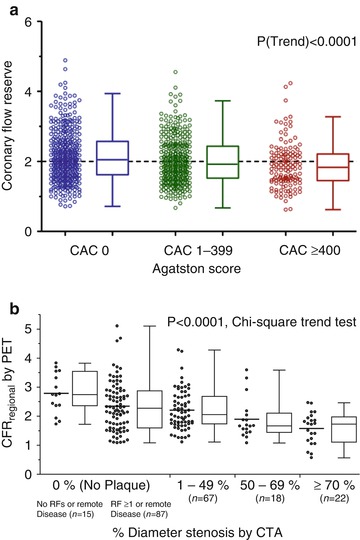
Fig. 14.2
Relationship between coronary flow reserve and atherosclerotic burden. Panel A: Coronary flow reserve across coronary artery calcium score categories (zero, 1–399, and ≥400). Panel B: Coronary flow reserve across categories of luminal angiographic stenosis by coronary CTA (Reproduced with permission from Refs. [23] and [24])
14.3.2 Evaluation of Symptomatic Patients with Suspected or Known CAD
14.3.2.1 Diagnosis of Obstructive Coronary Artery Disease
Two recent meta-analyses compared the diagnostic accuracy of PET and single-photon emission computed tomography (SPECT) myocardial perfusion imaging (MPI) for detecting obstructive CAD [27, 28]. The pooled mean sensitivity of PET was significantly higher than that of SPECT MPI (92.6 % and 90 % vs. 88.3 % and 85 %, respectively). However, no significant difference in specificity was observed between PET and SPECT (81.3 % and 88 % vs. 75.8 % and 85 %, respectively).
Despite its widespread use and acceptance, a recognized limitation of radionuclide myocardial perfusion imaging with PET (and SPECT) is that it often uncovers only coronary territories supplied by coronary arteries with the most severe stenosis, and, consequently, it is relatively insensitive to accurately delineate the extent of obstructive angiographic CAD especially in the setting of multivessel CAD [29, 30]. Two quantitative approaches with PET are used to help mitigate this limitation. One approach includes quantification of LVEF at rest and during peak stress. In normal subjects, LVEF increases during peak vasodilator stress [30]. In patients with obstructive CAD, however, the delta change in LVEF from baseline to peak stress (so-called LVEF reserve) is inversely related to the extent of obstructive angiographic CAD [30]. Indeed, patients with obstructive multivessel or left main disease show a frank drop in LVEF during peak stress even in the absence of apparent perfusion defects. In contrast, those without significant CAD or with single-vessel disease show a normal increase in LVEF. An adequate increase in LVEF during stress (≥6 % from baseline) has a high sensitivity and negative predictive value for excluding multivessel disease [30].
Another approach is to quantify myocardial blood flow (in mL/min/g) and CFR (calculated as the ratio of peak hyperemic myocardial blood flow over that at rest). A number of studies have demonstrated that among relatively young patients with modest coronary risk factor burden and predominantly single-vessel CAD, a relationship exists between myocardial blood flow or CFR and percent diameter stenosis on angiography [31–33]. These studies demonstrate that CFR is relatively preserved for lesions with less than 50 % stenosis. With increasing severity of stenosis beyond this level, however, there is progressive worsening of coronary flow reserve. These observations have served as the basis for the clinical use of quantitative myocardial blood flow to improve identification of obstructive CAD (Fig. 14.3) and especially to exclude the presence of angiographic multivessel CAD (Fig. 14.4) [34–36]. In the largest study to date [36], the presence of a relatively normal global CFR (>2.0) in patients with normal or abnormal myocardial perfusion scans was associated with a very low likelihood of high-risk angiographic CAD (NPV, 97 %).
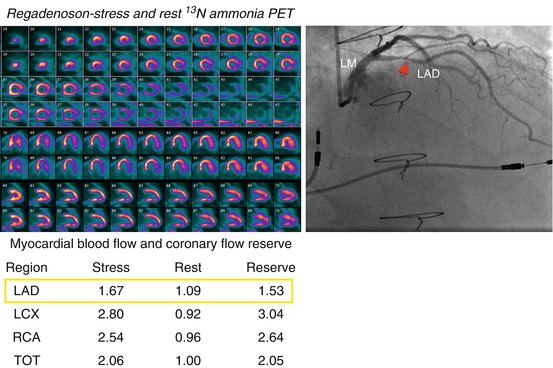
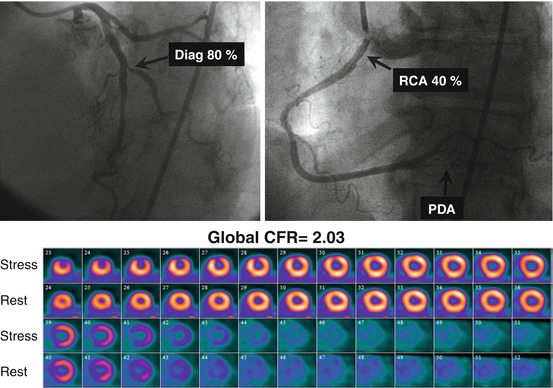
Fig. 14.3
Example of a 58-year-old male patient status post cardiac transplantation 17 years prior to PET presenting with pre-syncope. The stress-rest myocardial perfusion images (left upper panel) demonstrated no evidence of flow-limiting stenosis. However, the quantitative coronary flow reserve (left lower panel) was abnormal in the left anterior descending (red arrow in LAD) coronary territory (1.53; normal value >2.0). Subsequent coronary angiography (right upper panel) demonstrated a significant stenosis in the proximal LAD coronary artery
Fig. 14.4
A 66-year-old female patient with a history of high cholesterol and a family history of CAD referred for evaluation of atypical chest pain. The top panel presents selected coronary angiographic views of the left (a) and right (b) coronary arteries. There is severe disease in the first diagonal branch, moderate stenosis in the proximal RCA, and diffuse disease in the PDA. In the lower panel (c), the short axis stress-rest myocardial perfusion images demonstrate a small but severe perfusion defect involving the mid- and apical anterior wall, with complete reversibility. This patient’s quantitative global CFR was 2.03 (Reproduced with permission from Ref. [36])
14.3.2.2 Identification of Patients with Symptoms Due to Diffuse Atherosclerosis and Coronary Microvascular Dysfunction
There is increasing recognition that in many patients, the symptom of angina may not necessarily be caused by the presence of a focal coronary stenosis in the epicardial coronary arteries [37, 38]. Indeed, the presence of diffuse atherosclerosis without discrete narrowing of the coronary arteries as well as remodeling and dysfunction of the arteriolar circulation (invisible to coronary angiography) may result in abnormal myocardial perfusion and ischemia [39]. This syndrome of angina without obstructive CAD has been termed “syndrome X” or “microvascular angina” and has been linked to a higher incidence of adverse cardiovascular events [37, 40]. Quantification of myocardial blood flow and coronary flow reserve with PET integrates the hemodynamic effects of diffuse atherosclerosis and microvascular dysfunction on myocardial perfusion, thereby providing a practical, sensitive, and noninvasive method to diagnose whether angina symptoms are related to myocardial ischemia.
A recent study in a relatively large cohort of symptomatic patients without obstructive CAD demonstrated a high frequency (~50 %) of coronary vasomotor dysfunction (Fig. 14.5), reflecting preclinical coronary atherosclerosis, among women and men [40]. The severity of such vascular dysfunction is associated with older age and the burden of coronary risk factors including hypertension, diabetes, and obesity. More importantly, the presence of coronary vasomotor dysfunction increases the risk of adverse events irrespective of gender. The mechanisms underlying the observed coronary vasomotor dysfunction are likely to be multifactorial and related to autonomic dysregulation, as well as the adverse effects of oxidative stress, adenosine, endothelin-1, angiotensin II, and low-level systemic inflammation, among other stimuli on endothelial and smooth muscle cell dysfunction.
Fig. 14.5
Frequency and severity of microvascular dysfunction in women and men. Left panel: Pie charts demonstrating that more than 50 % of women and men showed abnormal coronary flow reserve (i.e., CFR < 2.0). Right panel: Histogram (top) showing the distribution of coronary flow reserve for men (blue) and women (red). Areas of overlap are shown in purple. Fitted lognormal distribution for men (dashed blue line) and women (dashed red line) are also displayed. Similar data are also shown in box plots (bottom). No statistically significant difference was seen between genders using t-test with lognormal distribution (P = 0.73). CFR was equivalent between the genders (P = 0.0005 for <10 % difference) using two one-sided tests and lognormal distribution (Reproduced with permission from Ref. [40])
14.3.2.3 Risk Stratification
The power of radionuclide myocardial perfusion imaging (including PET) for risk stratification is based on the fact that the major determinants of prognosis in patients with CAD are readily available from gated myocardial perfusion imaging. These include the amount of myocardial scar, the extent and severity of stress-induced ischemia, measurements of LV size (i.e., volumes), and ejection fraction. Optimal risk stratification is based on the concept that the risk associated with a normal study is sufficiently low that revascularization will not further improve patient outcomes. Hence, catheterization is an unlikely option after testing. Conversely, patients with abnormal stress imaging results are at greater risk of adverse events and, thus, are potential candidates for intervention, and the magnitude of their risk is related to the extent and severity of the imaging abnormalities.
There is emerging, consistent data that like SPECT MPI, stress myocardial perfusion PET also provides robust risk stratification. A recent review of the published literature suggests an elevated 5.1-fold (95 % CI 2.8–9.3) increase in risk of adverse cardiovascular events for patients with an abnormal as compared to normal stress myocardial perfusion PET scan [41]. These data have now been confirmed in a large multicenter registry that evaluated prognosis in 7,061 patients undergoing pharmacological stress 82Rb PET myocardial perfusion imaging [42]. This registry demonstrated that for the prediction of cardiac death and all-cause death, an abnormal PET scan provided significant incremental prognostic value over pre-imaging data (Fig. 14.6). Patients with a severely abnormal stress PET MPI had almost a fivefold higher hazard of cardiac death compared with patients with a normal PET MPI. Importantly, the PET findings provided significant risk reclassification in 12 % of patients, confirming the clinical utility of PET perfusion imaging. A separate analysis from the same registry demonstrated a proportional relationship between CAD mortality and magnitude of perfusion deficit on stress Rb-82 PET for both men and women [43], as well as obese and nonobese individuals [44]. The confirmation of similar prognostic value regardless of sex is important as PET may offer advantages in the evaluation of women due to improved image quality and sensitivity for detection of obstructive CAD as well as improved safety profile with significantly lower radiation doses than other nuclear medicine techniques.
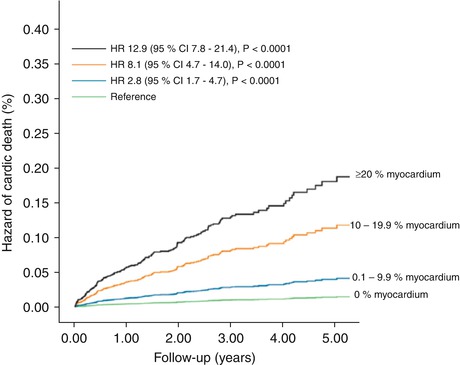
Fig. 14.6
Unadjusted risk of cardiac death by percent myocardium abnormal on vasodilator stress rubidium-82 PET. The risk of cardiac death (6,037 patients, 169 cardiac deaths) was lowest in patients with normal positron-emission tomography (PET) myocardial perfusion imaging (MPI) and increased gradually in patients with minimal, mild, moderate, and severe degrees of scan abnormality (Reproduced with permission from Ref. [42])
Incremental Value of Coronary Flow Reserve
In addition to the diagnostic utility of quantitative measures of myocardial blood flow discussed above, coronary flow reserve is also emerging as a powerful quantitative prognostic imaging marker of clinical cardiovascular risk. As discussed above, CFR provides a robust and reproducible clinical measure of the integrated hemodynamic effects of epicardial CAD, diffuse atherosclerosis, vessel remodeling, and microvascular dysfunction on myocardial tissue perfusion. Consequently, it is a more sensitive measure of myocardial ischemia and overall vascular health that provides unique information about clinical risk. The available data thus far suggests that CFR measurements by PET can distinguish patients at high risk for serious adverse events, including cardiac death [45–48]. Indeed, a severely reduced CFR (<1.5) was associated with a sixfold increased risk of cardiac death, even after adjusting for differences in clinical risk, the extent and severity of ischemia and scar, and LVEF, and led to a clinically meaningful risk reclassification of ~50 % of intermediate-risk patients [45]. Importantly, an abnormal CFR identified increased risk of cardiac death even among those normal scans by semiquantitative visual analysis (Fig. 14.7). These findings are also applicable to high-risk cohorts, including diabetes and chronic renal impairment [49, 50]. For example, a reduced global CFR is independently associated with higher rates of cardiac and all-cause mortality in a large cohort of patients with and without diabetes mellitus. Compared to diabetics with preserved CFR, those with reduced CFR experienced substantially higher cardiac mortality (Fig. 14.8) [49]. Importantly, diabetic patients without known CAD and with impaired CFR experienced a rate of cardiac death comparable to, and possibly higher than, that of nondiabetic patients with known CAD. These observations have implications for the classification of diabetes mellitus as a coronary disease risk equivalent [51]. Specifically, only among diabetics with impaired vascular function is prognosis comparable to nondiabetic patients with known CAD. Thus, differing levels of vascular health among previously studied cohorts may account for inconsistencies in relative mortality rates of diabetics without CAD and nondiabetics with CAD [52–54].
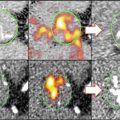
 Molecular Imaging of Macrophages in Atherosclerosis
 Molecular Imaging of Oxidation-Specific Epitopes to Detect High-Risk Atherosclerotic Plaques
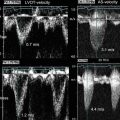 Ultrasound Imaging of Calcific Aortic Valve Disease
 Pathobiology and Optical Molecular Imaging of Calcific Aortic Valve Disease
 Innovations in Microscopic Imaging of Atherosclerosis and Valvular Disease
 PET/CT Imaging of Inflammation and Calcification in CAVD: Clinical Studies


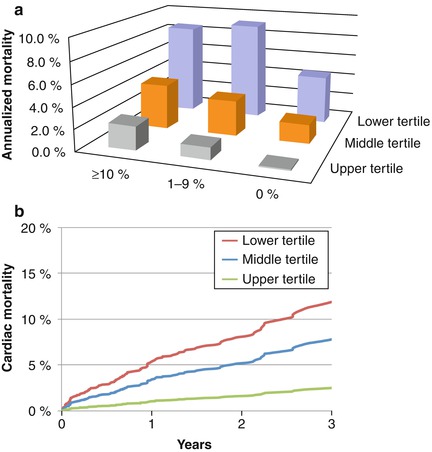
Fig. 14.7
Panel A: Unadjusted annualized cardiac mortality by percent myocardium ischemic and CFR tertiles showing that for each category of ischemia, CFR is able to separate populations at relatively higher and lower risks. Panel B: Incidence of cardiac mortality for tertiles of coronary flow reserve after adjustment for age, sex, BMI, hypertension, dyslipidemia, diabetes mellitus, family history of CAD, tobacco use, prior CAD, chest pain, dyspnea, early revascularization, rest LVEF, summed stress score, and LVEF reserve showing a significant association between CFR and cardiac mortality (Reproduced with permission from Ref. [45])
Related posts:
Molecular Imaging of Macrophages in Atherosclerosis
Molecular Imaging of Oxidation-Specific Epitopes to Detect High-Risk Atherosclerotic Plaques
Ultrasound Imaging of Calcific Aortic Valve Disease
Pathobiology and Optical Molecular Imaging of Calcific Aortic Valve Disease
Innovations in Microscopic Imaging of Atherosclerosis and Valvular Disease
PET/CT Imaging of Inflammation and Calcification in CAVD: Clinical Studies
Stay updated, free articles. Join our Telegram channel
Full access? Get Clinical Tree
