Cardiac transplant recipients require lifelong surveillance for common and life-threatening posttransplant complications such as acute cardiac allograft rejection (ACAR) and coronary allograft vasculopathy (CAV). Imaging plays an important role in such screening initiatives because most posttransplant complications have long subclinical phases and produce nonspecific symptoms as a result of denervation of the transplanted heart. Heart transplant recipients are also at risk for posttransplant lymphoproliferative disease which makes radiation-based imaging tests particularly unappealing.
Cardiovascular magnetic resonance (CMR) is well suited to offer noninvasive and nonirradiating screening for common posttransplant complications, often without the need for contrast. Transthoracic echocardiography (TTE), endomyocardial biopsy (EMB), and invasive x-ray coronary angiography play key roles in current screening for heart transplant complications, although CMR is poised to make an important contribution in this area. Multiparametric CMR is particularly well suited for comprehensive graft surveillance, offering the clinical gold standard evaluation of chamber size and function as well as characterization of myocardial inflammation and perfusion.
This chapter outlines CMR techniques to noninvasively assess acute transplant rejection, CAV, as well as novel and prognostically important adverse remodeling of the cardiac allograft.
Acute Cardiac Allograft Rejection
Background
ACAR is a T-lymphocyte-mediated process, eventually affecting host immune responses to the transplanted heart and causing diffuse myocardial inflammation, myocytolysis, graft dysfunction, and even death. There are extensive pathologic similarities between acute rejection and other forms of inflammatory cardiomyopathies such as viral myocarditis, which are often indistinguishable on histopathology. The incidence of acute rejection is highest in the first year, at approximately 25%, and accounts for 8% of early posttransplant deaths. The current gold standard for the detection and grading of acute rejection is histopathologic assessment of EMB samples. The International Society of Heart and Lung Transplantation (ISHLT) published standardized criteria to grade the severity of rejection : grade 0R, no signs of rejection; grade 1R, mild; grades 2R and 3R, moderate and severe, respectively; and grades 2R and 3R, generally thought to be clinically relevant.
The clinical presentation of acute rejection ranges from asymptomatic to cardiogenic shock and necessitates frequent screening with as many as 13 EMBs in the first year alone. EMB is uncomfortable for heart transplant recipients, can damage the cardiac allograft, and diagnostic accuracy can be adversely affected by sampling error and pathologic expertise. Some reports suggest that 20% of acute rejection episodes have a false-negative EMB and are treated on clinical grounds alone.
CMR has the potential to be a sensitive test to screen for acute rejection, using many of the same sequences that have been helpful in nontransplant inflammatory myopathies.
T2 Cardiovascular Magnetic Resonance Imaging
T2-weighted CMR imaging can demonstrate myocardial edema and has proven utility in assessing a variety of inflammatory cardiomyopathies, including myocarditis, takotsubo cardiomyopathy, and cardiac sarcoidosis. Increased myocardial edema accompanying acute rejection has been recognized since the early 1980s and has been assessed both semiquantitatively, using a signal intensity ratio, and quantitatively, via T2 relaxation times.
Signal Intensity Ratio
Short-inversion time inversion recovery (STIR) techniques use a triple inversion recovery pulse sequence with long echo times (TEs) to produce images in which myocardial signal intensity is proportional to water content. These T2-weighted (T2W) images can be analyzed semiquantitatively by comparing the signal intensity of the myocardium with the signal intensity of skeletal muscle within the field of view. Myocardial edema is present when the myocardial signal intensity is more than twice that of skeletal muscle myocardium. Increased myocardial edema by T2 signal intensity ratio is a key component of the Lake Louise Criteria for myocarditis.
Aherne et al. was one of the first to demonstrate that increased T2 signal intensity in rejecting dog hearts was linearly correlated with ex vivo myocardial water content and could be prevented with the immunosuppressant cyclosporine. Studies of signal intensity ratio in human heart transplant recipients have had mixed results. Krieghoff et al. and Taylor et al. demonstrated that T2 signal intensity ratio increased from 1.7 to 2.1 during clinically significant rejection. Sensitivity and specificity of T2 signal intensity were modest, at 63% and 78%, respectively.
In general, STIR-based T2 signal intensity ratio has not demonstrated sufficient sensitivity in diagnosing ACAR to warrant its use as a stand-alone clinical diagnostic tool to detect rejection.
T2 Relaxation Time
T2-weighted images acquired at multiple echo times allow the fitting of a decay time constant, or T2 relaxation time (ms), that is positively correlated with myocardial water content and can be displayed as a T2 map. T2 relaxation times vary with magnetic field strength and, generally, local calibration is necessary to establish normal reference ranges with elevated T2 defined as greater than mean plus 2 standard deviations (2 SD). T2 relaxation time is the best studied CMR parameter to detect acute heart transplant rejection and, in our opinion, holds the most promise as a noninvasive alternative to endomyocardial biopsy.
Wisenberg et al. first evaluated T2 relaxation time during acute rejection in human heart transplant recipients in the 1980s. They demonstrated that T2 relaxation times were universally increased during the first month following transplantation, presumably because of perioperative edema caused by ischemia reperfusion injury and surgical insults to the cardiac graft. After 24 days, T2 relaxation time had very good agreement with EMB to detect acute rejection, with sensitivity and specificity of 93% and 96%, respectively.
Over the subsequent three decades, Wisenberg’s findings have been generally well validated in animal transplant models and human transplant recipients. Two exceptions gated their T2 acquisition to systole, which probably exacerbated the motion artifact and low image signal that complicates T2 imaging, particularly at lower field strength.
Marie et al. published the largest prospective trial to date evaluating the utility of CMR to diagnose rejection at 0.5 T and found that T2 relaxation times were elevated when significant rejection was present (60 ms vs. 51 ms, P > .0001), with sensitivity of 89% and specificity of 91%.
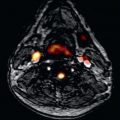
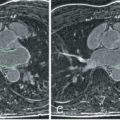
Work from our group confirmed very good accuracy of T2 relaxation time at 1.5 T using a modified half-Fourier acquisition single-shot turbo spin echo (HASTE) sequence, in which we found sensitivity of 88% and a negative predictive value of 95%, to diagnose acute cellular or antibody mediated rejection. Using a more contemporary T2-prepared balanced steady-state free precession (bSSFP) sequence, Usman et al. found increased T2 relaxation times with cellular and antibody-mediated rejection ( Fig. 37.1 ) that subsequently normalized with antirejection therapy.

It is problematic to judge a new diagnostic test when the gold standard test is acknowledged as being imperfect. Biopsy negative rejection has an estimated incidence of between 10% and 20%; thus when there is disagreement between CMR values and biopsy results, it is not always obvious where the misclassification lies. Marie et al. demonstrated that an elevated T2 relaxation time with negative EMB (i.e., false-positive CMR) was much more likely to be diagnosed with EMB-positive rejection in the next 12 weeks. Bonnemains et al. confirmed this in the largest case series published to date, showing that those with intermediate T2 relaxation times had significantly shorter time to the next biopsy-confirmed rejection episode.
It is important to note that published data to date have predominantly enrolled heart transplant recipients more than 1 year from their transplantation. This is clinically relevant, because the incidence of ACAR is highest in the first few months after transplantation and declines steadily thereafter. Miller and colleagues prospectively studied heart transplant recipients during their first 6 months after transplant and found only a borderline association between T2 relaxation time and acute rejection. Their results may in part be explained by the fact that T2 values in participants without rejection were persistently elevated for an extended period of time after transplantation and slowly declined, although not to control levels even at 16 weeks. Mean T2 relaxation time of nonrejecting participants was 59 ms at 6 weeks, 57 ms at 16 weeks, and 56 ms at 20 weeks compared with healthy controls at 54 ms. To put this into context, other trials using contemporary CMR scanners have found nonrejecting T2 relaxation times in the range of 53 to 57 ms and have also shown that heart transplant recipients have systematically higher T2 relaxation time than nontransplant controls.
The work by Miller et al. implies that T2 relaxation times remain elevated because of nonrejection-related causes for longer than the 4 weeks suggested by Wisenberg in the 1980s. This discrepancy in the duration of peritransplant edema between Wisenberg and Miller may be related to their use of widely differing CMR field strength (0.15 vs. 1.5 T), and therefore sensitivity to detect edema as well as significant differences in immunosuppression regimens between the 1980s and contemporary practice. Interpretation of the Miller study is further complicated by the inclusion of two heart transplant recipients with primary graft failure in whom T2 relaxation times were persistently elevated despite normal EMB histology.
T2 relaxation times show very good agreement with EMB for detecting acute rejection, and may be able to prognosticate those at risk of impending rejection. There remains uncertainty as to the specificity of T2 relaxation for acute rejection in the early posttransplant period. There is also uncertainty regarding utility of T2 relaxation time when measured at 3 T. However, we are reassured by the consistent association between T2 and acute rejection across the spectrum of platforms and CMR field strengths.
T1 Quantification
T1 is the longitudinal relaxation time constant of the myocardium and is influenced by molecular changes in the myocardium, including tissue edema and pathologic expansion of the extracellular space. Native T1 mapping has been shown to outperform T2 signal intensity ratio in the diagnosis of acute myocarditis. Increased T1 relaxation time correlates to inflammatory infiltrates in animal models of rejection.
Native T1 relaxation time has not been as extensively studied as T2 relaxation time, but has been shown to increase with acute rejection in animal transplant models and human heart transplant recipients. Miller et al. used a modified Look-Locker inversion recovery (MOLLI) sequence at 1.5 T to evaluate T1 maps in the early posttransplant period and found that native T1 values decline significantly between 6 weeks and 20 weeks (1063 ± 40 vs. 1109 ± 53 ms, P = < .001) in nonrejecting heart transplants. In this cohort only a trend toward decreased native myocardial T1 values was found with rejection. In contrast, Reinhardt and Gutberlet found good diagnostic accuracy of native T1 values to detect ACAR with an area under the curve of 0.78.
Native T1 mapping sequences are sensitive to water and have the potential to detect the presence of acute rejection, although more validation is needed. As with T2 mapping, the relationship between native T1 mapping and acute rejection in the early posttransplant period may be confounded by perioperative edema, and requires further clarification.
Morphology and Function
The diffuse myocardial inflammation and attendant edema of acute rejection can produce increased myocardial wall thickness. CMR could detect changes in myocardial wall thickness with acute rejection but was not able to discriminate different rejection grades. In general, changes in wall thickness are too insensitive to be useful in diagnosing ACAR.
Left ventricular ejection fraction (LVEF) is frequently within normal range during even moderate severity rejection episodes (2R). Thus LVEF even by highly accurate CMR cannot reliably detect grade 2R rejection and therefore is not a suitable metric for rejection screening. Serial LVEF evaluations to monitor for unexplained reductions in systolic function may be a useful adjunct for the detection of rejection, but this has not been formally tested.
A reduction in LV torsion has been correlated to acute rejection and precedes overt systolic dysfunction. Miller et al. used myocardial tagging to show that myocardial strain and torsion were stable over the first 6 months posttransplant, and reduction in peak systolic circumferential strain was significantly associated with acute rejection.
Diastolic function has been identified as an early sign of acute rejection that precedes systolic dysfunction in animal models ; however, its utility in echocardiography surveillance studies is highly variable, and it is poorly studied in CMR.
Changes in right ventricular (RV) morphology and function during acute rejection have not been well studied. Work by our group found that RV ejection fraction (RVEF) and RV end-diastolic volume index (RVEDVi) were both abnormal during rejection. In multivariable analysis, RVEDVi was independently predictive of acute rejection (89 mL/m 2 vs. 71 mL/m 2 , P = .0001). We have postulated that the thinner-walled right ventricle may demonstrate dysfunction related to acute rejection earlier, or in a more pronounced way, than the thicker LV wall. The relationship between RV volume and acute rejection is intriguing, but requires further validation.
LV morphology and function are generally not sufficiently sensitive for the more subtle, although still clinically significant, acute rejection episodes seen on contemporary immunosuppression. RV volume as a potential marker of acute rejection warrants further investigation.
T1 Contrast Imaging
Early Contrast Enhancement
Intravenous administration of gadolinium (Gd) contrast increases myocardial signal intensity on early T1-weighted imaging that is proportional to myocardial blood flow. Comparison of precontrast myocardial signal intensity with myocardial signal intensity early following Gd contrast injection generates a relative contrast enhancement ratio that is believed to reflect the hyperemia during acute inflammation. A 4-fold increase in myocardial signal intensity has shown to be associated with myocardial inflammation and is a component of the Lake Louise Criteria for the diagnosis of myocarditis.
Early work in animal models suggested that early enhancement increased with rejection and could identify different grades of rejection. Relative enhancement has demonstrated inconsistent association with rejection in human heart transplant rejection. Mousseaux et al. showed that the relative enhancement increased in rejection compared with nonrejection, but could not discriminate between grades of rejection.
Taylor et al. assessed early enhancement using a free breathing spin echo sequence and found a significant increase in those with significant rejection compared with controls (ratio 4.1 vs. 2.8, P = .01) that resolved with rejection treatment (4.1 vs. 2.9, P < .05). Relative enhancement was also increased in heart transplant recipients with EMB-negative rejection (8.7 vs. 2.8, P = .02). The sensitivity and specificity of early enhancement to detect significant rejection was 82% and 79%, when using an enhancement ratio cutoff of 3.5. Krieghoff et al. found more modest accuracy of early enhancement to detect ACAR with sensitivity and specificity of 63% and 70%, respectively.
The role of early enhancement in diagnosing acute transplant rejection is limited by its inconsistent and moderate diagnostic accuracy. In addition, serial screening for rejection with techniques that use contrast add cost and risk of nephrogenic systemic fibrosis (NSF), which is of particular relevance for heart transplant recipients with high rates of chronic renal insufficiency (see Chapter 3 ). Long-term retention of Gd has also been described in patients with normal renal function and reminds us to be judicious in our use of Gd.
Late Gadolinium Enhancement
Regional myocardial fibrosis can be visualized using T1-weighted phase-sensitive inversion recovery (PSIR) images 6 to 15 minutes (i.e., “late”) after gadolinium contrast administration. Late gadolinium enhancement (LGE) is generally characterized as “infarct typical” when it is transmural or subendocardial based, and “infarct atypical” when it is located in the midwall or subepicardium. LGE has clinical utility in the diagnosis of inflammatory myopathies: specifically, the presence of LGE is a diagnostic criterion for acute myocarditis (Lake Louise Criteria, Ferreira), and the absence of LGE is characteristic of takotsubo cardiomyopathy.
Heart transplant recipients have a high prevalence of LGE, although the presence of LGE does not correlate to the biopsy-proven acute rejection. Taylor et al. found a correlation between the presence of LGE and heart transplant recipients with “presumed rejection” (defined in this study as “an unexplained drop in LVEF of at least 20% in whom EMB is negative or not practical to obtain because of clinical instability”). These cases of presumed rejection probably included instances of antibody-mediated rejection, an important source of acute rejection generally poorly characterized in the CMR literature.
LGE has not been shown to accurately identify biopsy-proven acute rejection and as a contrast technique is not particularly well suited for frequent serial screening of heart transplant recipients.
Coronary Allograft Vasculopathy
Heart transplant recipients commonly develop a diffuse form of arteriopathy, termed coronary allograft vasculopathy, that is an important cause of late graft loss and mortality. One in five heart transplant recipients have observable CAV at 1 year post transplant, increasing to one-half by 10 years posttransplant. CAV typically produces no symptoms until it is severe, at which time it commonly presents as arrhythmia, sudden cardiac death, or heart failure. CAV affects both the epicardial arteries and the microvasculature, both of which independently confer a worse prognosis.
Guidelines recommend screening for CAV with invasive x-ray coronary angiography or intravascular ultrasound (IVUS) to detect early allograft vasculopathy and apply the, albeit limited, therapies shown to reduce allograft vasculopathy progression. IVUS has superior sensitivity to detect CAV over x-ray angiography; however, its use is limited by expense and the need for specialized expertise. Coronary angiography with contrast-enhanced computed tomography (CT) showed good sensitivity to detect CAV ; however, its use is limited by radiation doses and the need for iodinated contrast. CMR coronary angiography does not have sufficient spatial resolution to sensitively rule out early coronary allograft vasculopathy, although coronary gadolinium enhancement is a novel marker that may be useful to screen for CAV.
All forms of coronary angiography, as well as IVUS, exclusively evaluate the epicardial vessels and offer no practical insight into the presence of CAV in the microvasculature. Assessing myocardial perfusion has the advantage of being able to evaluate the presence of allograft vasculopathy in both the epicardial and microvascular compartments. Nuclear perfusion modalities are disadvantaged compared with CMR by their need for radiation exposure.
CMR perfusion is used routinely in clinical practice with excellent diagnostic accuracy and prognostic value in patients with suspected coronary artery disease. CMR-derived myocardial perfusion reserve (MPR) has shown particular utility in diagnosing CAV. MPR is a contrast-enhanced technique that compares contrast-enhanced myocardial perfusion during hyperemia and at rest. Meuhling et al. were among the first to show that reduced MPR was associated with CAV severity, and an MPR >2.3 could dichotomously exclude CAV with a sensitivity and specificity of 100% and 85%, respectively.
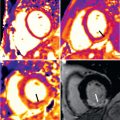
Exemplary work by Miller et al. compared the diagnostic accuracy of CMR-derived MPR to detect CAV against invasive CAV assessment in 48 heart transplant recipients. Multivariable analysis found that MPR was the only variable that independently predicted CAV in both the epicardial and microvascular compartments. An MPR of >1.94 had a sensitivity of 88% and specificity of 85%, respectively, to detect moderate allograft vasculopathy and outperformed invasive x-ray angiography, fractional flow reserve, and invasively measured index of microvascular resistance ( Fig. 37.2 ).

Related posts:
 Use of Navigator Echoes in Cardiovascular Magnetic Resonance and Factors Affecting Their Implementation
 Clinical Cardiovascular Magnetic Resonance Imaging Techniques
 Atherosclerotic Plaque Imaging: Aorta and Carotid
 T1 and T2 Mapping and Extracellular Volume in Cardiomyopathy
 Pulmonary Vein and Left Atrial Imaging
 Noncardiac Pathology
Stay updated, free articles. Join our Telegram channel

Full access? Get Clinical Tree


