Dipan J. Shah, MD
THE ATRIOVENTRICULAR VALVES
INTRODUCTION
The assessment of valvular heart disease using cardiac magnetic resonance (CMR) has become an excellent alternative to other imaging modalities; in some cases, it may be the first line imaging test to best answer a given clinical question. Whereas echocardiography (ECHO) is the gold standard in the valvular heart disease assessment, it can be limited by issues of inadequate imaging windows, inherent problems with the technique of Doppler, and underestimation of eccentric jets and ventricular volumes due to geometric assumptions. CMR has literally an infinite number of imaging planes in which it can interrogate, with no limitation from body habitus or lung disease. Furthermore, CMR also is the gold standard for cardiac volumetric assessment.
A complete assessment of valve pathology must include a detailed evaluation of valve anatomy, flow velocity and volume, and corresponding ventricular size and function.1 There are several specific sequences used in CMR, which when used together can provide a thorough assessment of any particular valve and its subsequent effect on ventricular chambers and function.2
Steady-state free precession (SSFP) imaging is the most commonly used CMR sequence for assessment of cardiac anatomy and motion. This particular sequence has a very high signal-noise ratio (SNR) and excellent blood-to-myocardium contrast. SSFP allows for very short repetition times, therefore it is able to generate cine images with high-spatial resolution (in-plane resolution of 1.5-2.0 mm) and high-temporal resolution (25-50 frames per second) within a 5- to 8-second breath-hold.
SSFP imaging can also be used to detect flow turbulence and disturbance. In general, increased signal in CMR occurs when protons are “in-phase” with each other—spinning together in the same direction. This phenomenon occurs due to particular magnetic gradients that are applied to the patient during a particular imaging sequence. High-velocity flow, however, produces turbulence and causes protons in the blood to spin randomly in relation to their neighboring protons—they become “de-phased”. When protons are out of phase they do not produce signal, causing a “signal-void” which appears as a dark jet in the case of valvular stenosis or insufficiency. Although this signal-void is not sufficient for quantitating severity, it can provide the localization for velocity mapping.
Phase-contrast imaging is a unique sequence that provides velocity measurements by assessing the accumulated phase of moving protons. In this particular sequence, a certain magnetic gradient is applied to an imaging slice of interest. The gradient is then completely reversed. Stationary objects (protons) will experience no net change in their phase however, moving protons will gain a net phase shift proportional to their velocity. The net phase can be represented as a phase map, with different intensities representing different velocities. Velocity mapping produces 2 sets of images: (1) a magnitude image; and (2) a phase velocity map. The magnitude image provides an anatomic reference to the phase velocity map, allowing identification, for instance, of blood vessels in which flow is being measured.
Determining the velocity across a given valve is also possible using PC imaging. An “in-plane” view of a valve is obtained using a PC sequence in which a particular phase direction is assigned (anterior-posterior, right-left, or head-foot). This direction (which is set by the operator) has opposing directions assigned black or white. Next, a maximal velocity (cm/s) is set for the image, known as the velocity encoding maximum (VENC). After a given flow direction has been identified on an in-plane view, a “through-plane”, or perpendicular view of that flow, is obtained. It is the “through-plane” view in which quantitation of flow is performed.
It may be recollected that the degree of phase shift of a given proton is directly related to its velocity. However, if the phase shift exceeds 180 degrees, it is not possible to differentiate the exact phase shift and thus the exact velocity. For example, a phase shift of 270 degrees cannot be differentiated from a phase shift of 90 degrees through the given imaging plane; however, there is a difference in the velocity of 2 protons with a phase shift of 90 vs 270 degrees. This phenomenon manifests as “aliasing” on the image, appearing as a mixture of dark-black and bright-white pixilation. The problem can be rectified by increasing the VENC, which corrects for the aliasing and allows for a more accurate assessment of the true phase shift and velocity. The VENC at which aliasing disappears is the maximal true velocity through the given imaging plane.
Once the true maximal velocity is obtained, the peak gradient is calculated using the simplified Bernoulli equation (4 V 2, where V is the maximal velocity). These measurements have been compared to flow phantoms,3 accurately measuring velocities over 5 m/s. Furthermore, tracing a particular region of interest (ROI) and obtaining an area (cm2) which can be multiplied by the velocity (cm/s) of each pixel within that ROI can provide an instantaneous volume (cm3/s). The volume can then be plotted over the cardiac cycle and provide a graphic representation of both forward and reverse flow across a particular valve.
Mitral and tricuspid valve evaluation using CMR can be divided into anatomic and physiologic assessment, the latter including both regurgitation and stenosis. Using SSFP cine imaging sequences, overall valve anatomy and motion can be thoroughly evaluated. Phase-contrast imaging allows for flow quantification and peak velocity assessment across a given valve. Ventricular volumes are obtained from contiguous SSFP cine short-axis images, yielding total right and left ventricular (LV) stroke volumes.
In order to calculate mitral regurgitant volume (RV), the forward stroke volume across the aortic valve obtained from PC imaging is compared to the LV stroke volume obtained from SSFP short-axis cine tracings. The LV stroke volume by short-axis cines equals true “systemic” stroke volume + mitral RV+ aortic RV (if present). The aortic forward stroke volume represents the true “systemic” stroke volume + aortic insufficiency (if present). Thus, the difference of the LV stroke volume and aortic stroke volume will equal the mitral RV. This method is accurate despite the presence of aortic insufficiency because that RV is present in both LV stroke volume and aortic stroke volume.
Although, the method of using LV stroke volume and aortic stroke volume is the most validated and widely used to quantitate mitral regurgitation (MR), there are many factors that can cause the images to be corrupted and possibly inaccurate. CMR allows for multiple other parameters to “cross-check” the final quantitated volume. For example, in the absence of pulmonic insufficiency or intracardiac shunts, the aortic and pulmonic stroke volumes should be similar. Mitral valve diastolic inflow can be used to corroborate LV stroke volume in the absence of aortic insufficiency. Analogous methodology is applied to assess tricuspid insufficiency.2
THE MITRAL VALVE
CASE 1 Ischemic Mitral Regurgitation
A 65-year-old obese man with inferior wall myocardial infarction 1 year ago presented with shortness of breath at rest. A transthoracic echocardiogram (TTE) was performed that demonstrated preserved LV function with MR; however, quantitation was suboptimal due to poor acoustic windows. He was referred for CMR to better assess severity and define the mechanism of MR.
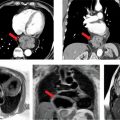
SSFP cine imaging and late gadolinium enhancement imaging (LGE) in standard 3-chamber (3 CH), vertical long-axis, and short-axis planes demonstrated severe hypokinesis of the inferior and inferolateral walls with associated hyperenhancement, consistent with inferior wall scar (Figures 7A-1 through 7A-3, and Videos 7A-1 through 7A-4). Mitral regurgitation cine due to a restricted posterior mitral leaflet can be appreciated as a signal-void on the 3-CH cine.
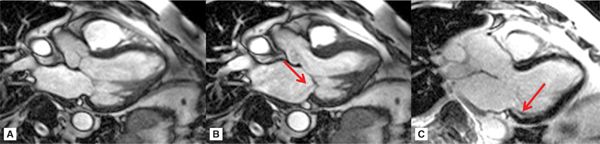
FIGURE 7A-1 Three-chamber cine frames at (A) end-diastole (ED) and (B) end-systole (ES) show lack of significant wall thickening in the basal inferolateral wall with restricted posterior mitral valve leaflet. Also note the signal-void in the LA representing the mitral insufficiency (arrow). Late gadolinium enhancement (LGE) image in the same plane shows subendocardial infarct scar in the basal inferolateral wall (C, arrow).
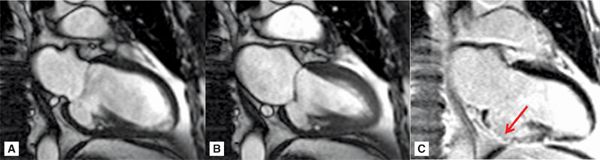
FIGURE 7A-2 Vertical long-axis cine frames at (A) ED and (B) ES, show lack of significant wall thickening in the basal inferior wall with restriction of the posterior mitral valve (MV) leaflet. LGE image (C) shows near-transmural infarct scar in the inferior wall (arrow).
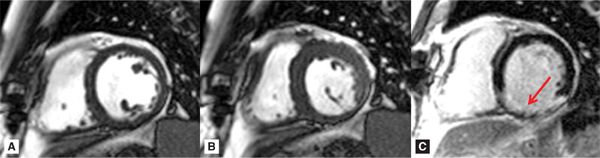
FIGURE 7A-3 Short-axis cine frames at ED (A) and ES (B) show lack of significant wall thickening in the basal inferior and inferolateral walls. LGE image (C) shows infarct scar involving the inferior and inferolateral walls (arrow).
Quantitation of the MR was done by comparing forward flow across the mitral valve (MV) (Figure 7A-4) to systemic flow through the aorta and pulmonary artery. These flows were further corroborated against stroke volumes of the left and right ventricles computed from contiguous short-axis SSFP cines. In this case, CMR defined the severity of MR as mild (regurgitant fraction [RF] 10%),4 eliminating significant MR as the cause of the patient’s dyspnea at rest.
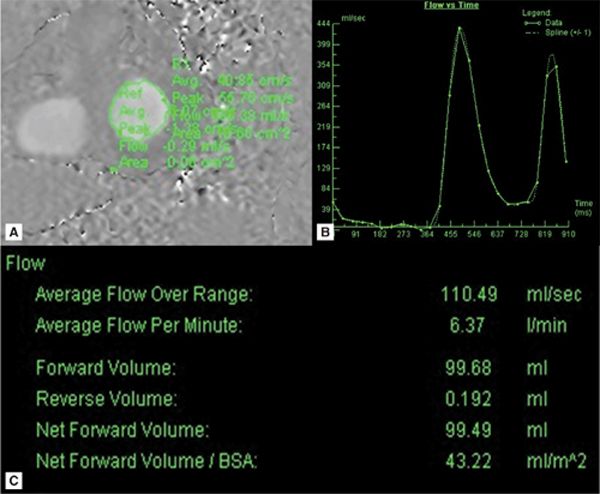
FIGURE 7A-4 (A) Diastole frame from a velocity-encoded (VENC) cine acquisition at level of MV is shown with a region of interest (ROI) encircling mitral valve inflow. (B) Postprocessing software allows for display of flow through the ROI as a function of time or cine frame. (C) Quantification of the area under the curve yields volume of blood flow across the MV.
CASE 2 Mitral Regurgitation Due to Systolic Anterior Motion of the Mitral Valve in Hypertrophic Cardiomyopathy
A 44-year-old man with hypertrophic cardiomyopathy (HCM) presented with progressive dyspnea. CMR was ordered for further assessment of cardiomyopathy as well as to quantify the degree of MR.
An SSFP 3-CH view (Figure 7A-5 and Video 7A-5) demonstrated normal LV systolic function but with evidence of systolic flow acceleration in the left ventricular outflow tract (LVOT) as well as systolic anterior motion (SAM) of the MV, which in turn, produced posteriorly-directed MR.
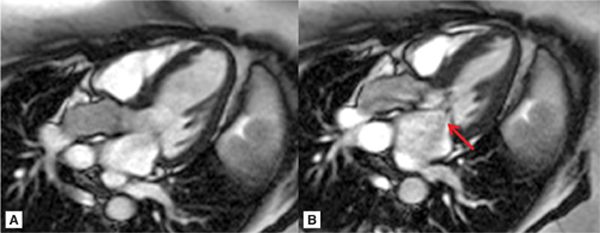
FIGURE 7A-5 (A) Steady-state free precession (SSFP) 3-chamber (CH) ED; (B) SSFP 3-CH mid-systole (MS), showing systolic anterior motion (SAM) of the anterior leaflet of MV (note signal-void which represents mitral insufficiency, arrow).
The MR is more clearly demonstrated with in-plane VENC cine imaging acquired in the same 3-CH plane (Figure 7A-6, and Videos 7A-5 and 7A-6). In this type of acquisition, the MR jet is evident as an eccentric signal-void that runs along the posterolateral LA wall. “through-plane” VENC cine imaging allowed quantification of the severity of MR, yielding a RV of 24 mL and RF of 24% consistent with mild to moderate MR.4
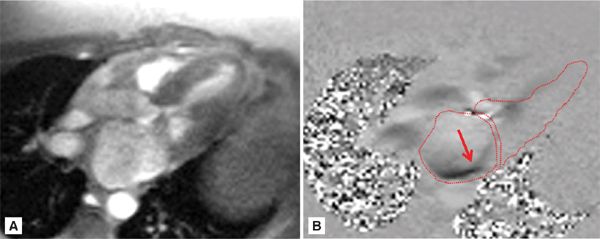
FIGURE 7A-6 (A) Magnitude re-phase image of 3-CH view during mid-systole (MS) and (B) its corresponding phase-contrast (PC) view showing posteriorly directed mitral insufficiency jet (arrow). The left ventricle (LV), left atrium (LA), and left ventricular outflow tract (LVOT) are traced.
Based on CMR findings and room for titration of medical therapy, the patient’s beta-blocker dose was increased with subsequent improvement of his symptoms.5
CASE 3 Functional Mitral Regurgitation
A 57-year-old woman presented with new-onset heart failure symptoms and initial work-up revealed depressed LV systolic function with a dilated LV. Mitral regurgitation was also noted on the initial ECHO; however, quantification was difficult due to poor acoustic windows from a large body habitus. CMR was ordered to further characterize the cardiomyopathy as well as quantify the MR.
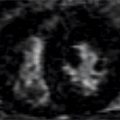
SSFP cine imaging (Figure 7A-7, and Videos 7A-7 and 7A-8) demonstrated a dilated LV and severely depressed LV systolic function. Poor mitral leaflet coaptation, due to the dilated mitral annulus, can be appreciated. This poor coaptation results in a central jet of functional MR. On PC imaging (Figure 7A-8, and Videos 7A-9 and 7A-10), the regurgitant jet is well seen on the en face view as a black jet during systole. Using postprocessing software to measure LV stroke volume by SSFP cine imaging and forward aortic stroke volume by VENC cine imaging, the RV was 26 mL with a RF of 47%, consistent with moderate to severe MR.
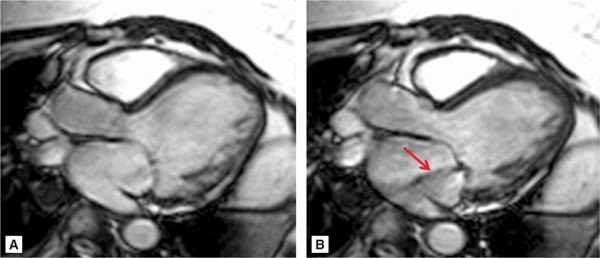
FIGURE 7A-7 SSFP 3-CH cine at ED (A) and MS (B) demonstrates a dilated mitral annulus with poor coaptation of the mitral leaflets resulting in central mitral insufficiency (arrow).
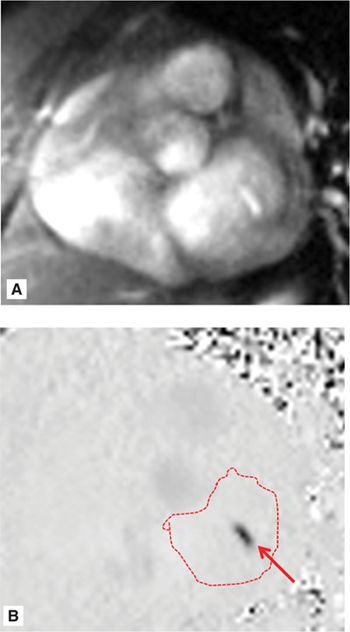
FIGURE 7A-8 Magnitude (A) and corresponding VENC (B) images acquired in an en face view of the MV during MS show functional mitral regurgitation (MR) (arrow); the LA is traced.
Delayed enhancement images did not show presence of scar; thus, idiopathic nonischemic cardiomyopathy was diagnosed. Cardiac catheterization confirmed absence of coronary artery disease (CAD). The patient was initiated on standard heart failure medications and diuresis improved dyspnea.6 Follow-up ECHO after medication optimization and symptom improvement showed reduction in LV volumes and improvement in severity of functional MR.
CASE 4 Eccentric Mitral Regurgitation With a Flail Leaflet
A 45-year-old woman with history of MV prolapse presented with worsening dyspnea on exertion (DOE). A TTE demonstrated a dilated LV with preserved systolic function; however, the MR was unimpressive by color Doppler. As the patient was clinically felt to have more significant MR, CMR was obtained to better quantify the severity of the valvular lesion and further determine its mechanism.
Representative 3-CH and short-axis views of the MV in end-diastole and end-systole are shown in Figures 7A-9 and 7A-10 (also see Video 7A-11). Figure 7A-9 shows clear malcoaptation of the mitral leaflet tips, with a flail posterior leaflet tip pointing into the LA. The en face view of the MV during end-systole in Figure 7A-10B shows a dense structure along the middle of the posterior leaflet, representing the flail component. This finding is much better appreciated in the cine view (Video 7A-12).
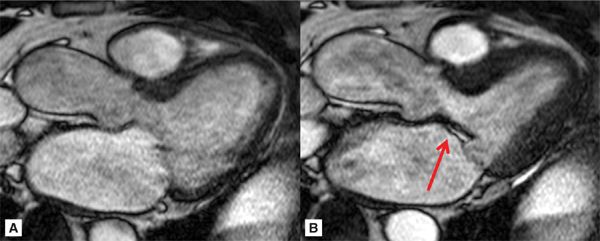
FIGURE 7A-9 Ed (left) and ES (right) frames of a 3-CH SSFP cine are shown in a patient with the lack of coaptation of the anterior and posterior MV leaflet due to flail posterior MV leaflet (arrow).
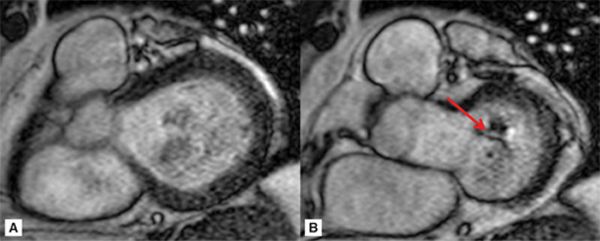
FIGURE 7A-10 ED (left) and MS (right) frames from a basal short-axis SSFP cine show a flail P2 segment of the posterior leaflet (arrow).
Phase-contrast imaging in the 3-CH view (Figure 7A-11) reveals a very eccentric mitral regurgitation jet extending to the posterior wall of the LA. After quantitation, the RV volume was calculated at 68 mL with a RF of 50%, consistent with severe MR.
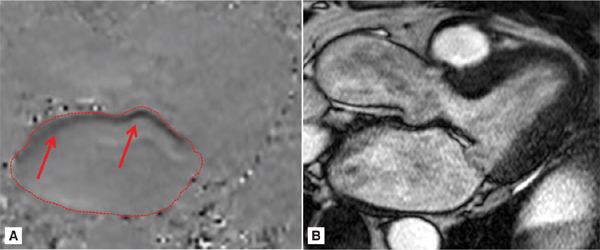
FIGURE 7A-11 (A) MS frame of the PC cine and (B) its corresponding magnitude image are shown in a patient with eccentric MR (red arrows) extending to the posterior LA. Region of interest on the PCI delineates the LA.
Given CMR demonstration of severe MR and clinical symptoms consistent with severe MR, the patient was referred to surgery for MV repair1 and postoperatively symptoms improved.
CASE 5 Rheumatic Mitral Stenosis
A 48-year-old Hispanic woman who had never been seen by a physician before presented with shortness of breath worsening over several months. Initial TTE demonstrated severe rheumatic mitral stenosis with mild to moderate MR. As the patient was being evaluated for possible balloon mitral valvuloplasty, accurate assessment of the MR was critical since more than mild MR precludes this therapeutic approach.7 Also, due to frequent arrhythmias and suboptimal ECHO windows, accurate assessment of the anatomic orifice area was difficult. Thus, the patient was referred to the CMR laboratory for planimetry of the MV and further quantitation of the MR.
Figure 7A-12 and Video 7A-13 demonstrate the classic “hockey stick” deformity of rheumatic mitral stenosis. The leaflet tips are heavily calcified and thickened. The still frame in mid-diastole demonstrates relatively immobile leaflet tips and commissural fusion. A short-axis view of the mitral leaflet tips (Figure 7A-13A and Video 7A-14A) allows for planimetry of the anatomic orifice area which was quantified at 0.4 cm2.
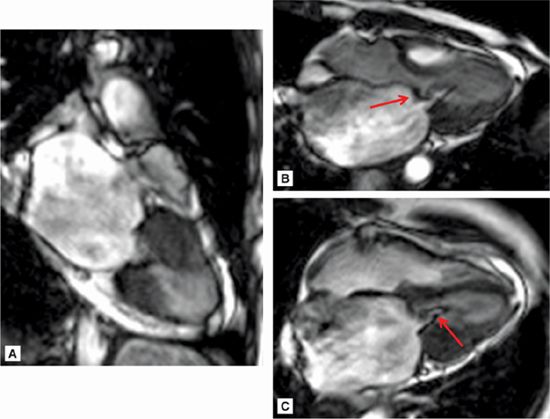
FIGURE 7A-12 (A) SSFP vertical long-axis view in mid-diastole (MD) shows thickened and calcified mitral leaflets. (B) SSFP 3-chamber view in middiastole, again shows thickened and calcified mitral leaflets with the classic “hockey stick” deformity of rheumatic mitral stenosis (arrow). (C) SSFP horizontal long-axis view in MD demonstrates thickened/calcified mitral leaflet tips with flow acceleration suggesting high-velocity flow (arrow).
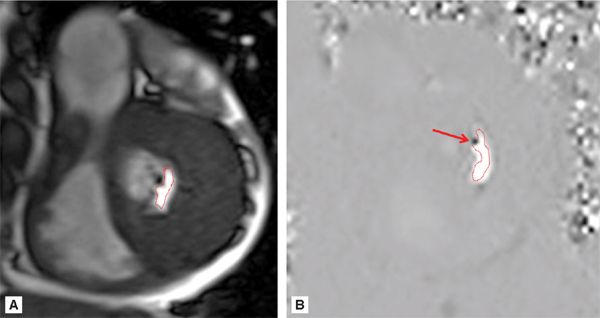
FIGURE 7A-13 (A) SSFP short-axis at mitral leaflet tips in MD shows a very small anatomic orifice area (traced in red, planimetered valve was 0.4 cm2). (B) Phase-contrast image at same location during MD with a VENC of 200 cm/s shows a small amount of aliasing (arrow) during diastolic inflow suggesting a peak velocity higher than 200 cm/s. The aliasing was no longer present at 225 cm/s, indicating a peak velocity in between 200 and 225 cm/s. In both images, the anatomic orifice area is traced in red.
Phase-contrast imaging at the leaflet tips can be used for assessing peak velocity. In the image shown (Figure 7A-13B and Video 7A-14B), the VENC maximum setting was 200 cm/s. The arrow shows a small area of aliasing, which suggests the peak velocity was higher than 200 cm/s. This area was no longer present when the VENC was adjusted to 225 cm/s, which indicates a peak velocity between 200 and 225 cm/s.
Quantitation of the MR revealed a RF of 31%, consistent with moderate MR.4 Due to significant mitral regurgitation, percutaneous mitral balloon valvuloplasty (PMV) was not performed and the patient was referred instead for MV replacement.
It is important to note the quality of the segmented, breath-hold cine images in this case is suboptimal due to significant R-R variability from the patient’s atrial fibrillation with the use of this technique. Real-time cine and flow quantification should be used instead in patients with irregular rhythms or difficulty with breath-holding to avoid such impairment of image quality.
CASE 6 Rheumatic Mitral Stenosis With Left Atrial Appendage Thrombus
A 59-year-old Asian man with a history of childhood rheumatic fever and prior aortic valve replacement presents for worsening heart failure symptoms. Transthoracic echocardiogram was suboptimal due to artifact from the aortic prosthesis; thus, he was referred to the CMR laboratory for further evaluation.
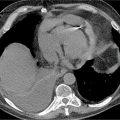
Figures 7A-14 and 7A-15 and Videos 7A-15 through 7A-17 show the 3-CH, horizontal long-axis and short-axis views of the MV. Note the dilated LA, and thickened and calcified mitral leaflets, which is more pronounced at the leaflet tips. Figure 7A-14A also shows significant flow acceleration at the leaflet tips indicative of a high-velocity flow. The short-axis view allowed for direct planimetry, yielding a MV area of 0.9 cm2 that indicated severe (valve area <1.0 cm2) mitral stenosis (Figure 7A-15). LGE imaging (Figure 7A-16) revealed a large LA appendage thrombus.
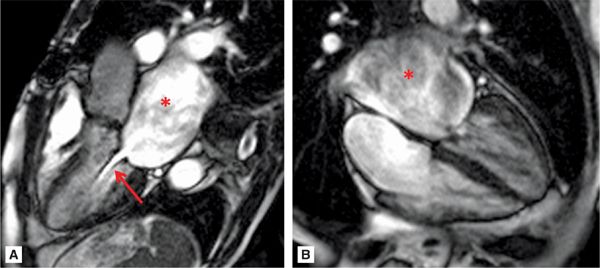
FIGURE 7A-14 (A) SSFP 3-CH view in MD shows severe LA dilatation (asterisk). There is flow acceleration (arrow) across the thickened and calcified mitral leaflets. (B) SSFP horizontal long-axis view in MD also demonstrates a dilated LA (asterisk) and thickened and calcified mitral leaflets.
Related posts:
Stay updated, free articles. Join our Telegram channel

Full access? Get Clinical Tree


