A number of noninvasive cardiac diagnostic imaging studies are available to the cardiologist, which include echocardiography, computed tomography (CT), CT angiography, and magnetic resonance imaging. The continuing value of cardiac nuclear scintigraphic studies is that they are noninvasive, contrast media is not required, and they accurately portray a wide range of physiological and metabolic parameters that predict prognosis and risk. Single-photon emission computed tomography (SPECT) and single-photon emission computed tomography with computed tomography (SPECT/CT) have become the predominant imaging modalities ( Fig. 16.1 ). Positron emission tomography with computed tomography (PET/CT) is growing in clinical use, whereas multigated acquisition (MUGA) has an important but reduced clinical role today.

Myocardial Perfusion Scintigraphy
The underlying physiological principles that make myocardial perfusion imaging an important diagnostic tool remain unchanged. Myocardial perfusion scintigraphy depicts the following sequential physiological events. The radiopharmaceutical must first be delivered to the myocardium. Then viable metabolically active myocardial cells must be available to extract the radiotracer. Finally, a significant amount of the radiopharmaceutical must remain within the cells to allow for imaging. The scintigraphic images are a map of regional myocardial perfusion. If a patient has reduced regional perfusion as a result of hemodynamically significant coronary artery disease (CAD) or a loss of cell viability as a result of myocardial infarction (MI), a perfusion defect or cold region is seen on the images. All diagnostic patterns in the many diverse applications follow from these observations.
Single-Photon Radiopharmaceuticals for Myocardial Scintigraphy
Radiopharmaceuticals
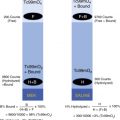
Both Tc-99m sestamibi and Tc-99m tetrofosmin are routinely used today for cardiac perfusion imaging. They have relatively minor differences ( Table 16.1 ). Thallium-201 was the original perfusion agent used before the introduction of the technetium agents, but it is now reserved for special situations, as described in the following subsection.
| Physiology | Thallium-201 | Tc-99m Sestamibi | Tc-99m Tetrofosmin |
|---|---|---|---|
| Chemical class/charge | Elemental cation | Isonitrile cation | Diphosphine cation |
| Mechanism of uptake | Active transport Na/K ATPase pump | Passive diffusion, negative electrical potential | Passive diffusion, negative electrical potential |
| Myocyte localization | Cytosol | Mitochondria | Mitochondria |
| Intracellular state | Free | Bound | Bound |
| Preparation | Cyclotron | Generator/kit | Generator/kit |
| First-pass extraction fraction | 85% | 60% | 50% |
| Percent cardiac uptake | 3% | 1.5% | 1.2% |
| Myocardial clearance | 4-hr T ½ | Minimal | Minimal |
| Body clearance | Renal | Hepatic | Hepatic |
| Imaging time after injection | |||
| Stress | 10 min | 15–30 min | 5–15 min |
| Rest | 3–4 hr | 30–90 min | 30 min |
Tc-99m Sestamibi (Cardiolite)
Tc-99m sestamibi (Cardiolite) was approved by the U.S. Food and Drug Administration (FDA) for cardiac imaging in 1990. Generic Tc-99m sestamibi became available in 2008. Sestamibi is a lipophilic cation and member of the chemical isonitrile family ( Fig. 16.2A ). After intravenous injection, Tc-99m sestamibi distributes in the heart in proportion to myocardial blood flow and passively diffuses into the myocardial cell because of its lipid solubility. The positively charged lipophilic molecule is attracted to the negatively charged mitochondria, where it is retained. Extraction is proportional to coronary blood flow, although it is underestimated at high flow rates and overestimated at low flow rates. This is true of all the perfusion agents ( Fig. 16.3 ) . Myocardial uptake is prompt, and the ratio of myocardium to background activity improves as the lungs clear. Blood clearance is rapid due to renal, biliary, and intestinal excretion. Radiotracer remains fixed within the myocardium, providing an imaging time window of several hours. Image acquisition begins 45 to 60 minutes after tracer administration for resting studies and as early as 30 minutes for exercise stress studies due to its more rapid background clearance.


Tc-99m Tetrofosmin (Myoview)
Tc-99m tetrofosmin (Myoview) was approved by the FDA for cardiac imaging in 1996. It is a member of the diphosphine chemical class (see Fig. 16.2B ). Similar to sestamibi, tetrofosmin is a lipophilic cation that localizes near mitochondria in the myocardial cell and remains fixed there. After intravenous injection, it clears rapidly from the blood, and myocardial uptake is prompt. Extraction is proportional to blood flow, although it is underestimated at high flow rates (see Fig. 16.3 ). Minor differences compared with Tc-99m sestamibi are described (see Table 16.1 ). The heart-to-lung and heart-to-liver ratios improve with time due to clearance via the liver and kidneys. The heart-to-liver ratios are higher for tetrofosmin than sestamibi because of faster hepatic clearance, allowing for earlier imaging. After exercise stress, imaging at 15 minutes is feasible; rest studies can be started at 30 minutes.
Thallium-201 Chloride (Tl-201)
The radionuclide Tl-201 is cyclotron-produced. It decays by electron capture to its stable mercury-201 daughter, with a physical half-life of 73 hours. The emitted photons available for imaging are mostly mercury K-characteristic x-rays ranging from 69 to 83 keV (95% abundant) and some gamma rays of 167 keV (10%) and 135 keV (3%). For imaging, a 30% camera window is set for the 69- to 83-keV x-ray emissions and a 20% window at 167 keV. After intravenous injection, Tl-201 blood clearance is rapid ( Fig. 16.4 ). It behaves similar to K + and is transported across the myocardial cell membrane by the Na + /K + ATPase pump. First-pass extraction and percent uptake are higher than for Tc-99m sestamibi or tetrofosmin (see Table 16.1 ). However, it is not ideal for gamma camera imaging, especially for large patients, because its mercury x-ray emissions have relatively low photoenergies and not a single energy photopeak, Compton scatter is high, and the administered dose (3.0 mCi) is low because of poor dosimetry (see the Appendix).

Scintigraphic images after initial uptake reflect capillary myocardial blood flow. Unlike the Tc-99m perfusion agents, it then undergoes redistribution, a process of continual dynamic exchange between myocardial cells and the vascular blood pool. Several hours after injection, the images depict an equilibrium reflecting regional blood volume. With normal perfusion, initial capillary blood flow and delayed regional blood-volume images are similar. Regions of decreased perfusion on early poststress images are due to either decreased blood flow (ischemia) or lack of viable cells to fix the tracer (infarction). If an initial perfusion defect persists on delayed images, it is infarcted. Defects showing “fill-in” of Tl-201 between stress and rest are viable myocardium rendered ischemic during stress. These unique pharmacokinetic characteristics of Tl-201 are the basis for “stress-redistribution” imaging used in the past for the detection of CAD (see Fig. 16.4 ) but today, more commonly, for viability.
Imaging Methodologies
Planar Myocardial Perfusion Imaging
Two-dimensional (2-D) planar imaging was the standard imaging method for many years. Although three-dimensional (3-D) SPECT is now routine, 2-D planar imaging is still occasionally used for patients not able to tolerate SECT acquisition (e.g., who are too large for the SPECT camera, too heavy to lie on the camera table, or have claustrophobia). Planar images are limited by high background and overlapping structures in the standard three views (left anterior oblique, right anterior oblique, left lateral; Figs. 16.5 and 16.6 ). The accuracy of CAD diagnosis is generally good for planar imaging; however, localization of regional perfusion abnormalities is only moderately predictive of the coronary bed involved. This is important because scintigraphy is used for prognosis, risk stratification, and patient management.


Single-Photon Emission Computed Tomography
SPECT cross-sectional images have high-contrast resolution and are displayed in three dimensions along the short and long axes of the heart ( Fig. 16.7 ; see also Fig. 16.1 ,), providing good delineation of the regional myocardial perfusion supplied by individual coronary arteries ( Figs. 16.8 and 16.9 ). During acquisition, the gamma camera rotates about the patient, acquiring 2-D images every few degrees of rotation. These are then processed into 3-D cross-sectional images in a manner similar to CT. Because the heart lies in the anterior lateral chest and there is considerable attenuation in the posterior projections, cardiac SPECT is acquired over a 180-degree arc from the left posterior oblique (LPO) to the right anterior oblique (RAO) projection. Using a two-headed camera with the detectors at 90 degrees maximizes sensitivity and minimizes acquisition time. High-resolution collimators take advantage of the higher counts obtained from two detectors. Image acquisition with standard SPECT systems takes 20 to 30 minutes. Some newer dedicated cardiac cameras can acquire more counts with greater image resolution in a shorter time period. Typical SPECT acquisition parameters are listed in Table 16.2 .


| Matrix | 128 × 128 |
| Number of stops | 64 |
| Time per stop | 28 sec |
| Zoom | 1.46 cm |
| Range | 90 degree/detector |
| Method | Step and shoot |
Filtered back-projection had long been the standard method used for cross-sectional image reconstruction for both CT and SPECT; however, because of the speed of modern computers, superior iterative reconstruction techniques have now become routine for both. Correction for attenuation uses an attenuation map generated by the CT in SPECT/CT systems or, in older SPECT-only systems, a rotating gamma source. Software filters are chosen to optimize the trade-off between high-frequency noise and low-frequency oversmoothing.
Cardiac SPECT software reconstructs cross-sectional cardiac images along the short and long axes—transaxial (short axis), coronal (horizontal long axis), and sagittal (vertical long axis; see Figs. 16.7 and 16.9 ). SPECT images depict perfusion of the myocardium as it relates to the coronary artery supplying blood to that region ( Table 16.3 ) and permit estimation of the degree and extent of the perfusion abnormality.
| Coronary Arteries | Scintigraphic Perfusion Defects |
|---|---|
| Left anterior descending | Septum, anterior wall, apex |
| Left circumflex | Lateral wall, posterior wall, posterior inferior wall, apex |
| Right coronary | Inferior wall, posterior inferior wall, right ventricular wall |
| Left main coronary | Anterior wall, septum, posterolateral wall |
Gated Single-Photon Emission Computed Tomography
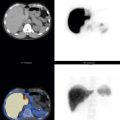
The relatively high count rate available from 15 to 30 mCi (740–1110 MBq) of Tc-99m sestamibi or tetrofosmin and the two detector heads make electrocardiographic (ECG) gating a common practice, allowing for a cinematic 3-D display of contracting myocardial slices from summed beats over the acquisition period. Data collection is triggered by the R-wave of the electrocardiogram. Each cardiac cycle is divided into 8 frames, less than the 16 frames used for count-rich Tc-99m-labeled red blood cell (RBC) ventriculograms, because of their lower count rate. The eight frames limit only to a mild degree the temporal resolution (pinpointing end-diastole and end-systole) and accuracy of left ventricular ejection fraction (LVEF) calculation. Semiautomatic edge-detection software programs draw the endocardial surface and delineate the valve plane for LVEF calculation and wall motion ( Fig. 16.10 ). Hybrid SPECT/CT systems are increasingly used. Low-resolution CT is used primarily for attenuation correction and coronary artery calcium scoring. However, CT images should always be reviewed and may reveal incidental unknown disease ( Fig. 16.11 ) .


Diagnosis and Evaluation of Coronary Artery Disease
Ischemic perfusion abnormalities are not usually seen at rest. Although under resting conditions, high-grade stenosis (≥90%) in an epicardial coronary artery produces a downstream decline in coronary perfusion pressure to the affected vascular territory, resting blood flow is usually maintained by autoregulatory dilation of the coronary arterioles ( Fig. 16.12 ). Exercise increases cardiac work and the demand for oxygen and blood flow. In the absence of CAD, maximum exercise increases coronary flow by 3 to 5 times. Coronary flow reserve (maximum increase in blood flow above normal resting flow) across a fixed mechanical stenosis is limited because most of the coronary arteriolar vasodilator reserve has already been used to maintain resting flow. However, with exercise, myocardium in the watershed of a coronary artery with a hemodynamically significant stenosis becomes ischemic, resulting in less delivery and localization of the radiopharmaceutical. Hypoperfusion on scintigraphy is seen as a perfusion defect (“photopenic” or cold) surrounded by normal blood flow in the adjacent nonischemic cardiac regions ( Fig. 16.13 ). Coronary artery stenoses of more than 70% are considered clinically significant based on the usually rapid fall-off in flow reserve augmentation above this level (see Fig. 16.12 ). Myocardial perfusion scintigraphy is often used to evaluate the clinical significance of a known stenosis, particularly in the range of 50% of 70%.


Cardiac Stress
Exercise Stress
Graded treadmill exercise with ECG monitoring has long been the standard method to diagnose ischemic CAD ( Fig. 16.14 ). Exercise increases cardiac workload and oxygen demand. The degree of stress must be sufficient to unmask underlying ischemia ( Box 16.1 ). The treadmill study allows for an assessment of the patient’s functional cardiac status by monitoring exercise tolerance, heart rate, blood pressure, and ECG response to graded exercise. Contraindications to cardiac stress testing are listed ( Box 16.2 ).

Physiological Rationale
Physical exercise increases cardiac work.
Increased work increases myocardial oxygen demand.
Normal coronary arteries dilate, and flow increases.
Stenotic vessels cannot dilate, and flow reserve is limited.
Myocardial ischemia is induced.
Manifestations of Myocardial Ischemia
Electrocardiogram: Ion flux across cell membrane is impaired, producing ST-segment depression.
Perfusion scintigraphy: Decrease in regional flow produces cold defect on scintigraphy.
Radionuclide ventriculography: Regional wall-motion abnormality or fall in left ventricular ejection fraction with stress
Acute myocardial infarction
Unstable angina
Severe tachyarrhythmias or bradyarrhythmias
Uncontrolled symptomatic heart failure
Critical aortic stenosis
Acute aortic dissection
Pulmonary embolism
Poorly controlled hypertension
Exercise-induced myocardial ischemia produces characteristic ECG ST-T segment depression ( Fig. 16.15 ). The adequacy of exercise is critical for interpretation. Patients achieving more than 85% of the age-predicted maximum heart rate (220 – age) are considered to have achieved adequate exercise stress. The product of heart rate × blood pressure, metabolic equivalents (METS), and exercise time (minutes) are also used to judge the adequacy of exercise. Failure to achieve adequate exercise is the most common reason for a false-negative stress test result ( Box 16.3 ).

Poor general conditioning, low exercise tolerance
Poor motivation
Arthritis, other musculoskeletal problems
Lung disease
Peripheral vascular disease
Medications (beta-blockers)
Angina
Arrhythmia
Cardiac insufficiency
The accuracy of the cardiac treadmill exercise test for the diagnosis of CAD is modest, approximately 75%, with many false-negative and false-positive results. The specificity is particularly poor in women, in patients with resting ECG ST-T abnormalities, left ventricular hypertrophy, or bundle branch block, and for those on digoxin. These patients often require myocardial perfusion scintigraphy to confirm or exclude the diagnosis of CAD.
Methodology for Exercise Stress
The patient must fast for 4 to 6 hours before the test to prevent gastric symptoms and minimize splanchnic blood distribution. Cardiac medications may be held depending on the indication for the stress test (e.g., whether for diagnosis or to determine the effectiveness of therapy; Table 16.4 ). Beta-blockers may prevent achievement of maximum heart rate, and nitrates and calcium channel blockers may block or prevent cardiac ischemia, limiting the test’s diagnostic value. In addition to a standard 12-lead electrocardiogram, an intravenous line is kept open. Graded treadmill exercise is usually performed according to the Bruce protocol ( Table 16.5 ). When the patient has achieved maximal exercise or peak patient tolerance, the radiotracer is injected. Exercise is continued for another minute to ensure adequate myocardial uptake. Early discontinuation of exercise may result in uptake reflecting perfusion at submaximal exercise levels. Indications for terminating exercise are listed in Box 16.4 . Many are manifestations of ischemia; others are due to underlying medical, cardiac, or pulmonary conditions.
| Drugs | Withdrawal Interval |
|---|---|
| Exercise | |
| Beta-blockers | 48–96 hr |
| Calcium channel blockers | 48–72 hr |
| Nitrates (long acting) | 12 hr |
| Pharmacological | |
| Theophylline derivatives | 48 hr |
| Caffeine | 24 hr |
| Stage (min) | Total Time (min) | Speed (mile/hr) | Grade (%) |
|---|---|---|---|
| Standard Bruce Protocol | |||
| 1 (3) | 3 | 1.7 | 10 |
| 2 (3) | 6 | 2.5 | 12 |
| 3 (3) | 9 | 3.4 | 14 |
| 4 (3) | 12 | 4.2 | 16 |
| 5 (3) | 15 | 5.0 | 18 |
| 6 (3) | 18 | 6.0 | 20 |
| Modified Bruce Protocol | |||
| 1 (3) | 3 | 1.7 | 0 |
| 2 (3) | 6 | 1.7 | 5 |
| 3 (3) | 9 | 1.7 | 10 |
| 4 (3) | 12 | 2.5 | 12 |
| 5 (3) | 15 | 3.4 | 14 |
| 6 (3) | 18 | 4.2 | 16 |
| 7 (3) | 21 | 5.0 | 18 |
Patient request
Inability to continue because of fatigue, dyspnea, or faintness
Moderate to severe chest pain
Dizziness, near syncope
Pallor, diaphoresis
Ataxia
Claudication
Ventricular tachycardia
Atrial tachycardia or fibrillation
Onset of second- or third-degree heart block
ST-segment depression greater than 3 mm
Decrease in systolic blood pressure from baseline
Increase in systolic blood pressure above 240 mm Hg or diastolic above 120 mm Hg
Pharmacological Stress
Patients receive pharmacological stress with coronary vasodilators rather than exercise stress when it is anticipated that they will not be able to achieve adequate exercise due to concurrent medical problems (e.g., pulmonary disease or lower extremity musculoskeletal problems). The disadvantage of this approach is the lack of functional cardiac information provided by exercise. Dipyridamole (Persantine) and adenosine (Adenoscan) have long been used for pharmacological stress myocardial perfusion imaging. Regadenoson (Lexiscan) was approved by the FDA in 2009 and is the most recently FDA-approved drug.
Coronary vasodilators increase coronary blood flow by 3 to 5 times in normal vessels. Because coronary arteries with significant stenoses cannot increase blood flow to the same degree, vasodilator stress results in vascular regions of relative hypoperfusion on myocardial perfusion scintigraphy, similar to that seen with exercise-induced ischemia. This is really not a test of ischemia because cardiac work is not involved but, rather, a test of coronary flow reserve. However, comparative studies have shown similar scintigraphic patterns and diagnostic accuracy for exercise and pharmacological stress.
Endogenous adenosine is normally physiologically released from the coronary endothelial cells and activates four coronary receptor subtypes, A1, A2A, A2B, and A3. Only A2A activation produces coronary vasodilation. Activation of the other receptors is responsible for side effects. The adenosine analog (Adenoscan) used for stress testing has a similar effect. It is short acting, and discontinuation of infusion promptly resolves any adverse symptoms. Dipyridamole exerts its pharmacological effect by blocking the reuptake of adenosine and thus raising endogenous adenosine blood levels. Regadenoson is a selective A2A receptor.
Methodology
Because vasodilators are counteracted by drugs and food containing methylxanthines (e.g., theophylline and caffeine), they should be held for 12 to 24 hours before the study (see Table 16.4 ). The technical details for dipyridamole, adenosine, and regadenoson infusion protocols vary somewhat ( Fig. 16.16 ) due to their different pharmacokinetics ( Table 16.6 ). Unlike adenosine and dipyridamole, which are given as constant infusions based on weight, regadenoson is given in a fixed dose as an intravenous bolus. A mild to moderate increase in heart rate and a reduction in blood pressure confirm the drugs’ pharmacological effect.

| Pharmacokinetics | Dipyridamole | Adenosine | Regadenoson |
|---|---|---|---|
| Administration | Intravenous infusion | Intravenous infusion | Intravenous bolus |
| Dose Mode of action Duration of infusion | 0.56 mg/kg Blocks reuptake of adenosine, raising endogenous adenosine blood levels 4–8 min | 140 μgm/kg/min Nonselective 4–6 min | 400 μg Selective A2A agonist 10-sec bolus |
| Time to peak Duration of action Elimination | 6.5 min 12 min Liver | 30 sec 6 sec after infusion stopped Cellular uptake/metabolism | 33 sec 2.3 min Renal (57%) |
Not uncommon side effects of these drugs include dizziness, headache, and flushing. Infrequently, patients experience chest pain; however, it is not usually caused by ischemia. A coronary steal syndrome may sometimes produce true ischemia, manifested by ECG ST-T depression during the infusion, suggesting significant CAD. Dyspnea and atrioventricular (AV) conduction blocks occur predominantly with adenosine.
Although dipyridamole was the first agent approved, it is less often used today because of its long physiological effect, often causing adverse symptoms and requiring reversal with aminophylline. Both adenosine and dipyridamole may cause bronchospasm in patients with asthma and chronic obstructive pulmonary disease. Regadenoson is somewhat safer in patients with mild to moderate reactive airway disease and may have fewer side effects overall.
Because of adenosine’s short half-life (<10 seconds), side effects resolve promptly when the infusion is stopped. Because the effect of dipyridamole and regadenoson is prolonged after stopping the infusion, intravenous aminophylline may be required to reverse the side effects.
Dobutamine
For patients unable to exercise and with contraindications to vasodilator therapy (e.g., symptomatic asthma), dobutamine can be used as an alternative. It is a synthetic catecholamine that acts on alpha- and beta-adrenergic receptors, producing inotropic and chronotropic effects that increase cardiac work. In normal coronary arteries, increased blood flow results. With significant stenosis, regional flow does not increase, producing scintigraphic patterns similar to those seen with exercise and pharmacological stress.
Methodology
The initial dopamine infusion rate is 5 μg/kg/min over 3 minutes, then increased to 10 μg/kg/min for another 3 minutes and increased further by the same amount every 10 minutes until a maximum of 40 μg/kg/min is achieved. The radiopharmaceutical is injected 1 minute after the maximal tolerable dose. Dobutamine infusion is continued for 1 minute.
The accuracy of dobutamine perfusion imaging is similar to that of exercise or pharmacological stress. However, it is limited by the frequent occurrence of side effects, including chest pain, arrhythmias, and the inability of patients to tolerate the maximum dose. The main adverse effects are hypotension and arrhythmias, which are dose related and require cessation of infusion.
Imaging Protocols
The specific stress/rest perfusion imaging protocol used depends on the radiopharmaceutical chosen, physician preference, and clinic logistics ( Table 16.7 ; Box 16.5 ).
| Method | Radiopharmaceutical | Rationale |
|---|---|---|
| 2 day | Tc-99m sestamibi/tetrofosmin | Obesity, image quality |
| 1 day | Tc-99m sestamibi/tetrofosmin | Image quality, efficiency |
| 1 day | Tl-201 | Viability |
| Dual isotope | Tl-201 and Tc-99m sestamibi/tetrofosmin | Image quality, viability, logistics |
Related posts:

Stay updated, free articles. Join our Telegram channel

Full access? Get Clinical Tree


