Outline
Topic 8, Figure 279
- 1.
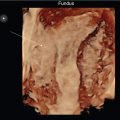
Fig. 279 . Topic: “Read” Zoom Versus “Write” Zoom.

Fig. 279
Magnifying an ultrasound image is commonly done by the examiner; however, making an image appear bigger by merely turning the zoom knob will only magnify each pixel (“read” zoom). As the image gets bigger, the frame rate (FR) or number of images per second will not be changed, and resolution of the image will depreciate as it is increased because all it does is make bigger pixels. If the examiner presses the high-resolution zoom knob, a box will come onto the screen, which can be changed (narrowed, lengthened, etc.) in size by the examiner in order to reacquire the acoustic lines at the area of interest within the box (it will “rewrite” the zoom). Doing this increases the FR and results in a zoomed image with higher resolution. The FR is seen on all images (yellow arrows) and can be seen to be the same at 50 Hz for the original and the read zoomed images, but at 95 Hz for the write zoomed image with improved resolution. Do not confuse the “frame rate” with the transducer “frequency.”
Case 129, Figure 280
- 2.
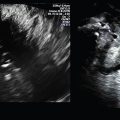
Fig. 280 demonstrates 2D transverse and sagittal images of the right ovary, using a 4–8 MHz endovaginal (EV) transducer, on a 44-year-old multiparous patient referred for clinical adnexal fullness. The ultrasound assessment of the left ovary is normal and is not presented.

Fig. 280
Measurements can be made post exam. Each line to dot or dot to line along the side of the image measures 0.5 cm. Which of the following is the correct abnormal right ovarian size based on the calipers along the side of the images?
- a.
20 × 12 × 10.4 cm
- b.
10 × 6 × 5.2 cm
- a.
- 3.
Fig. 280 . Which of the following best describes the ovarian mass echo pattern?
- a.
Complex primarily cystic in appearance with multiple clusters of papillations around a single vertical septum
- b.
Complex primarily solid in appearance with diffuse hypoechoic intraovarian mural wall nodules
- c.
Anechoic in echo pattern with multiple, diffuse, round hyperechoic sub-lesions
- d.
Heterogeneous with a complex primarily cystic appearance
- a.
Case 130, Figure 281
- 4.
Fig. 281 demonstrates images of a 32-year-old multiparous patient who presents with nonspecific but constant pelvic pain and dyspareunia. Both the ovaries are well visualized and appear within normal limits and are not presented. The top left image is a 2D EV midline sagittal image using a 5–9 MHz EV transducer and the bottom right is a post-processed transverse mid-uterus image to knock out midlevel echoes (to enhance contrast). Note that the uterus appears bulky in global appearance. The bottom left image demonstrates the Color Power Doppler vascular pattern. Based on these images, answer the following questions with Yes or No.
- a.
The endometrium appears trilaminar in echo pattern. _____
- b.
The uterus is diffusely homogeneous. _____
- c.
The endometrial/myometrial interface appears indistinct. _____
- d.
The myometrium contains diffuse small hypoechoic lesions. _____
- e.
Normal nabothian cysts are present. _____

Fig. 281
- a.
- 5.
The sonographic findings are consistent with which two of the following?
- a.
Adenomyosis
- b.
Leiomyomata
- c.
Uterine sarcoma
- d.
Endometrial carcinoma
- a.
Case 131, Figures 282–284
- 6.
Figs. 282–284 are images, using a 5–9 MHz 3D EV transducer, of a 50-year-old patient with a suspected right-sided pelvic mass found on clinical exam. The ultrasound assessment of the left ovary is normal and is not presented. The right adnexa appears as a complex primarily cystic appearing mass with an irregularly shaped hyperechoic subcomponent, measuring 1.67 × 2.85 × 2.15 cm, seen as a large mural nodule at the superior aspect of the mass (calipers). A septum is noted, extending vertically with an irregular varied thickness and a hyperechoic pattern. From the 3D volume set of the right ovary, approximate the adnexal mass dimensions. _____

Fig. 282

Fig. 283

Fig. 284
- 7.
Fig. 283 demonstrates the Color Power Doppler vascular flow pattern of the mass. The 2D image of Color Power Doppler (screen left) only demonstrates a single cut of the entire vascularity within or around a mass; therefore, the overall 3D rendered image (screen right) enhances the overall suspicion of an abnormal intramass component with visualization of diffuse markedly increased blood flow.
When there is questionable intramass hypervascularity, the examiner should turn down the pulse repetition frequency (PRF) to maximize the flow pattern. If the flow becomes “blushed” in appearance such that artifactual colors pixelate the entire color box, the PRF has been set too low. When this threshold is reached, the PRF can be incrementally increased to where the blush goes away, leaving the real minimal flow pattern, as seen on the 2D Color Power Doppler images.
Once increased vascularity is established, it is important to analyze vessels with Doppler spectral velocity waveform analysis as exemplified in Fig. 284 . Velocities are presented on the screen when any quantitative Doppler spectral measurements are done. Which Doppler velocity index is the most reliable to evaluate ovarian flow pattern in the presence of hypervascularity—the peak systolic velocity (PSV), the end-diastolic velocity (EDV), or the resistive (RI) index? _____
Case 132, Figure 285
- 8.
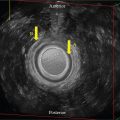
Fig. 285 is a single 2D transperineal image of the internal anal sphincter (IAS) using a 6–12 MHz EV transducer. Answer the following questions.
- a.
Are the anteroposterior dimensions of all four quadrants of the IAS symmetric? _____
- b.
Is there a disruption of the IAS? _____
- c.
Is there elevation of the central mucosa? _____
- d.
At what level of the anal sphincter complex is this image made? _____

Fig. 285
- a.
Case 133, Figure 286
- 9.
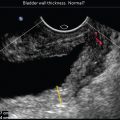
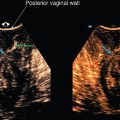
Fig. 286 demonstrates the vaginal cuff using a 6–12 MHz EV transducer on a 36-year-old patient who is status post (s/p) transvaginal hysterectomy with a history of endometriosis and postoperative pain and dyspareunia. The screen top image demonstrates the most anterior vaginal cuff in a transverse plane. Note that the cuff is smooth in contour and homogeneous in echo pattern (gold arrows).

Fig. 286
Is the curvilinear cuff hyperechoic, isoechoic, or hypoechoic relative to the adjacent bladder wall?
- a.
Hyperechoic
- b.
Isoechoic
- c.
Hypoechoic
- a.
Case 134, Figures 287–291
- 10.
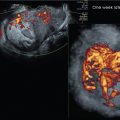
Figs. 287–291 demonstrate transabdominal 2D pelvic and 3D rendered images of a patient with a living 13-week intrauterine pregnancy (IUP) using transabdominal 1–5 MHz and 2–6 MHz 3D transabdominal transducers. The left adnexa demonstrates a large, well-circumscribed, complex, primarily solid-appearing mass, measuring 13.5 × 9.19 × 12.06 cm, directly adjacent to the left aspect of the uterus with abundant vascularity noted ( Fig. 287 ).
- a.
Is the mass contiguous to or adjacent and separate from the uterus ( Fig. 288 )? _____

Fig. 288
- b.
Is the echogenicity of the mass hypoechoic, isoechoic, or hyperechoic as compared to the uterus? _____

Fig. 287
- a.
- 11.
With any pelvic mass, it is crucial to demonstrate the individual ovaries as separate or part of the mass. See Figs. 289 and 290 . Does either ovary appear as part of the mass? Answer Yes or No.
- a.
Left _____
- b.
Right _____
- a.