Outline
Topic 6, Figure 199
- 1.
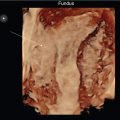
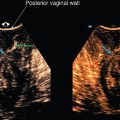
Fig. 199 . Topic: Tomographic Ultrasound Imaging (TUI) of the Normal Transperineal Anal Sphincter Complex (ASC) 3D Volume Set

Fig. 199
TUI is the creation of operator-determined slices of a 3D volume set that can be presented into any of the orthogonal planes; so, it will start from the 3D volume set (screen left). The slices can be made thinner or thicker to view the anatomy, much like a parallel shift through the 3D volume.
The right screen top is the midsagittal ASC image (top left) divided into axial planes, which are presented from proximal to distal. The right screen bottom takes the axial cut out of the volume set and divides it into right to left parasagittal slices. TUI is wonderful for looking globally to find the most specific area of pathology in a similar way as parallel shifting through the volume set to the appropriate level.
Case 95, Figure 200
- 2.
Fig. 200 represents a midsagittal image of the uterus of a 22-year-old who is post menses. She was referred to follow up an “ovarian cyst” found on a previous exam 2 months ago. Her ovaries are normal on this exam and are not presented. Color Power Doppler is applied to demonstrate normal uterine vasculature. The uterine arteries branch into the arcuate arteries that “arc” along the periphery of the uterus. These branch to the radial arteries that “radiate” through the myometrium perpendicularly relative to the arcuate arteries. These branch to the spiral arteries that “spiral” toward the endometrium. As the vessels approach the endometrium, note that the normal branching vessels lie perpendicular to the basal layer of the endometrium. Screen bottom is a cross-section of the uterine vascular pattern.

Fig. 200
Of these vessels on both images, which are the labeled structures?
- a.
_____
- b.
_____
- c.
_____
- a.
Case 96, Figures 201 and 202
- 3.
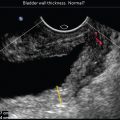
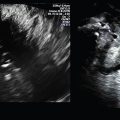
Figs. 201 and 202 are sagittal and transverse images, using a 4–8 MHz endovaginal (EV) transducer, of a 30-year-old with a history of three early pregnancy losses. She is on day 8 of her cycle. Sonohysterography was performed, but with the placement of the catheter, the saline infusion did not fill the cavity; instead, it pooled at the cervical/vaginal interface.

Fig. 201

Fig. 202
Which of the following descriptions best describes the uterine/endometrial vascular pattern on Fig. 201 ?
- a.
Uterine vessels are normal, lying perpendicular to the endometrium
- b.
Uterine vessels are abnormal, lying perpendicular to the endometrium
- c.
Uterine vessels are normal, lying parallel to the endometrium
- d.
Uterine vessels are abnormal, lying parallel to the endometrium
- a.
- 4.
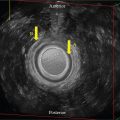
Fig. 202 is a transverse image of the uterus on the same patient. The arrows surround the transverse endometrium circumferentially. Combining Figs. 201 and 202 , which of the following is true about the endometrial Color Power Doppler pattern?
- a.
There is normal diffusely perpendicular vascular endometrium.
- b.
There is normal circumferential intramural vascular branching pattern.
- c.
There is normal peri-endometrial vessel branching pattern.
- d.
There is abnormal peripheral to central vascular branching pattern.
- a.
- 5.
Which of the following is the best sonographic diagnosis for this appearance?
- a.
Endometrial polyp
- b.
Endometrial mid-cycle free fluid
- c.
Submucosal myoma
- d.
Endometrial carcinoma
- a.
Case 97, Figures 203 and 204
- 6.
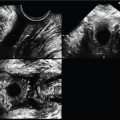
Fig. 203 demonstrates transabdominal and EV images of a 38-year-old with a 2-year history of pelvic pain. The frequency of the transabdominal transducer (top) was 4–8 MHz and that of the EV transducer (bottom) was 5–9 MHz. The left ovary was well visualized and appeared within normal limits and is not presented.

Fig. 203
Compare the resolution of the right adnexal mass to assess the abnormal right adnexa using a lower-frequency transabdominal approach (top image) to a higher-frequency EV approach (bottom images). For example, with the transabdominal approach, the right adnexal mass appears anechoic, suggesting the presence of a simple cyst.
The volume of the ovary is increased, measuring 52.8 cc. Which of the following is the best description of the EV image of the right adnexal mass?
- a.
Well-circumscribed round anechoic mass with enhanced through transmission
- b.
Poorly circumscribed oval-shaped mass with diffuse low-level echoes
- c.
Well-circumscribed lobular mass with dependent latticed linear echoes
- d.
Endometrioma
- a.
- 7.
Fig. 204 demonstrates Color Power Doppler application to the 3D volume set of the mass. Note that there are no vessels seen within the mass, and the 3D rendered image demonstrates vascularity adjacent to the lesion. Which of the following is the most likely sonographic diagnosis of the adnexal mass?
- a.
Hemorrhagic corpus luteum
- b.
Simple ovarian follicular cyst
- c.
Dermoid
- d.
Endometrioma
- e.
Ovarian neoplasm

Fig. 204
- a.
Case 98, Figure 205
- 8.
Fig. 205 is a short video clip of a transperineal midline sagittal normal urethra with cough. Identify the labeled directions on the patient’s body.
- a.
_____
- b.
_____
- c.
_____
- d.
_____

Fig. 205
- a.
- 9.
In what direction does the normal urethra move with cough?
- a.
Inferiorly
- b.
Anteriorly
- c.
Superiorly
- d.
Posteriorly
- a.
Case 99, Figures 206 and 207
- 10.
Figs. 206 and 207 are transperineal images of a 68-year-old patient with urinary incontinence. She has a history of urinary incontinence and known mesh placement for stress urinary incontinence. The top right image ( Fig. 206 ) is her bladder and urethra at rest, and the bottom image is a frozen image of a cine loop at maximum cough. The gold arrow points to her mesh. It is located posterior to the urethra at the proximal, mid, or distal position? _____

Fig. 206

Fig. 207
- 11.
The comparison of the two images demonstrates how profound an improperly supported urethra and bladder can change with cough (bottom left image). Relative to the urethra, the mesh moves completely out of the field of view with her cough, obviously not supporting the urethra. A properly placed mesh should be at the level of the mid-urethra with support, demonstrating little movement when the patient coughs. How does the urethra change with cough (blue arrow)?
- a.
It opens completely
- b.
It closes completely
- c.
It kinks closed to a near-horizontal position
- d.
It kinks closed to a near-vertical position
- a.
- 12.
As the bladder fills and expands with nonsupport (cystocele), in what direction does it bulge?
- a.
Inferiorly
- b.
Inferiorly and posteriorly
- c.
Superiorly
- d.
Posteriorly
- e.
Superiorly and posteriorly
- a.
- 13.
Fig. 207 is a transperineal video clip of the pelvic floor with a Valsalva maneuver. Which of the following is not demonstrated?
- a.
Swirling of sedentary particles in the bladder with Valsalva
- b.
Inferior/posterior movement of the mesh with the bulging bladder
- c.
Normal closure of the urethra with Valsalva
- d.
Inferior movement of the small bowel anterior to the anal sphincter complex
- a.
Case 100, Figures 208–215
- 14.
Figs. 208–215 are those of a patient referred for pelvic fullness. She was diagnosed with bilateral ovarian cysts based on an ultrasound exam from an outside institution. Figs. 208 and 209 are ambiguous transabdominal images of complex hypo-echoic pelvic masses through only a partially filled bladder. Sorting through this kind of complex findings takes patience with deliberate evaluation of anatomy. Fig. 209 is a transabdominal transverse view of what was thought to represent the left ovary (calipers). The remainder of the exam was performed with a 5–9 MHz EV transducer. Fig. 210 is a midline (ML) sagittal transperineal image of the pelvic anatomy with the transducer placed halfway into the vagina, demonstrating how far inferiorly the complex mass extends (yellow arrows). Identify the labeled directions on the image of the ML sagittal cut of Fig. 210 .
- a.
_____
- b.
_____
- c.
_____
- d.
_____
- a.