Outline
Topic 2, Figure 41
- 1.
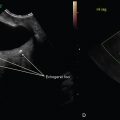
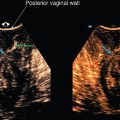
Fig. 41 . Topic: How Doppler Is Used in This Workbook

Fig. 41
Doppler assessment of vasculature in pelvic diagnostic imaging is common though there are broad variations in knobology settings among ultrasound systems. The examiner should optimize the Doppler settings to ensure that the real vessels are seen, especially in the presence of suspected abnormal vascularization. It is equally important to demonstrate “real” low-velocity vascularization.
The examiner can choose Color Power Doppler (screen bottom left), color Doppler color flow (screen top left), or Doppler spectral waveform (screen right). Color power Doppler is a qualitative setting, picking up non-directional global vascularity, although some ultrasound systems can also demonstrate blood flow direction with Color Power. Doppler color flow depicts vascularity, with an assigned blue or red pixel application based on mean flow velocity of blood vessels at each location, and identifies flow direction. In the standard setting, red indicates blood flow toward the transducer and blue indicates blood flow away from the transducer.
In pelvic imaging, it generally does not matter which direction the blood flow is traveling; therefore, the use of Color Power Doppler is reasonable. If Color power Doppler is turned on and no flow within the tissue is seen on the screen, it does not usually indicate absence of flow. It means that the default pulse repetition frequency (PRF) setting for that gynecologic exam may be set too high. PRF is the number of pulses of a repeating signal in a specific time unit, normally measured in pulses per second. On turning down the PRF knob too low, the flow increases until the whole screen “blushes” with diffuse, falsely colored pixels. At this point, the PRF can be turned back up in small increments until the blush disappears and real flow remains. If actual flow velocity of a vessel is needed, Doppler Spectral Waveform analysis of the desired vessels can be subsequently performed to obtain Doppler indices comparing the velocities during systole and diastole.
Case 19, Figure 42
- 2.
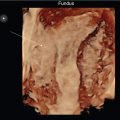
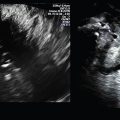
Fig. 42 includes two transperineal transverse (axial) cuts of the internal anal sphincter (IAS) surrounding the central mucosa (CM) at the mid-level of the anal sphincter complex (ASC) using a 4–8 MHz endovaginal (EV) transducer in a postpartum patient with perineal pain. If the frequency of the EV transducer was higher, the image resolution would be better, but the depth of penetration would be reduced. Every imaging center will have different transducers available to perform the exam. The examiner should choose the transducer with the highest frequency to optimize the resolution without compromising the depth of visualized anatomy.

Fig. 42
The IAS is not intact and there is elevation of the CM toward the defect. In terms of a clock, where would you describe the IAS disruption (red arrows) at the screen top image? _____
- 3.
In a vaginal delivery tear ( Fig. 42 ), postpartum inflammation of the perineum is anticipated, which would demonstrate increased vascularity.
Doppler Color Power was performed in the bottom right image of Fig. 42 to demonstrate the presumed evidence of a perianal inflammatory process in this patient. As described in Fig. 41 Topic comment above, when a gynecologic setting is initiated at the beginning of a gynecology exam, appreciate that the manufacturer’s presets are global settings to be used as a starting point for the exam. All vessels present will not automatically “light up” by merely turning on the Doppler Color Power of blood flow. Turning up the overall “gain” knob increases the echogenicity of all aspects of the screen but is not related to improving visualization of small inflamed blood vessels.
The examiner has access to fine-tune the Doppler settings, such as the pulse repetition frequency (PRF) knob. To visualize small vessels with increased flow in the inflamed tissue, the PRF needs to be turned down to be able to pick up vascularity. If the PRF is set too high, very little presence of increased or even normal vascularity may be seen.
In this case, very little flow is seen within the entire ASC/perianal Doppler Color Power box. This is likely because of which incorrect use of instrumentation?
- a.
Overall gain is set too high
- b.
Overall gain is set too low
- c.
PRF is set too high
- d.
PRF is set too low
- a.
Case 20, Figures 43 and 44
- 4.
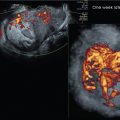
Figs. 43 and 44 demonstrate a right paraovarian lesion in a 36-year-old patient with chronic right lower quadrant pain. It measures 4.3 × 3.7 × 3.8 cm with a volume of 32 mL (cm 3 ) and is unchanged from a previous exam 6 weeks ago. Answer the following:
- a.
Is the contour of the lesion smooth or irregular? _____
- b.
With normal machine settings, sound traveling through assumed similar tissue will automatically have the gain increased by the ultrasound system as it progresses from superficial to deep tissue in order to make like tissue appear the same superficially as well as deeply. This process is called “time gain compensation” (TGC). Sometimes this is referred to as “depth gain compensation.” In other words, the gain will be increased in deeper tissue to compensate for the predictable absorption of sound. The examiner can additionally fine-tune the increased gain at the machine’s TGC pod levels along the side of the control panel that approximate depth through the tissue. Absorption of the propagating sound is bound to occur; therefore, with the machine TGC preset, a patient’s liver, for example, looks the same superficially as it does deeply. Does the overall echo pattern of the mass appear the same superficially as it does deeply? _____
- c.
When tissue is abnormal, however, the automatic process of TGC will still occur.
In diagnostic imaging, the examiner can take advantage of the presence of increased or decreased echoes beyond a structure. In fact, diagnostic criteria can include whether there is enhancement or shadowing beyond a structure. For example, a cyst will not absorb the sound because it is filled with fluid, so there will be increased echoes beyond the mass. Contrarily, a dense solid mass will absorb the sound, so there will be an acoustic shadow beyond the mass. The use of this nomenclature should be part of the exam reporting. Find the TGC pods on your ultrasound system and note that you can increase or decrease the gain at any level when you slide the pods to the right or to the left.
In Fig. 43 , note that the tissue beyond the lesion that is opposite from the transducer location appears increased in echogenicity (hyperechoic; see between the gold lines). Is this echo pattern increased (“posterior acoustic enhancement”) or decreased (“posterior acoustic shadowing”)? _____

Fig. 43

Fig. 44
- a.
- 5.
The term “homogeneity” globally implies a consistent smooth echo pattern throughout a structure, whereas the term “heterogeneity” implies diffuse complexity of echoes. Focusing back to the lesion ( Fig. 43 ), which of the following best describes it?
- a.
It is heterogeneous, with multiple septae noted within and along the inner inferior peripheral luminal wall.
- b.
It is homogeneous, with thick mural nodules noted at the inner inferior luminal wall.
- c.
It is heterogeneous, with diffuse thin septations noted within the entire lesion.
- d.
It is homogeneous, with diffuse low-level central echoes noted.
- a.
- 6.
“Heterogeneity” can be further described. Is the echo pattern of the lesion “complex primarily cystic in appearance” or “complex primarily solid in appearance?” _____
- 7.
Fig. 44 . Doppler Color Power vascularity demonstrates all the following except which one?
- a.
No flow within the septa
- b.
Diffuse intralesional vascularity
- c.
Peripheral flow at the luminal wall
- d.
Increased flow adjacent to the lesion
- a.
- 8.
If this were a first-time examination, conservative follow-up may demonstrate a resolved finding on a subsequent exam performed, for example, 2 months later. Although most ovarian lesions are temporary (functional and benign) and resolve in 4–6 weeks, this finding is unchanged since her exam conducted 6 weeks ago and carries an increased index of suspicion for pathology.
The exam was repeated in 8 weeks and was found to be of very similar appearance, with the same echo pattern. The size and contour remained the same. Sonographic findings are most consistent with:
- a.
Endometrioma
- b.
Hemorrhagic corpus luteum
- c.
Paraovarian simple cyst
- d.
Dermoid
- a.
Case 21, Figure 45-48
- 9.
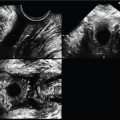
Figs. 45–48 demonstrate transperineal 3D images of the pelvic floor in a 35-year-old patient with a sense of pelvic fullness and constipation. Fig. 45 is a 3D volume set of the pelvic floor using a 6–12 MHz EV transducer placed at the perineum with a depth of view at 5.5 cm, as indicated by the calipers alongside the A plane image. The 3D sweep angle was set at 75 degrees. The 3D volume set center reference point (CRP) in Fig. 45 is placed at the posterior aspect of the mid-urethra on the A plane and is seen at that same location on all three orthogonal planes. The colored dots are very small on these images; so, take advantage of the vertical (light blue) and horizontal (red) arrows on the screen that show the intersecting lines at the CRP. Identify the following labeled structures on the A sagittal plane:
- a.
_____
- b.
_____
- c.
_____
- d.
_____

Fig. 45
- a.
- 10.
Notice that the bowel is dilated proximal to the distal anal sphincter complex (ASC; Fig. 45 , yellow arrows). In Fig. 46 , the CRP has been moved by the examiner to which of the following locations (seen on all three planes of the 3D volume set indicated by the gold arrows)?
- a.
Distal urethra/ASC interface
- b.
Anterior vaginal wall/ASC interface
- c.
Distal vaginal wall/ASC interface
- d.
Proximal urethra/vaginal apex

Fig. 46
- a.
- 11.
In Fig. 46 , compared with the echogenicity of the vagina, what is the echo pattern of the structure on which the CRP is located?
- a.
Hypoechoic
- b.
Isoechoic
- c.
Hyperechoic
- a.
- 12.
What are the approximate dimensions of the central irregular hypoechoic distal ASC mass (gold arrows in Fig. 46 and labeled “A” in Fig. 47 )? (Measure in the Fig. 46 volume set using the caliper markings along the side. The large-to-large horizontal lines are 5 cm. The large-to-small horizontal lines are 1 cm, and the horizontal line-to-dot is 0.5 cm.) _____

Fig. 47
- 13.
The C plane in Fig. 46 is enlarged and rotated upright on the Z-axis for Fig. 47 to more intuitively visualize the pelvic floor complex in a transverse (axial) cut. The examiner should assess if the pubovisceralis muscle (PVM) complex appears symmetric. Although the 3D sweep could have been set wider and angled more steeply through the volume to obtain the symphysis pubis and anterior lateral aspect of the PVM complex, it can be stated that the PVM complex is asymmetric and markedly irregular.
- a.
On which side is there evidence of pelvic floor avulsion—left, right, or both? _____
- b.
What does the structure labeled “A” ( Fig. 47 ) most likely represent? _____
- c.
What side does the structure labeled “B” ( Fig. 47 ) represent? _____
- a.
- 14.
Fig. 48 demonstrates two applications of the 3D rendered view of the pelvic floor complex, a live tissue option (screen left image) and a chroma option (screen right image).

Fig. 48
Subjectively, post-processed images may visualize the avulsion better. What the examiner sees is in the eyes of the beholder. The 3D capabilities available on your system are varied but can make a difference in your confidence about exam findings. There is a definite learning curve to acquire and master some of the 3D tool options; however, multiple visits from your vendor application specialist can help to learn and maximize the details. If you are not the one performing the exam, learn enough to make suggestions to your sonographer to maximize the ultrasound system options. Which image do you think demonstrates the anatomy more clearly? _____
Case 22, Figures 49 and 50
- 15.
Figs. 49 and 50 are sagittal and transverse EV images of a normal uterus. With EV imaging using a 4–8 MHz transducer, the outer basal layer remains consistently thin throughout the cycle and is hyperechoic in echo pattern. It is the functional layer that thickens, changes in echo pattern as the cycle progresses, and sloughs off with menses. With the glandular changes and increase in density of the functional layer, the echo pattern goes from hypoechoic relative to the basal layer in the proliferative phase to isoechoic relative to the basal layer in the secretory phase.

Fig. 49

Fig. 50
The central cavity appears hyperechoic due to the meeting of the two apposing sides of the cavity wall. Therefore, during the proliferative phase, there is a clear delineation of the layers even as it thickens, creating a trilaminar appearance from the basal–functional–central cavity–functional–basal differentiation. The endometrial thickness is measured from the outer basal layer to the opposite outer basal layer.
Identify the labeled structures:
- a.
_____
- b.
_____
- c.
_____
- d.
_____
- a.
- 16.
Fig. 50 is a transverse cut at the mid-uterus. Which segment of the uterus is labeled “e?” _____
- a.
Subserosal
- b.
Intramural
- c.
Submucosal
- a.
- 17.
Fig. 50 . Which segment of the uterus is labeled “f?” _____
- a.
Subserosal
- b.
Intramural
- c.
Submucosal
- a.
Case 23, Figures 51 and 52
- 18.
Figs. 51 and 52 are EV uterus images, using a 5–9 MHz EV transducer, of a 42-year-old multigravida presenting with menorrhagia or abnormal uterine bleeding, chronic pelvic pain that she describes as “aching in the middle of her uterus,” and dyspareunia. The ovaries appear within normal limits bilaterally and are not presented here.
- a.
In what position is the uterus? _____
- b.
Is the overall echo pattern of the uterus homogeneous or heterogeneous? _____
- a.