A sudden neurological deficit of vascular origin • Diagnostic imaging plays an important role as an ischaemic or haemorrhagic stroke cannot be distinguished clinically (and also around 30% of stroke-like episodes have a non-vascular cause) • Causes (after excluding a subarachnoid haemorrhage): ischaemia (85%) • Causes of an ischaemic stroke: atherothrombotic arterial occlusion or embolism • Brainstem infarcts: these are commonly due to occlusion of a short perforating vessel • Multiple infarcts within different arterial territories suggest a cardiac rather than a carotid embolic source (or a haemodynamic hypotensive stroke if the distribution conforms to the arterial border ‘watershed’ zones) • Earliest detectable change: the ‘dense artery’ sign: this is due to fresh thrombus occluding a vessel (as thrombus can rapidly disperse, this sign is not always present) • Late signs: encephalomalacia and atrophy with enlargement of the adjacent sulci and ventricles • A region of swelling without an area of associated low density (resulting from a compensatory increase in CBV) can be a sign of compromised perfusion that may be reversible • A high mortality is associated with an area of hypodensity affecting > 50% of the MCA territory (an area of hypodensity affecting > 33% is commonly a contraindication to thrombolysis) • CT is much more sensitive than MRI for detecting acute haemorrhage • Early changes: thrombus can cause loss of the normal arterial flow void (arterial high SI may be seen with FLAIR imaging due to altered flow – this is a useful qualitative sign of reduced perfusion when the parenchyma still appears normal) • Early parenchymal signs: there is structural breakdown and disruption of the blood–brain barrier with fluid leaking into the extracellular space • Subacute stage: contrast enhancement is commonly seen on MRI (as well as CT) due to disruption of the blood–brain barrier • Late signs: these are as for CT (MRI signal intensities and CT attenuation values approach that of CSF) • Haemorrhagic transformation: this follows secondary bleeding into areas of reperfused ischaemic tissue • Intravascular enhancement (due to sluggish flow): this may be seen within affected vessels on contrast-enhanced MRI and CT during the first few days after an infarct (becoming less obvious towards the end of the 1st week) • This utilizes dynamic bolus tracking techniques • PW-MRI produces maps of time-to-peak contrast (TTP), mean transit time (MTT), cerebral blood volume (CBV) and cerebral blood flow (CBF) – (CBF = CBV/MTT) • This has a pre-eminent role in acute stroke imaging (with a high sensitivity within the first few hours when a T2WI is usually normal) • A normal variant seen in older people predominantly affecting the periventricular and deep cerebral white matter, basal ganglia and ventral pons • An idiopathic arteriopathy whereby dilated collateral vessels (particularly the lenticulostriate and thalamoperforator arteries) develop secondary to a progressive stenosis of the terminal internal carotid artery and its proximal intracranial segments (particularly the anterior circulation) • Moya Moya is Japanese for ‘puff of smoke’ (describing the angiographic appearance of the collateral vessels) • As well as being idiopathic it is associated with: • Sickle cell disease • In post-infective angiitis associated with varicella zoster the terminal ICA and proximal MCA are usually affected and there is infarction of the basal ganglia
Cerebrovascular disease and non-traumatic haemorrhage
CEREBRAL ISCHAEMIA
CEREBRAL ISCHAEMIA
DEFINITION
Stroke
 spontaneous intracranial haemorrhage (15%)
 cervical arterial dissection
  vasculitis
  venous thrombosis
  generalized hypoperfusion
  substance abuse
CLINICAL OUTCOME
Perforator vessel occlusion
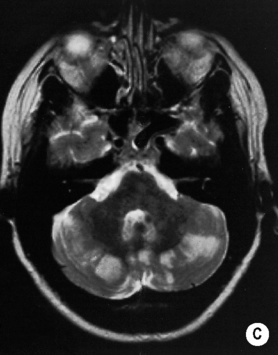
 ‘Top of the basilar’ syndrome: a combination of an infratentorial, thalamic and occipital infarct suggesting a distal basilar arterial occlusion
CEREBRAL ISCHAEMIA
CEREBRAL ISCHAEMIA
RADIOLOGICAL FEATURES
CT
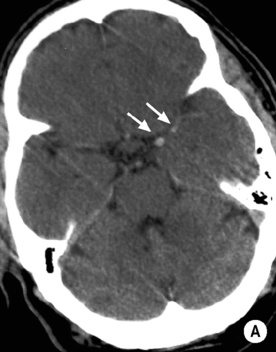
 if this is seen within the proximal MCA, it correlates with a large infarct
 MCA calcification can also mimic this sign but it is often bilateral
  the basilar artery may also appear dense (particularly in the ‘top of basilar’ syndrome)
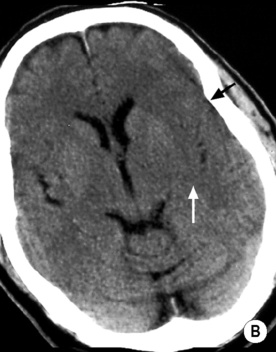
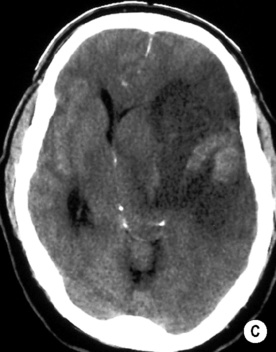
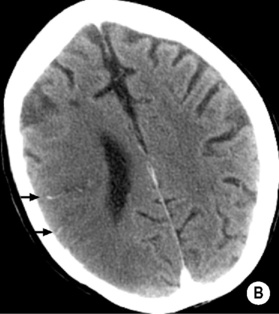
 Cytotoxic oedema: reduced grey matter density
  brain swelling (sulcal effacement)
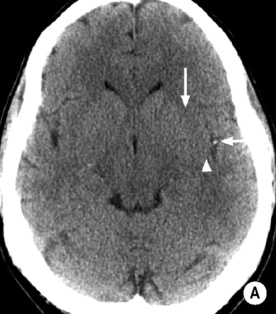
 Early MCA infarcts: a reduction in the clarity of the lentiform nucleus and cortex
MRI
 this manifests as cortical swelling and T1/T2 prolongation (this is more obvious with T2WI and especially FLAIR imaging)
 it can have a variable pattern but gyriform enhancement is characteristic of a cortical infarct
 This is seen with MRI in almost all cases by the end of the 1st week and persists for several months
 Wallerian degeneration is sometimes visible as faint T2 hyperintensity within the isilateral corticospinal tract together with asymmetrical brainstem atrophy
 it occurs during the first 2 weeks in up to 80% of infarcts seen on MRI
  it is often seen within the basal ganglia and cortex (with possibly a gyriform pattern)
  the severity of the haemorrhage correlates with the size of the infarct and the degree of contrast enhancement in the early stages
Advanced techniques
Perfusion CT (CTP)/perfusion-weighted MRI (PW-MRI)
DWI
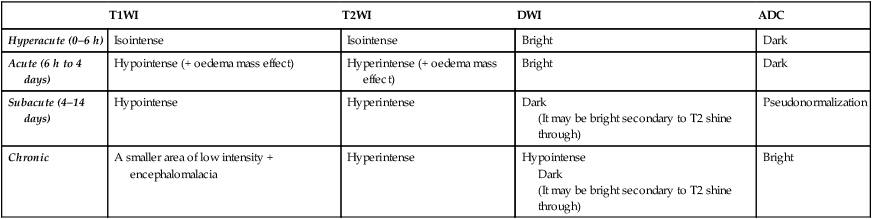
T1WI
T2WI
DWI
ADC
Hyperacute (0–6 h)
Isointense
Isointense
Bright
Dark
Acute (6 h to 4 days)
Hypointense (+ oedema mass effect)
Hyperintense (+ oedema mass effect)
Bright
Dark
Subacute (4–14 days)
Hypointense
Hyperintense
Dark
(It may be bright secondary to T2 shine through)
Pseudonormalization
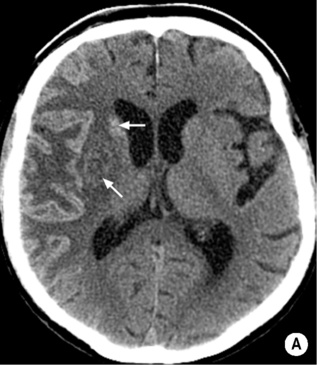
Chronic
A smaller area of low intensity + encephalomalacia
Hyperintense
Hypointense
Dark
(It may be bright secondary to T2 shine through)
Bright
Vasogenic oedema
Cytotoxic oedema
Cause
Tumour  abscess
  haemorrhage
  trauma
Ischaemia (e.g. stroke)
Mechanism
Disruption of the blood–brain barrier  increased capillary endothelial permeability leads to fluid extravasation
Failure of membrane ATP-dependent sodium pumps  accumulation of intracellular sodium and water
Imaging
Characteristic finger-like pattern with cortical sparing
Involvement of both cortex and white matter
OTHER PATTERNS OF CEREBROVASCULAR DISEASE
SMALL VESSEL ISCHAEMIC DISEASE
DEFINITION
 it is due to arteriolar occlusion of the long penetrating arteries with the outcome dependent upon vessel size:
MOYA MOYA
DEFINITION
ASSOCIATIONS
 secondary to NF-1
  cranial irradiation
  Down’s syndrome
  HIV
HIV  tuberculous meningitis
Cerebrovascular disease and non-traumatic haemorrhage
 cerebral blood flow (CBF) is maintained and can paradoxically increase to an ischaemic region (‘luxury perfusion’)
  once the vessels are fully dilated, any further falls in CPP will lead to a reduced CBF and CBV
 the failure of the energy-dependent membrane pumps cause neuronal swelling and cytotoxic oedema within 6 h (restricted diffusion on DWI)
 it is liable to infarct without prompt intervention
 if sufficient collateral circulation exists there may be deep infarcts with cortical sparing
 the commonest cause of an ACA infarct is vasospasm following a subarachnoid haemorrhage
 it can also exclude an underlying mass or AVM
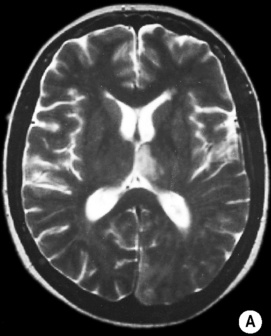


 T2WI: low SI
 reduced N-acetylaspartate (a neuronal marker) and total creatine
 a delay > 4 s seems to indicate tissue at risk
 a CBV defect seems to be the best predictor of the initial infarct size (and final size if it successfully reperfused)


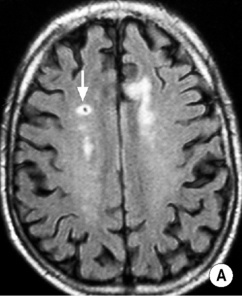
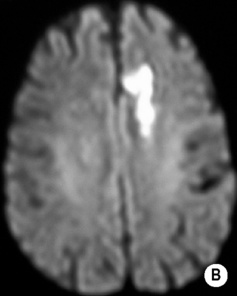
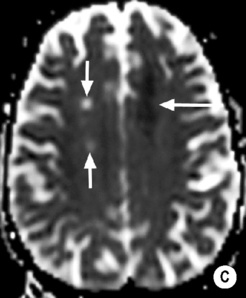
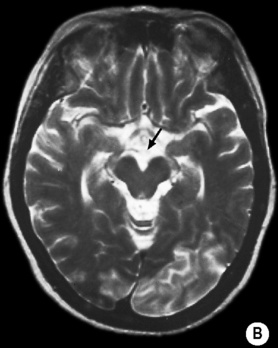
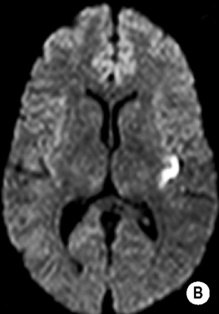
 long arrow). The infarcts on the right are bright, indicating increased ADC and therefore older lesions (short arrows).*

 hypertension
  elevated haemoglobin levels