Chest radiography is the primary imaging modality used in the intensive care unit (ICU), given its portability, rapid image acquisition, and immediate bedside return of information on the preview screen. Of consequence, it is of utmost importance that both radiologists and intensivists are adept in reading these studies.
Portable ICU radiographs are obtained in an anteroposterior (AP) view in which the x-ray beam traverses the patient anterior to posterior at a standard distance of 40 inches, compared with 72 inches for a posteroanterior (PA) view. This decreased distance contributes to greater magnification and decreased sharpness of images. Furthermore, the majority of ICU radiographs are obtained in the supine or semiupright position because of patient immobility. This often results in low lung volumes, which presents an additional challenge in interpretation.
Digital radiography has improved the quality of radiographs by allowing postprocessing manipulation of images, such as window leveling, magnification, inversion, and so forth, to enhance contrast, reduce noise, and improve image blur. It has also improved image acquisition in the ICU by allowing immediate review of the radiograph at the bedside by both the technologist and intensivist. This gives the technologist the ability to quickly obtain a repeat acquisition if there is either a technical or positioning error noted on the preview screen. In addition, if there are dramatic abnormalities noted on the preview image, such as a large pneumothorax, the intensivist can initiate treatment sooner.
Over the past several years, multiple studies dedicated to evaluating the clinical benefit of routine daily chest radiographs (CR) in ICU patients have been performed. A meta-analysis by Oba and Zaza in 2009, comprising eight trials and 7078 ICU patients, found that there were no increased adverse outcomes in patients who did not undergo routine daily chest radiographs versus patients who did. Furthermore, patients who had radiographs only for specific clinical indications received an average of 0.4 to 4.4 CRs during their ICU stay, compared with 2.4 to 10.5 CRs for the routine daily group. According to the 2014 American College of Radiology Appropriateness Criteria, “routine daily chest radiographs are not indicated for patients admitted to the ICU.” Radiographs should be obtained on admission and thereafter only in response to a specific clinical indication or after insertion of an external device, such as an endotracheal tube.
Owing to the severity of disease and frequent need for insertion of external devices, ICU patients more often than not have abnormal chest radiographs and are at risk for ICU-related complications. Common thoracic pathologic processes in the ICU include atelectasis/mucus plugging with lung collapse, aspiration, pneumonia, pulmonary edema, pleural disease, and iatrogenic complications. Acute respiratory distress syndrome (ARDS) is a more severe pathologic process that also occurs in ICU patients, but incidence and mortality have steadily declined. Each of these major processes will be discussed in further detail in this chapter.
Atelectasis
Atelectasis is the most common cause of a lung opacity in an ICU patient. When an entire lobe is atelectatic, this is described as lobar collapse. There are six recognized mechanisms of atelectasis: gravity dependent, obstructive (resorptive), passive, compressive, adhesive, and cicatricial. Gravity-dependent small airway collapse is commonly seen in postoperative patients as a result of shallow breathing and small airway collapse. However, atelectasis in ICU patients is often multifactorial and frequently results in the presence of more than one type of atelectasis on a radiograph. Obstructive atelectasis results from obstruction of a large- or medium-sized airway, which causes resorption of air distally and results in lobar collapse. Compressive atelectasis, also referred to as relaxation atelectasis by some radiologists, is the result of an intrathoracic space-occupying process (most commonly pleural effusions in ICU patients) that prevents air from entering the alveoli. Passive atelectasis is also frequently encountered, given the prevalence of pneumothoraces in ICU patients. In this setting the lung is not directly in contact with the chest wall, so the lung maintains its innate tendency to passively collapse instead of being forced open by the chest wall with each breath. Adhesive atelectasis is secondary to decreased surfactant and is commonly seen in ARDS patients or in premature neonates. Finally, cicatricial atelectasis is a chronic form of atelectasis as a result of scarring or lung fibrosis and is not seen de novo in ICU patients.
Radiography
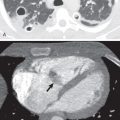
The left lower lobe is the most common site of atelectasis (66%), followed by the right lower lobe (22%) and right upper lobe (11%). When atelectasis is linear or plate-like (i.e., subsegmental atelectasis), it is often located in the gravity-dependent lower lobes ( Figs. 69.1 and 69.2 ). Although atelectasis is most commonly subsegmental in ICU patients, it may involve complete pulmonary segments or lobes ( Fig. 69.3 ). Direct signs of atelectasis, such as displacement of interlobar fissures or crowding of vessels/bronchi may prove useful in determining the location of atelectasis. On occasion, atelectasis can be ill-defined and appear similar to a layering pleural effusion. In recumbent patients radiographic evidence of volume loss may not be as evident.


In lobar atelectasis the presence or absence of air bronchograms is useful to determine the potential effectiveness of airway clearance techniques. If air bronchograms are present, the atelectasis is most likely related to small airways collapse, and an inspiratory flow device, such as an incentive spirometer, may be useful in opening the collapsed alveoli. If air bronchograms are absent in lobar atelectasis, however, mucoid impaction is the most likely etiology, and airway clearance techniques, such as chest physiotherapy or acapella devices, have a high likelihood of providing clinical benefit. Noninvasive airway clearance techniques are just as effective in clearance of airway secretions as fiberoptic bronchoscopy; therefore bronchoscopy is generally reserved only for intractable cases.
Computed Tomography
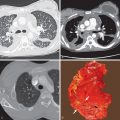
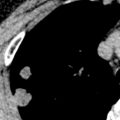
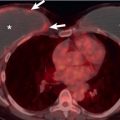
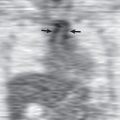
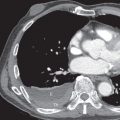
Computed tomography (CT) findings are similar to those seen on radiographs. Atelectasis is characterized on CT by increased density with volume loss and crowding of bronchi and vasculature, often within a defined anatomic distribution (e.g., subsegmental, segmental, or lobar) (see Fig. 69.2B ). An obstructing mucus plug may be identified proximal to the collapsed lung (see Fig. 69.3C ). Intravenous contrast can aid in distinguishing atelectasis from consolidation: Atelectasis should enhance greater than skeletal muscle, whereas consolidation often enhances either similar to or less than skeletal muscle ( Fig. 69.4 ). It is important to note that vessels enhance in both conditions and should not be confused for parenchymal enhancement.

Aspiration
Aspiration commonly occurs in critically ill patients, given that the risk of aspiration increases with decreased level of consciousness. Aspiration and its consequences can be thought of as a spectrum of clinicopathologic injury: aspiration of inert/nontoxic substances, aspiration pneumonitis, and aspiration pneumonia. Within the ICU, distinguishing aspiration pneumonitis from aspiration pneumonia based on clinical symptoms is imperative because pneumonitis typically does not require treatment, whereas aspiration pneumonia usually requires antibiotics. Severe aspiration events can lead to acute respiratory failure, sepsis, or ARDS. The severity of aspiration-related lung injury is related to the volume and type (i.e., inert substances vs. sterile gastric acid vs. oropharyngeal secretions colonized by bacteria) of aspirate. It is important to remember that an intubated patient with an inflated endotracheal tube cuff can still aspirate around the endotracheal cuff. In addition, gastric contents often become colonized by bacteria in ICU patients, given that all mechanically ventilated patients are placed on stress-ulcer prophylaxis (histamine 2–receptor antagonists or proton-pump inhibitors), which raises the gastric pH. This predisposes ICU patients to the development of aspiration pneumonia after aspiration of gastric contents.
Radiography
Aspiration may manifest as a focal or multifocal consolidative pattern ( Fig. 69.5 ). Poorly defined nodules in a small airway distribution also are commonly identified ( Fig. 69.6 ), resulting in a tree-in-bud appearance often seen on CT. Airway thickening, bronchiolar impaction, and volume loss also are frequently identified. Although the radiographic appearance of aspirated material varies, the chest radiograph may be normal in 10% of cases.


Aspiration pneumonitis may progress over the first day but usually begins to clear within a few days ( Fig. 69.7 ). Progression of consolidation with persistent/worsening clinical symptoms suggests the development of pneumonia. In a recumbent patient, aspiration is typically located in the posterior segments of the upper lobes, the superior segments of the lower lobes, and the posterior basilar segments of the lower lobes. This distribution results in a central predominance on a supine AP radiograph.

Computed Tomography
CT findings are similar to the radiographic findings of consolidative or tree-in-bud opacities in a dependent distribution (see Figs. 69.5B and 69.6B ). CT is more sensitive, however, in depicting the tree-in-bud pattern, the extent of aspiration, and the exact distribution. In addition, CT can show small airway filling and obstruction (see Fig. 69.5B ). It also better identifies complications such as lung abscess.
Pneumonia
There are multiple subcategorical definitions of pneumonia in ICU patients. Pneumonia in patients admitted from home or developing within the first 48 hours of hospital admission is defined as community-acquired pneumonia. If this patient has been hospitalized within the past 90 days, resides in a skilled nursing facility, or has received antibiotics/chemotherapy/wound care within 30 days, then it is classified as health care–associated pneumonia. Pneumonia that develops in a patient greater than 48 hours after admission is defined as nosocomial pneumonia and is most commonly seen in the ICU. When nosocomial pneumonia occurs in patients receiving mechanical ventilation for greater than 48 hours, it is termed ventilator-associated pneumonia (VAP). Accurately diagnosing pneumonia in the ICU requires a combination of predefined clinical symptoms, radiographic abnormalities, and laboratory analysis of respiratory secretions. According to the study by Alp and colleagues, the incidence of nosocomial pneumonia in the ICU was 6.8% using the established criteria by the Centers for Disease Control and Prevention. Of these nosocomial pneumonias, 75.5% were VAPs.
Radiography
The chest radiograph typically shows patchy areas of consolidation or poorly defined opacities that are often multifocal ( Fig. 69.8 ). Air bronchograms are helpful for the diagnosis of pneumonia but also occur with atelectasis. In contrast to atelectatic air bronchograms, pneumonia-related air bronchograms are not characterized by volume loss and “crowding” of the bronchi. Cavitation can occur and is a more specific finding of pneumonia when present. Radiographic changes in pneumonia typically develop more slowly than in atelectasis, aspiration, or pulmonary edema. Although pneumonia is commonly present in patients with ARDS, the chest radiograph has been found to be only 57% accurate in differentiating pneumonia without ARDS from non–pneumonic-induced ARDS.

Computed Tomography
Radiographs alone are generally adequate to evaluate pneumonia, but CT can be an asset in evaluating potential complications of pneumonia, such as developing cavitation or in determining the extent and character of parapneumonic effusions. In the setting of new ill-defined opacities on a background of preexisting consolidation, CT better differentiates the potential etiology of multifocal opacities and whether they stem from one or more than one process. Contrast-enhanced studies of pneumonia often show only mild or no enhancement of the involved parenchyma; however, hypoenhancement of parenchyma should raise concern for necrotizing pneumonia (see Fig. 69.4 ).
Pulmonary Edema
Pulmonary edema is a common cause for admission to critical care units and frequently develops during an ICU stay. Patients present with dyspnea and tachypnea and are often found to be hypoxic. Pulmonary edema can be subdivided into hydrostatic or increased permeability based on the mechanism of development.
Hydrostatic Pulmonary Edema
Hydrostatic pulmonary edema develops most commonly as a result of increased pulmonary venous pressures resulting from left-sided heart failure, renal failure/insufficiency, or hypervolemia.
Radiography
The classic findings of hydrostatic pulmonary edema include a widened vascular pedicle and pulmonary vascular congestion. Peribronchial cuffing, subpleural interstitial edema manifesting as fissural thickening, and vascular indistinctness are present in early interstitial pulmonary edema. As the pulmonary capillary pressure increases, interlobular septal thickening develops along with ground-glass opacities ( Fig. 69.9 ). Eventually, consolidative opacities develop. The findings are usually bilateral and symmetric. However, in acute mitral regurgitation, there is frequently right upper lobe predominance ( Fig. 69.10 ). Underlying chronic lung disease, such as emphysema, can also lead to an asymmetric distribution of pulmonary edema because of lack of involvement of areas occupied by bullae ( Fig. 69.11 ). In cardiogenic pulmonary edema, dependent consolidation and cardiomegaly are often present. Pleural effusions may be bilateral or unilaterally on the right. In contrast, in hydrostatic (noncardiogenic) pulmonary edema the consolidation is usually diffuse or peripheral ( Fig. 69.12 ), septal lines are uncommon, and heart size is normal.


Computed Tomography
Early findings of hydrostatic pulmonary edema, such as ground-glass opacities, airway thickening, and interlobular septal thickening, are better depicted on CT. Ground-glass opacities on CT tend to have a gravity-dependent distribution. Small pleural effusions are seen earlier on CT than on radiographs, and CT more accurately defines the location and extent of consolidation, when present ( Fig. 69.13 ).

Increased-Permeability Pulmonary Edema
Increased-capillary permeability pulmonary edema is synonymous with nonhydrostatic and noncardiogenic pulmonary edema. Etiologies include pulmonary causes (e.g., aspiration pneumonitis, bacterial pneumonia, thoracic trauma) and extrapulmonary causes (e.g., sepsis, neurogenic pulmonary edema, extrathoracic trauma, pancreatitis, and drug toxicity).
Radiography
The typical radiographic appearance consists of extensive bilateral airspace opacities ( Figs. 69.14 and 69.15 ). The distribution is usually initially patchy but rapidly progresses to a diffuse distribution. The distribution of opacities from pulmonary causes tends to be more asymmetric and patchy, whereas that of extrapulmonary causes tends to be symmetric, diffuse, and homogeneous. Air bronchograms are commonly identified. Septal lines are uncommon. The vascular pedicle, heart size, and pulmonary vascular size are usually normal.


Radiographically distinguishing hydrostatic from increased permeability pulmonary edema can be difficult. The most useful distinguishing feature is that increased permeability pulmonary edema has a much higher incidence of a patchy peripheral distribution than hydrostatic pulmonary edema. Although a widened vascular pedicle, pulmonary vascular engorgement, and pleural effusions are more commonly identified in hydrostatic pulmonary edema, these findings also may be present with noncardiogenic pulmonary edema. Furthermore, the two entities frequently coexist, which further complicates interpretation.
Related posts:
Stay updated, free articles. Join our Telegram channel

Full access? Get Clinical Tree


