Imaging Presentation
Large, lobulated heterogeneously enhancing mass was shown centered at the sacrococcygeal junction. On CT the mass involves the lower sacrum and coccyx causing bone destruction ( Figs. 16-1 and 16-2 ) . Portions of the remaining sacral vertebrae adjacent to the mass are sclerotic. The mass contained focal calcifications or islands of remnant vertebral bone. The mass is T1 hypointense and T2 hyperintense relative to the normal sacral vertebrae ( Figs. 16-3 to 16-5 ) .


Discussion
Chordomas are bone tumors that arise from embryologic remnants of the notochord. They represent approximately 3% of malignant bone tumors; 50% of them arise from the sacrococcygeal region, 35% in the clival region, and 15% from the vertebral bodies. Vertebral body chordomas most commonly occur in the cervical region, next most commonly in the lumbar region, and least commonly in the thoracic spine.
Chordomas usually manifest as slowly growing tumors in middle-aged patients, usually presenting between the ages of 30 and 70. Manifesting symptoms depend on the tumor location. Sacrococcygeal chordomas are twice as common in males as in females, but there is an equal male-female incidence in clival chordomas. Sacrococcygeal chordomas extend far more commonly anterior to the sacrum than posteriorly. Sacrococcygeal tumors manifest as painful swellings in the sacrococcygeal region. Vertebral chordomas may be associated with pain, numbness, weakness, and bowel or bladder dysfunction, secondary to cord compression. Thoracic chordomas may present with pain, swallowing difficulty, and hoarseness if they extend into the posterior mediastinum. Posterior mediastinal chordomas can be highly malignant tumors.
Chordomas are malignant tumors that commonly recur locally and less commonly metastasize to the lymph nodes, lungs, or other bones. The 5-year survival rate is approximately 75% and 10-year survival is 35%.
Chordomas are usually soft, bulky lobulated masses when they manifest. They arise from the bone but almost always have an extraosseous soft tissue component. There are three histologic subtypes: (1) Clear cell tumors (most common type) contain intracytoplasmic vacuoles within “physaliphorous” cells. They typically have a mucoid matrix divided by multiple fibrous septations. (2) Chondroid tumors contain cartilaginous tissue, usually type II collagen, and often have immunohistochemical markers including cytokeratin (CK), epithelial membrane antigen (EMA), and sometimes carcinoembryonic antigen (CEA). Chondroid chordomas arise most commonly at the spheno-occipital synchondrosis, where they involve the adjacent clivus. (3) Sarcomatous chordoma is a highly malignant, poorly differentiated tumor.
Imaging Features
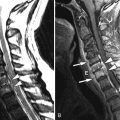
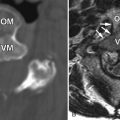
Chordoma is a heterogeneous bone-destroying tumor involving the sacrococcygeal region, clivus, or vertebral body. Vertebral body lesions often are associated with a bulky anterior epidural mass that may compress the spinal cord. On CT, amorphous clumps of calcification or islands of residual bone are often contained in the tumor, more common in sacrococcygeal tumors (see Figs. 16-1 and 16-2 ). A combination of bone destruction and adjacent bone sclerosis is typical (see Figs. 16-1 and 16-2 ). The tumor is usually heterogeneous on CT and magnetic resonance (MR) imaging. With MR, the tumor contains heterogeneous tissue that is predominantly T1 hypointense and T2 hyperintense (see Figs. 16-3 and 16-4 ). The tumor contains prominent T2 hypointense septations in up to 70% of cases (see Fig. 16-3 ). Areas of hemorrhagic necrosis are common within the tumor. The foci of T2 hypointensity in chordomas usually represent hemosiderin. Calcifications occur in only 15% of chordomas, but remnants of native bone within the tumor secondary to bone destruction are common in clival and sacrococcygeal chordomas. Intense heterogeneous enhancement is typical after IV contrast administration, but some tumors enhance to a far lesser degree (see Figs. 16-4 and 16-5 ). The tumor may cause neural foraminal marginal expansion and erosion. Foraminal tumors can have a dumbbell configuration.
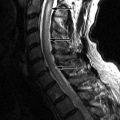
With vertebral chordomas, the anterior portion of the vertebral body is usually spared. The epidural or paraspinal component of vertebral chordomas is often greater than the bony portion of the vertebral tumor ( Figs. 16-6 and 16-7 ) . The epidural tissue characteristically extends along the posterior or lateral annular margins of adjacent vertebral bodies and drapes across the posterior or lateral margin of the adjacent disc (see Figs. 16-6 and 16-7 ). This pattern of spread is highly suggestive of vertebral chordoma. The epidural component of the tumor classically has been described as having a “mushroom” shape or “collar button” configuration that spans one to three vertebrae, contacting the posterior margin of adjacent intervertebral discs.


Cervical chordomas may span multiple contiguous vertebral levels. The tumor may involve the posterior portion of the intervertebral disc, which is not surprising because the posterior portion of the nucleus pulposus is the last developing structure to undergo notochordal regression.
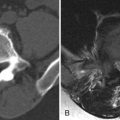
Chordomas most commonly occur at the skull base involving the clivus. Clival chordomas usually manifest as lobulated, prepontine masses that invade and destroy the clivus. They may contain clumps of calcification and typically enhance heterogeneously ( Fig. 16-8 ) .

Differential Diagnosis of Sacrococcygeal and Sacral Chordoma
- 1
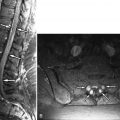
Sacral metastases: These can occur anywhere in the sacrum but more commonly involve the upper or mid portion of the sacrum. Sacral metastases typically are heterogeneous marrow-infiltrating lesions associated with bone destruction and usually enhance heterogeneously ( Fig. 16-9 ) .

Figure 16-9
Sacral Metastasis Originating from Myoepithelial Carcinoma of the Right Parotid Gland.Related posts:

Stay updated, free articles. Join our Telegram channel

Full access? Get Clinical Tree