Chapter 11
Chronic hepatitis and liver cirrhosis
Ersan Altun1, Mohamed El-Azzazi1,2,3,4, Richard C. Semelka1, and Mamdoh AlObaidy1,5
1The University of North Carolina at Chapel Hill, Department of Radiology, Chapel Hill, NC, USA
2University of Dammam, Department of Radiology, Dammam, Saudi Arabia
3King Fahd Hospital of the University, Department of Radiology, Khobar, Saudi Arabia
4University of Al Azhar, Department of Radiology, Cairo, Egypt
5King Faisal Specialist Hospital & Research Center, Department of Radiology, Riyadh, Saudi Arabia
- Chronic liver diseases progress to the formation of liver fibrosis and cirrhosis. The most common chronic liver diseases are non-alcoholic fatty liver disease, chronic hepatitis C infection, chronic hepatitis B infection, and alcoholic hepatitis. Other, less prevalent chronic liver diseases include autoimmune hepatitis, primary biliary cirrhosis, primary sclerosing cholangitis, Wilson’s disease, hereditary hemochromatosis, congenital hepatic fibrosis, alpha-1-antitrypsin deficiency, and cystic fibrosis.
- Repetitive hepatocyte injury from various causes leads to the development of liver fibrosis, which is characterized by deposition of an abundant volume of collagen and proteoglycans in the extracellular matrix. Collagen is produced in excess amounts by hepatic stellate cells induced by fibrogenic cytokines.
- Development of liver fibrosis is a component of wound-healing mechanism. Therefore, liver fibrosis on its own is reversible and may regress initially. However, progressive liver fibrosis due to repetitive and chronic injury may lead to cirrhosis, which is an irreversible condition.
- The pattern of fibrosis pathologically differs for chronic viral hepatitis, and fatty liver disease/alcoholic hepatitis.
- In chronic viral hepatitis, fibrosis starts in the portal triads characterized by focal fibrotic expansion of portal triads (stage F1). The extension of thin fibrous septa, arising from the expanded portal triads, into the adjacent liver parenchyma occurs in the next stage (stage F2). Further thickening and elongation of fibrous septa lead to the formation of fibrous bridges connecting adjacent portal triads and central veins (stage F3). Further enlargement and merging of fibrous bridges divide the liver parenchyma and lead to the formation of regenerative nodules surrounded by fibrous tissue (stage F4).
- In alcoholic hepatitis and nonalcoholic fatty liver disease, fibrosis starts adjacent to the central veins in a perisinusoidal manner (zone 3 perisinusoidal fibrosis) (stage F1). Further involvement of portal tracts with fibrosis (zone 1 periportal fibrosis) occurs in the next stage (stage F2). Further thickening and elongation of fibrous septa lead to the formation of fibrous bridges connecting adjacent portal triads and central veins (stage F3). Further enlargement and merging of fibrous bridges divide the liver parenchyma and lead to the formation of regenerative nodules surrounded by fibrous tissue (stage F4).
- Advanced stages of liver fibrosis and cirrhosis may present similar pathological findings and may be indistinguishable from each other because histopathological features of fatty liver disease is lost with advanced fibrosis and cirrhosis.
- Cirrhosis is not a static phenomenon but a dynamic process, including the histopathological findings of inflammation, cell injury and death, fibrosis and regeneration.
- The presence of regenerative nodules surrounded by fibrosis is the hallmark of cirrhosis. Regenerative nodules may also be occasionally seen without the development of fibrosis, as in nodular regenerative hyperplasia, Budd-Chiari syndrome, portal vein thrombosis, or massive hepatic injury. Extensive fibrosis without formation of regenerative nodules may also be seen occasionally as in congenital hepatic fibrosis.
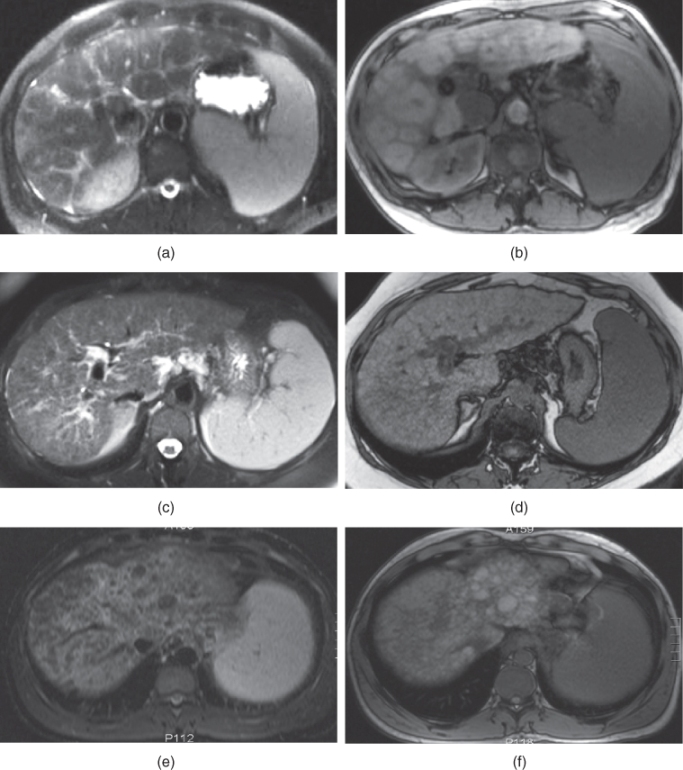
Figure 11.1 Transverse T2-weighted SS-ETSE (a, c, e) and T1-weighted out-of-phase 2D-GE (b, d, f) images demonstrate three different patients with macronodular, micronodular, and mixed macronodular-micronodular cirrhosis. The first patient with macronodular cirrhosis shows multiple large regenerative nodules (a, b). The second patient with micronodular cirrhosis shows multiple diffuse small regenerative nodules (c, d). The third patient with mixed macronodular–micronodular type cirrhosis shows the presence of combination of small and large regenerative nodules. Note that regenerative nodules show similar signal or low signal compared to the background liver on T2-weighted images and similar signal or high signal (due to protein content) on out-of-phase T1-weighted images.
- Classification of Cirrhosis based on Nodule Size:
- Micronodular: Often observed with diffuse liver injury due to alcohol or metabolic disorders such as nonalcoholic steatohepatitis. Primary biliary cirrhosis, primary sclerosing cholangitis, hereditary hemochromatosis, and Wilson’s disease may cause micronodular cirrhosis.
- Small regenerative nodules (<3-mm in diameter).
- Figure 11.1.
- Macronodular: Liver injury predominantly resulting in hepatocellular regeneration is more commonly associated with this pattern. Viral hepatitis and toxic hepatitis are the most common cause. Primary sclerosing cholangitis, Wilson’s disease and alpha-1-antitrypsin deficiency can also cause macronodular cirrhosis.
- Large regenerative nodules (>3-mm in diameter)
- Figure 11.1.
- Mixed: Macronodular pattern develops with advancing cirrhosis, and therefore micronodular and macronodular patterns are both seen in most disease processes (Figure 11.1).
The differentiation between micronodular and macronodular pattern has very limited clinical value.
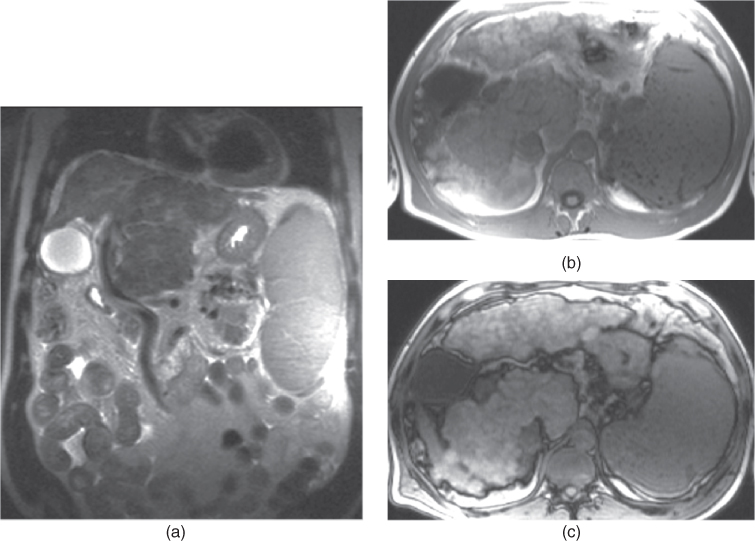
Figure 11.2 Coronal T2-weighted SS-ETSE (a), T1-weighted 2D-GE in-phase (b) and out-of-phase (c) images demonstrate a cirrhotic liver with severely nodular contours, caudate lobe hypertrophy, right lobe atrophy and left lobe hypertrophy. Note the enlarged spleen containing Gamna–Gandy bodies which are seen as hypointense nodules on in-phase T1-weighted image (b) and less distinct on out-of-phase image (c) due to their iron deposition.
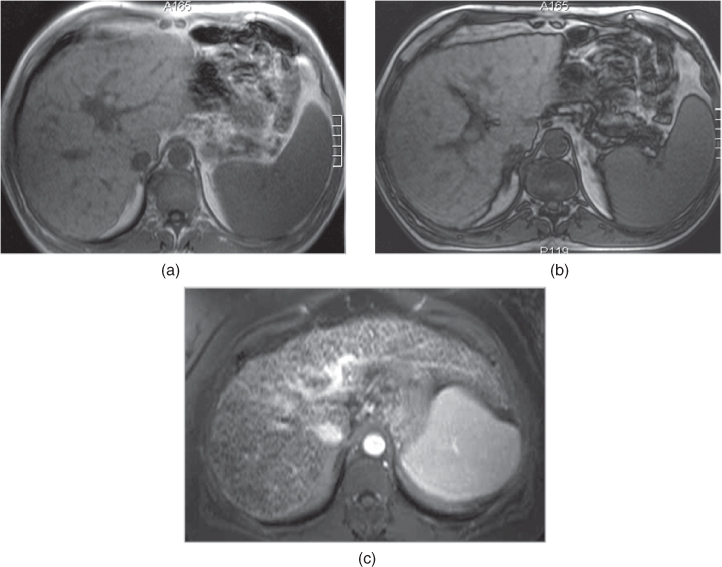
Figure 11.3 Transverse T1-weighted in-phase 2D-GE (a), out-of-phase 2D-GE (b) and postgadolinium interstitial phase 3D-GE (c) images show cirrhotic liver in three different patients with cirrhosis. The first two patients demonstrate moderate fibrosis (a, b) and the third patient shows severe fibrosis (c). The contours of the liver appear mildly nodular in the first two patients and reticular fibers are appreciated particularly on the periphery. The contours of the liver appear again mildly nodular in the third patient; however, the reticular fibers are very prominent and thick. Note that the out-of-phase image (b) shows the nodular contours better compared to the in-phase image (a).
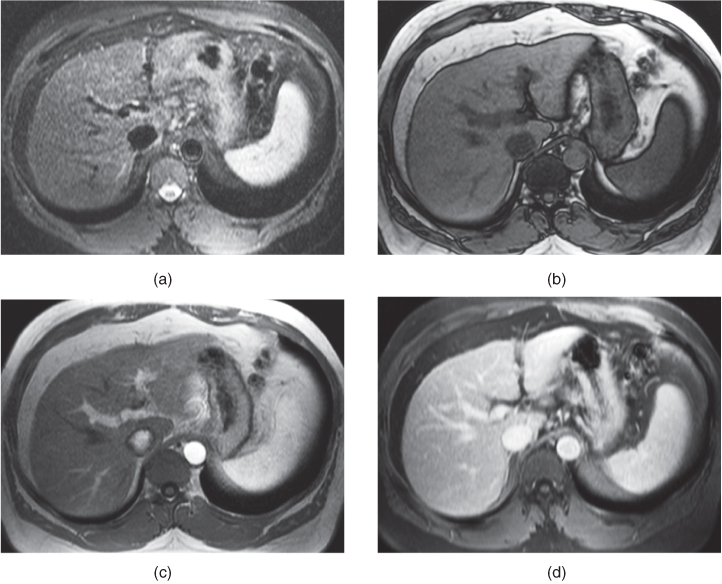
Figure 11.4 Transverse T2-weighted fat-suppressed SS-ETSE (a), T1-weighted out-of-phase 2D-GE (b), T1-weighted postgadolinium hepatic arterial dominant phase 2D-GE (c) and T1-weighted fat-suppressed interstitial phase 3D-GE images show mild reticular fibrosis. Note that the contours of the liver appear normal. Mild reticular network is seen on T2-weighted (a), T1-weighted out-of-phase (b) and postgadolinium interstitial phase (d) images.
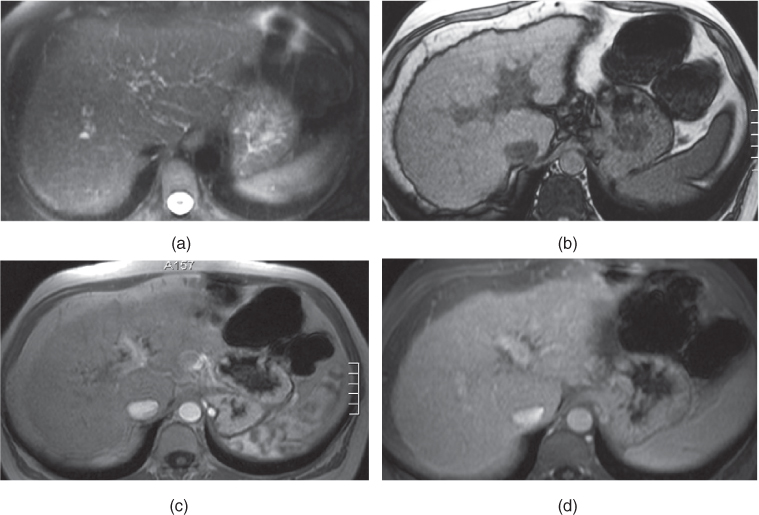
Figure 11.5 Transverse T2-weighted fat-suppressed SS-ETSE (a), T1-weighted out-of-phase 2D-GE (b), T1-weighted postgadolinium hepatic arterial dominant phase 2D-GE (c) and T1-weighted fat-suppressed interstitial phase 3D-GE images show moderate reticular fibrosis. Note that the contours of the liver appear mildly nodular and moderate reticular network is well seen on out-of-phase image (b) and postgadolinium interstitial phase image (d).
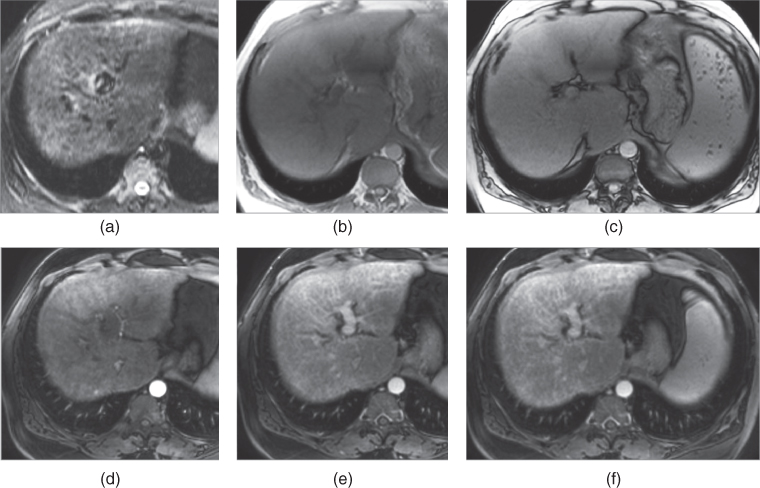
Figure 11.6 Transverse T2-weighted fat-suppressed SS-ETSE (a), T1-weighted in-phase (b) and out-of-phase 2D-GE (c), T1-weighted fat-suppressed postgadolinium hepatic arterial dominant phase (d), hepatic venous (e) and interstitial phase (f) 3D-GE images show moderate reticular fibrosis. The contours of the liver appear normal to mildly nodular. Moderate reticular network is best seen on the interstitial phase postgadolinium image (f). The fibrotic network is not well seen on the out-of-phase image due to low contrast resolution of T1-weighted images, which are acquired at 3.0 T. Note that the caudate lobe is hypertrophic and right lobe is atrophic.
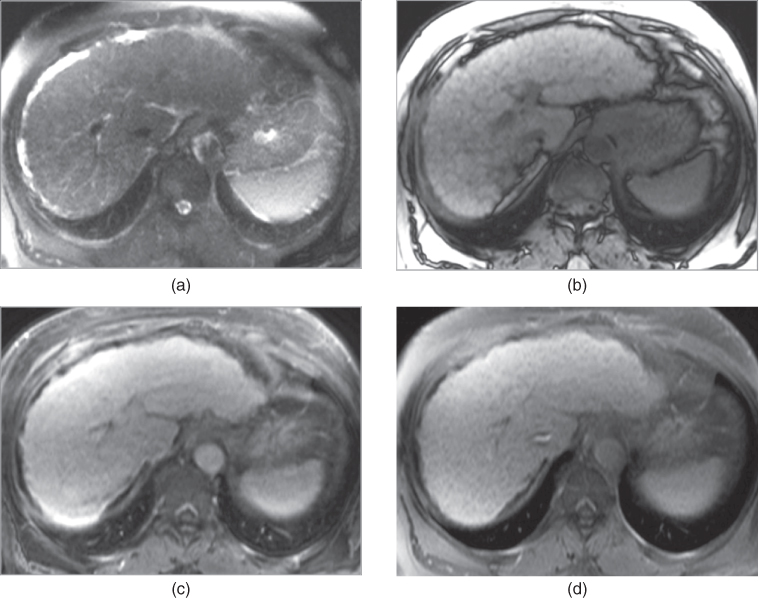
Figure 11.7 Transverse T2-weighted fat-suppressed SS-ETSE (a), T1-weighted out-of-phase 2D-GE (b), T1-weighted postgadolinium fat-suppressed hepatic venous phase (c) and interstitial phase (d) 3D-GE images show severely nodular liver contour and severe reticular fibrotic network, which are best seen on out-of-phase image (b) and interstitial phase image (d).
- General Morphologic features of Chronic Hepatitis and Cirrhosis of the liver on MRI and CT:
- Features of Chronic Hepatitis
- The liver appears normal in the early stages of chronic hepatitis.
- Chronic hepatitis may progress to cirrhosis, showing the development of fibrosis.
- Enlarged portahepatis, gastrohepatic, reptroperitoneal lymph nodes may be present.
- Features of Cirrhosis
- Atrophy of the right lobe and the medial segment of the left lobe (Figure 11.2).
- Relative sparing and/or hypertrophy of the caudate lobe and lateral segment of the left lobe (Figure 11.2).
- Irregular hepatic contour due to the presence of regenerative nodules and fibrosis.
- Enlargement of the hilar periportal space.
- Expansion of the major interlobar fissure causing extrahepatic fat to fill the space between the left medial and lateral segments.
- Expanded gallbladder fossa, which is filled with fat.
- Enlarged porta hepatis, gastrohepatic, celiac, paracaval or retroperitonel lymph nodes.
- Associated with mesenteric, omental, retroperitoneal edema and omental hypertrophy.
- Relative sparing and/or hypertrophy of the caudate lobe and lateral segment of the left lobe (Figure 11.2).
- Morphologic features of Fibrosis of the liver on MRI and CT:
- Liver fibrosis may be classified into two types, reticular and confluent.
- Reticular type: A network of linear fibrotic stroma of varying thickness. Reticular type of fibrosis can be classified morphologically into three major types according to the thickness of reticular fibers (Figure 11.3).
- Mild: <2 mm. The contours of the liver appear normal (Figure 11.4).
- Moderate: >2 mm. The contours of the liver appear mildly undulating (Figures 11.5 and 11.6).
- Severe: >2 mm. The contours of the liver appear nodular and undulating (Figure 11.7).
- Confluent type: Commonly appears as a peripheral triangular area with its apex directed to the porta hepatis. It is commonly seen in segment VIII.
- On CT: The sensitivity of CT is low and therefore mild to moderate reticular fibrosis is not seen. Severe reticular fibrotic network appears as hypoattenuating fibrotic bands associated with contour undulation. Postcontrast CT examination on the interstitial phase is more sensitive compared to noncontrast CT examination. Confluent fibrosis appears as a focal hypoattenuating lesion, which shows progressive enhancement.
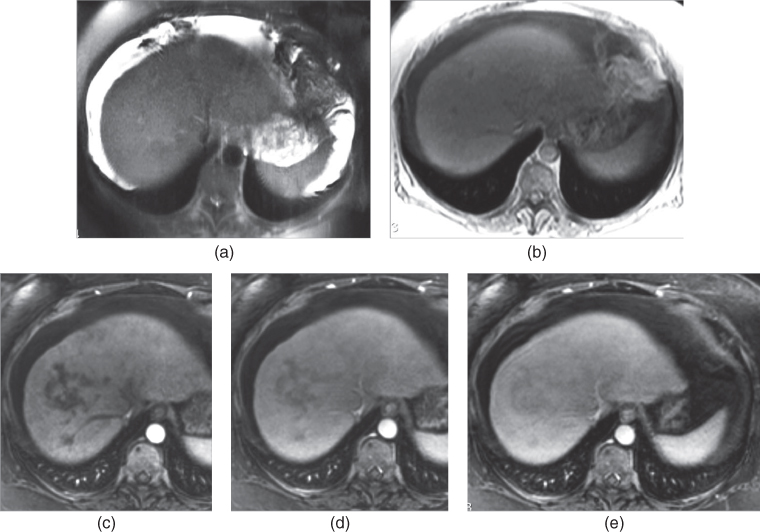
Figure 11.8 Transverse T2-weighted fat-suppressed SS-ETSE (a), T1-weighted in-phase 2D-GE (b), T1-weighted fat-suppressed postgadolinium hepatic arterial dominant phase (c), hepatic venous (d) and interstitial phase (e) 3D-GE images show confluent fibrosis at segment VIII. The confluent fibrosis shows mild T2 signal on T2-weighted image (a) and isointense signal on T1-weighted image (b). On postgadolinium images, the confluent fibrosis does not show enhancement in the hepatic arterial dominant phase (c) but demonstrates progressive enhancement in the later phases, which is more prominent in the interstitial phase. The fibrosis shows subtle high T2 signal representing its chronic nature.
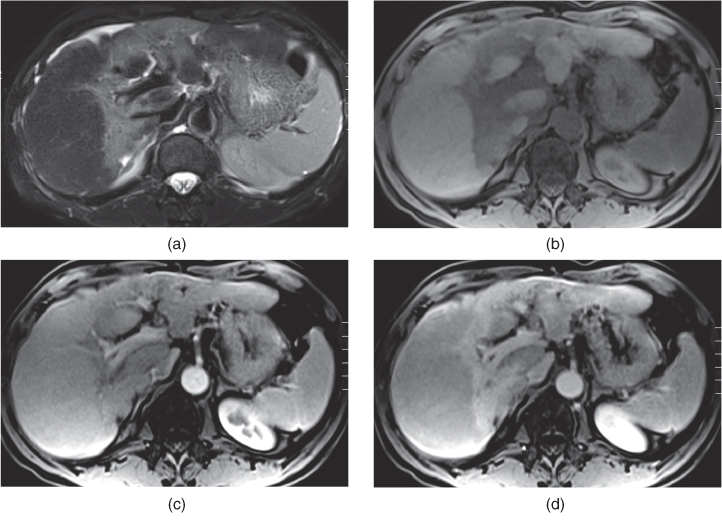
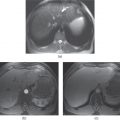
Figure 11.9 Transverse T2-weighted fat-suppressed SS-ETSE (a), T1-weighted fat-suppressed 3D-GE (b), T1-weighted fat-suppressed postgadolinium hepatic arterial dominant phase (c), hepatic venous (d) and interstitial phase (e) 3D-GE images show prominent wedge-shaped and patchy confluent fibrosis in this patient with cirrhosis. The fibrosis shows moderately high T2 signal due to its relatively acute nature. The fibrosis shows mild enhancement in the hepatic arterial dominant phase and prominent enhancement in the interstitial phase.
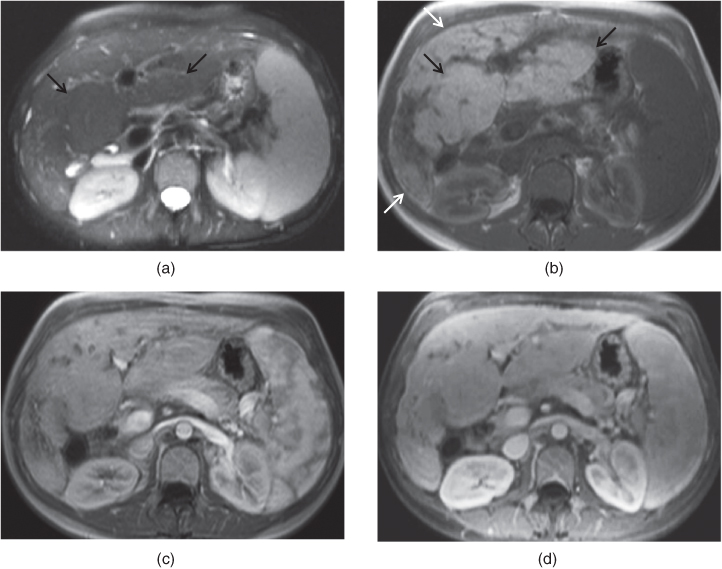
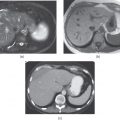
Figure 11.10 Transverse T2-weighted fat-suppressed SS-ETSE (a), T1-weighted in-phase 2D-GE (b), T1-weighted postgadolinium hepatic arterial dominant phase (c) and fat-suppressed hepatic venous phase (d) 3D-GE images demonstrate advanced cirrhosis due to primary sclerosing cholangitis. The right lobe is prominently atrophic. Prominent central regeneration of the left lobe and caudate lobe (black arrows; a, b) and peripheral atrophy of the left and right lobes (white arrows; b) are seen.
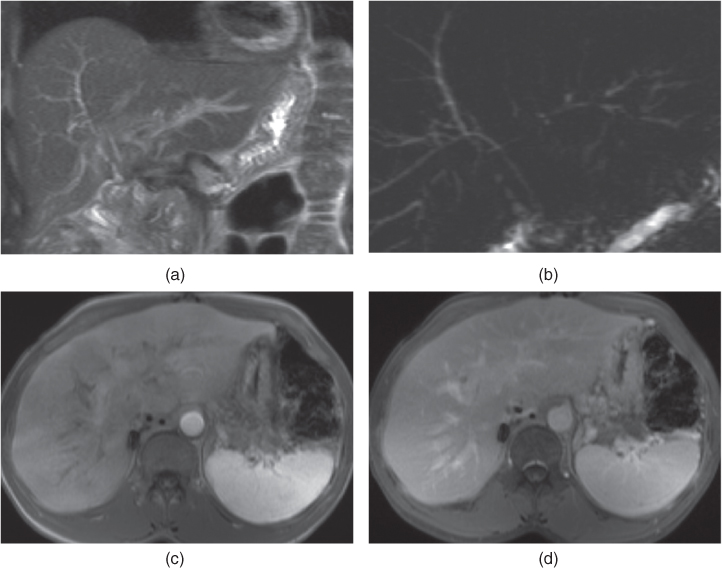
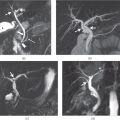
Figure 11.11 Coronal T2-weighted SS-ETSE (a), coronal MIP MRCP (b), transverse T1-weighted hepatic arterial dominant phase 2D-GE (c) and fat-suppressed interstitial phase 3D-GE (d) images demonstrate findings of early cirrhosis secondary to primary sclerosing cholangitis in a patient with liver transplant. Intrahepatic bile ducts demonstrate pruned tree appearance associated with focal mild dilatation and strictures, which are more prominent on the left sided intrahepatic ducts (a, b). The lateral segment of the left lobe appears enlarged and shows central regeneration. Diffuse wedge-shaped and patchy early increased enhancement in the liver on the hepatic arterial dominant phase (c), which fade on the later phases (d). Early increased enhancement likely results from early transient perfusional abnormality.

Stay updated, free articles. Join our Telegram channel
- Repetitive hepatocyte injury from various causes leads to the development of liver fibrosis, which is characterized by deposition of an abundant volume of collagen and proteoglycans in the extracellular matrix. Collagen is produced in excess amounts by hepatic stellate cells induced by fibrogenic cytokines.

Full access? Get Clinical Tree


