Magnetic resonance spectroscopy (MRS) is a valuable tool for imaging brain tumors, primarily as an adjunct to conventional imaging and clinical presentation. MRS is useful in initial diagnosis of brain tumors, helping differentiate tumors from possible mimics such as metastatic disease, lymphoma, demyelination, and infection, as well as in the subsequent follow-up of patients after resection and chemoradiation. Unfortunately, the spectroscopic appearance of many pathologies can overlap, and ultimately follow-up or biopsy may be required to make a definitive diagnosis. Future developments may continue to increase the value of MRS for initial diagnosis, treatment planning, and early detection of recurrence.
Key points
- •
Magnetic resonance spectroscopy (MRS) is an advanced MR imaging technique that allows noninvasive evaluation of tissue molecular composition.
- •
High-grade neoplasms, including brain tumors, have elevation of choline, a marker of cell membrane turnover, with decrease in N-acetyl aspartate, a marker of neuronal integrity.
- •
The most frequent applications of MRS in brain tumor care are differentiating tumor from other non-neoplastic pathology, estimating tumor grade, and differentiating tumor recurrence from radiation effects.
- •
Many pathologies overlap in spectroscopic appearance, and MRS is best interpreted in conjunction with other imaging findings and clinical considerations.
- •
Future developments may make whole-brain spectroscopic imaging a useful tool for prognostication and treatment planning.
Introduction
Magnetic resonance spectroscopy (MRS) is a technique that combines the ability of nuclear magnetic resonance (NMR) to differentiate molecules with the imaging features of localization unique to MR imaging. This provides a “molecular window” into the component chemistry of a given tissue, allowing for unique insight into physiologic or disease (pathophysiologic) processes. MRS requires no injected contrast agent and no ionizing radiation is involved, which are obvious safety benefits.
There are many applications of MRS to imaging of brain tumors that have been explored, some of which have already reached clinical practice and others that have been confined predominantly to research applications ( Table 1 ). In clinical application, MRS can potentially differentiate primary brain tumors from other potential mimics, such as demyelinating disease, lymphoma, or infection. In addition, the “molecular signatures” of high-grade and low-grade tumors often differ, allowing prediction of how aggressive a tumor may be. After treatment, MRS can provide insight into whether treated tissue consists predominantly of radiation necrosis or tumor, a considerable diagnostic dilemma. More research-oriented applications include surveying a tumor to locate the most aggressive area to target for biopsy and radiation therapy by using high-resolution whole brain spectroscopic MR imaging.
| Clinical Applications | Research Applications |
|---|---|
|
|
MRS has several limitations that have prevented it from reaching its full potential in brain tumor imaging. Despite the theoretic ability to differentiate tissues of different types, there is substantial overlap between the spectroscopic appearances of different diseases. MRS can be time-consuming and highly variable between different imaging locations; moreover, artifacts often limit evaluation.
This work provides an overview of the use of MR spectroscopy in brain tumor imaging, including general imaging principles and technique, key imaged metabolites, the typical appearance of overlapping disease processes, and practical limitations on MRS. The second section discusses ongoing development of new applications likely to have an impact on clinical care in coming years.
Imaging technique
Early in the development of NMR, it was discovered that nuclei in different molecular environments resonated at slightly different frequencies. In simplest terms, when subjected to an applied magnetic field, molecules precess at a resonant frequency that varies with the surrounding molecular environment. This effect, known as chemical shift, allows nuclei in different chemical environments to be distinguished based on their resonant frequencies. A shielding parameter, defined in parts per million (ppm), describes the relative change compared with a reference compound. The shielding parameter is a constant, whereas the chemical shift measured in Hz increases linearly with field strength. As a result, the resolution of spectroscopy increases with increasing field strength.
Most imaging spectroscopy applications image the hydrogen nucleus ( 1 H) because it is the most prevalent nucleus in tissue. Spectroscopy of other elements is possible, although not used widely in practice. For in vitro proton ( 1 H) spectroscopy, chemical shift values (δ) are reported in ppm relative to a tetramethylsilane (TMS). In vivo, compounds such as TMS are not available, so usually one of the indigenous spectral signals is used as a reference (eg, for the brain, the N-acetyl resonance of N-acetyl aspartate (NAA), set at 2.02 ppm, is often used).
Virtually all MRS studies are performed by collecting time domain data after application of either a 90° pulse, or an echo-type of sequence. The time domain signal is then converted to the frequency domain through Fourier transformation, which allows the viewing of the signal intensity as a function of frequency (ie, in the frequency domain). To accumulate sufficient signal to noise ratio (SNR), the scan can be repeated many (N) times and averaged together to improve SNR, which is proportional to the <SPAN role=presentation tabIndex=0 id=MathJax-Element-1-Frame class=MathJax style="POSITION: relative" data-mathml='√N’>√?√N
√ N
. Choosing an appropriate N and scan repetition time (TR) is required to balance image acquisition time and optimize SNR. , Successful 1 H MRS also requires water and lipid suppression techniques, because water and lipids are present at concentrations many-fold higher than target metabolites, which are usually present in the millimolar range. Magnetic field homogeneity and field strengths must be sufficient to allow resolution of the relatively small chemical shift range of protons (∼10 ppm). Large and/or membrane-associated molecules are not usually well-seen, although their broad resonances contribute to the baseline of the spectrum.
The information from a brain MR spectrum depends on several factors, such as the field strength, echo time, and type of pulse sequence. On a 1.5 T scanner with long echo times (TE) (eg, 140 or 280 ms), only choline (Cho), creatine (Cr), and NAA are typically observable in healthy adult brain, whereas compounds such as lactate, alanine, or others may be detectable if their concentrations are elevated above normal levels due to abnormal metabolic processes. At short TE ( <SPAN role=presentation tabIndex=0 id=MathJax-Element-2-Frame class=MathJax style="POSITION: relative" data-mathml='≤’>≤≤
≤
35 ms), additional compounds, including glutamate, glutamine, myo-inositol, lipids, and other macromolecules may become detectable.
Spatial localization allows signals to be recorded from well-defined structures or lesions within the brain. In the 1980s, a wide range of spatial localization techniques were developed for in vivo spectroscopy ; however, many were either difficult to implement, involved too many radiofrequency pulses, or were inefficient. Out of this plethora of sequences, 2 emerged as simple and robust enough for wider use, each based on 3 slice-selective pulses applied in orthogonal directions. The STEAM sequence (Stimulated Echo Acquisition Mode) uses three 90° pulses and detects the resulting stimulated echo from the volume intersected by all 3 pulses, whereas the PRESS sequence (Point REsolved Spectroscopy Sequence) , uses one 90° pulse and two 180° pulses to detect a spin echo from the localized volume. The sequence is designed so that signals from other regions outside the desired voxel are eliminated (usually by using crusher gradients). , Typical voxel sizes for brain 1 H MRS are approximately 8 cm. Multi-voxel (2-dimensional [2D], or 3-dimensional [3D]) PRESS magnetic resonance spectroscopic imaging (MRSI) sequences are available on commercial MR scanners from most scanner vendors and are the most commonly applied MRS technique.
Metabolites
The most described metabolites in brain tumor spectroscopy are choline, NAA, creatine, lipids, myo-inositol, and lactate (summarized in Table 2 ). A representative normal spectrum from the cerebral hemisphere is shown in Fig. 1 . The area under each curve represents the number of spins identified; however, this result is only quantitative if an external reference (of known concentration) is used. As such, the areas under the curve are usually evaluated in a relative fashion. Some systems automatically produce relative area under the curve numbers. In the absence of these numbers, peak height is often used as a surrogate marker. Although alterations in the concentrations of each of these metabolites can be seen with various pathologies, a combination of the relative changes of these various metabolites in conjunction with other imaging features can be useful in distinguishing primary brain tumors from metastases, grading gliomas, and distinguishing recurrence from radiation necrosis. Sometimes, ratios of metabolites (such as Cho/Cr, or Cho/NAA) can be used to increase the sensitivity of a particular measure. In practice, this is one of the most commonly used approaches.
| Metabolite | ppm | Elevated in | Decreased in | Clinical Significance in Brain Tumor Imaging |
|---|---|---|---|---|
| Choline | 3.2 ppm | Neoplasms Inflammation Gliosis | Necrosis | Grading gliomas Distinguishing glioblastomas for metastases Radiation planning in gliomas Differentiating tumor progression vs pseudoprogression/Radionecrosis |
| N-acetyl aspartate | 2.0 ppm | Gliomas and more so in high-grade gliomas Radiation necrosis Metastases Lymphoma | Grading of gliomas Distinguishing gliomas from metastases | |
| Creatine | 3.0 ppm | High-grade gliomas Necrosis | Grading of gliomas Distinguishing metastases from glioblastoma | |
| Lactate | 1.3 ppm | Glioblastoma Abscesses | Not present in normal spectra | Grading of gliomas |
| Lipids | 1.3 ppm with inversion at intermediate echo time | Glioblastoma Abscess Lymphoma Metastases | Grading of gliomas | |
| Myo-Inositol | 3.5 ppm | Low-grade gliomas Progressive multifocal encephalopathy | High-grade gliomas | Grading of gliomas |
| 2-Hydroxyglutarate | 2.5 ppm | Isocitrate dehydrogenase (IDH)-1 positive tumors | Detection of IDH-1 positive tumors |

Cho (3.2 ppm) is a precursor of acetylcholine, a component of cell membranes. Elevated Cho is a marker of increased cell turnover, which can be seen with tumors and other proliferative processes. In combination with other imaging features, elevated Cho can identify high cellular turnover pathologies like gliomas and lymphoma compared with other pathologies with lower cellularity, such as radiation necrosis or infarction. ,
NAA (2.0 ppm) is synthesized from acetylation of the amino acid aspartate in the neuronal mitochondria and is a marker of neuronal viability. Reduction of NAA is seen in many pathologies, such as glioma and radiation necrosis, which involve destruction or replacement of neurons. Lymphoma or metastases tend to show low or absent NAA levels due to lack of neurons in the tumor component.
Cr (3.0 ppm) has a role in storage and transfer of energy in neurons that have high metabolism. Cr is relatively maintained across a number of disease processes and serves as an internal control which can be used for ratio calculations, such as Cho/Cr.
Lactate (Lac, 1.3 ppm) is a marker of anerobic metabolism and is not seen in normal adult brain spectra due to exclusive aerobic metabolism in brain. Lactate is visualized in necrotic tissues with anerobic metabolism which include abscesses and high-grade tumors. , Lactate overlaps with lipids at short TE, shows inversion at intermediate TE, and has a characteristic double peak at longer TE.
Lipids (Lip, 1.3 ppm) are components of cell membrane and are increased in diseases with high cell turnover rates such as high-grade gliomas (HGGs). However this is not a specific feature and can be see with other pathologies with high cell turnover/destruction such as abscesses, infarction, and metastases.
Myo-Inositol (MI, 3.5 ppm) is a precursor of phosphatidylinositol (a phospholipid) and of phosphatidylinositol 4,5-bisphosphate. Elevations of MI are seen in low-grade gliomas; in contradistinction, reduction seen in World Health Organization grade IV gliomas and can be a useful marker in grading gliomas. Elevation of MI can also be seen with other pathologies like dementia of Alzheimer type and progressive multifocal leukoencephalopathy.
2-Hydroxyglutarate (2-HG, 2.25 ppm) is an oncometabolite of increasing interest in recent times. Tumors with isocitrate dehydrogenase (IDH-1) mutations accumulate higher levels of 2-HG, and as a result detection of 2-HG can be used with reasonable accuracy for noninvasive detection of IDH-1 mutant gliomas.
Other metabolites have been described in the research setting, including metabolites of other nuclei. , However, these have demonstrated little clinical importance.
Clinical relevance: diagnosis
Years ago, brain tumor workups commonly involved a 2-step process including an initial needle biopsy followed by a more definitive surgical resection. The transition to what is usually a single (initial) surgery has been ushered along by developments in neuroimaging, including advanced techniques. MRS is one of those techniques and, along with other methods, this constellation of imaging tools essentially serves as a sort of “virtual biopsy.” In complex cases, such an approach can be used to differentiate gliomas from other diagnoses such as metastases, lymphoma, demyelination, edema, necrosis, and infection. Unfortunately, the spectroscopic profile of HGGs overlaps that of other brain tumors and even non-neoplastic diagnoses on many occasions. It is important to use advanced neuroimaging such as MRS in the context of conventional imaging, including MR imaging.
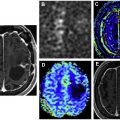
Brain metastases, particularly when solitary, can have considerable overlap with the appearance of primary brain tumors on MR imaging. Both are characterized by enhancing masses with surrounding T2/fluid attenuated inversion recovery (FLAIR) hyperintense edema. Both metastases and gliomas are known to have elevated Cho and decreased NAA compared with adjacent normal white matter. However, lipids and macromolecules are higher in metastases than glioblastoma. Evaluating spectroscopic results for the edema next to an enhancing mass may help with diagnosis, as the edema in gliomas more often contains infiltrating tumor cells and as a result has higher Cho/NAA and Cho/Cr. , As an example of this approach, please see Fig. 2 . Placement of voxels within the enhancing abnormality is suggestive of a high-grade tumor (either glioma or metastasis), but elevated Cho in the nonenhancing abnormality is more consistent with a high-grade tumor.

Related posts:
 Clinical Review of Computed Tomography and MR Perfusion Imaging in Neuro-Oncology
 Imaging Findings of New Entities and Patterns in Brain Tumor
 Cellular and Molecular Imaging with SPECT and PET in Brain Tumors
 Imaging Mimics of Brain Tumors
 PET Imaging for Head and Neck Cancers
 Novel Tracers and Radionuclides in PET Imaging
Stay updated, free articles. Join our Telegram channel

Full access? Get Clinical Tree


