, Valery Kornienko1, Alexander Potapov2 and Igor Pronin3
(1)
Department of Neuroradiology, Burdenko Neurosurgery Intitute, Moscow, Russia
(2)
Department of Neurotrauma, Burdenko Neurosurgery Insitute, Moscow, Russia
(3)
Department of Neuroradiology, Burdenko Neurosurgery Institute, Moscow, Russia
Abstract
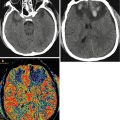
Chapter 2 presents clinical characteristics of the examined patients and neuroimaging methods. There were studied 208 patients in the acute, subacute, and delayed periods of brain trauma by generally accepted clinical and neuroimaging methods such as computed tomography and magnetic resonance imaging, also advanced MRI sequences and perfusion computed tomography. The majority of patients were in coma. Clinical and morphological diagnosis was based on the whole complex of data about mechanisms of injury, neurological symptoms, CT and MRI findings, and dynamics of the clinical course. Chapter 2 includes CT perfusion and diffusion-tensor MRI protocols, which were used in these investigations.
2.1 Clinical Material
From 2003 to 2012, 4,235 patients with neurotrauma were admitted to Burdenko Neurosurgery Institute; 1,298 (31 %) patients were hospitalized in the acute period of trauma, while the remaining 2,937 (69 %) in subacute and chronic periods. Most patients (3,194; 75.4 %) had craniocerebral trauma.
The main indication for admission was severe neurotrauma which required high-technology methods of diagnosis, surgical interventions, neurological monitoring, and intensive care. Therefore, the overwhelming majority of patients (70 %) underwent neurosurgical interventions and the remaining patients (30 %) received conservative treatment.
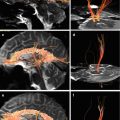
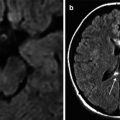
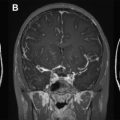
This analysis included 208 patients (or 16 % of TBI patients) admitted to the institute in the acute period of trauma. They were examined in the acute, subacute, and delayed periods of brain trauma by generally accepted clinical and neuroimaging methods: CT, MRI (T1, T2, T2-FLAIR, gradient echo T2* imaging), also by advanced MRI sequences (DWI, DTI, 3D gradient echo – SWAN), as well as perfusion computed tomography (CT perfusion).
Patients’ age varied from 6 to 72 years (mean age 28). Distributions of patients by age, mechanism, severity of injury, and outcome are listed in Tables 2.1, 2.2, and 2.3 and on Figs. 2.1, 2.2, and 2.3.
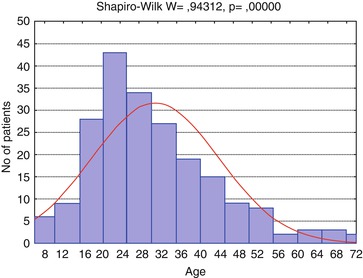
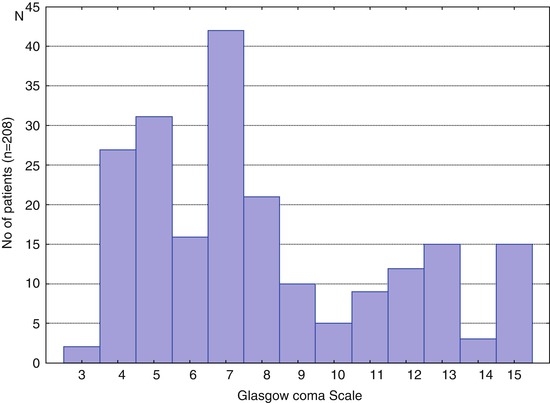
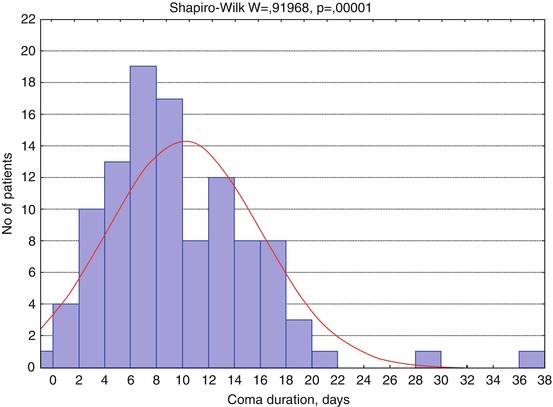
Table 2.1
Characteristics of the examined groups of patients (n = 208)
Mean | Median | Minimum | Maximum | 10th percentile | 90th percentile | Standard deviation | Standard error | |
|---|---|---|---|---|---|---|---|---|
Age | 30.65 | 28 | 6 | 72 | 17 | 49 | 13.12 | 0.91 |
GCS | 8.04 | 7 | 3 | 15 | 4 | 13 | 3.396 | 0.24 |
GOS | 3.51 | 3 | 1 | 5 | 2 | 5 | 1.077 | 0.07 |
Comaa duration, days | 10.1 | 9 | 0 | 37 | 3 | 17 | 5.92 | 0.58 |
Table 2.2
Distribution of patients based on the mechanism of damage
1 | 2 | 3 | 4 | 5 | 6 | ||
|---|---|---|---|---|---|---|---|
Mechanism | Falling from height | Assault | Motor vehicle | Motorcycle | Gunshot | Unknown | Total |
n | 25 | 35 | 118 | 18 | 5 | 7 | 208 |
Percentage | 12 | 16.8 | 56.7 | 8.7 | 2.4 | 3.4 | 100 |
Table 2.3
Distribution of patients by Glasgow Outcome Scale
GOS | 1 | 2 | 3 | 4 | 5 | Total |
|---|---|---|---|---|---|---|
n | 12 | 16 | 77 | 61 | 42 | 208 |
Percentage | 5.8 | 7.7 | 37 | 29.3 | 20.2 | 100 |
Fig. 2.1
Distribution of patients (n = 208) by age
Fig. 2.2
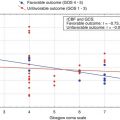
Distribution of patients by Glasgow Coma Scale (GCS), n = 208
Fig. 2.3
Distribution of patients by coma duration (n = 106, number of patients with known duration). Red curve shows expected normal (Gaussian) distribution
The main group (96.2 %) was presented by patients aged under 59, with half of them (54.8 %) being young people under 29 years old (Fig. 2.1); 62 of them were female (29.8 %) and 146 (70.2 %) male.
The main causes of head injury were traffic accidents (motor vehicle accidents: car or motorcycle) (65.4 %), assaults (16.8 %), and falls from one’s own or great heights (12 %). The rest of the trauma mechanisms made up 5.8 % (Table 2.2).
Patients’ severity state at admission was evaluated by Glasgow Coma Scale (GCS) and varied from score 3 to 15 (average score, 7) (Teasdale and Jennett 1974). The majority of patients were in coma – GCS score ≤ 8 (n = 139; 66.8 %) (Fig. 2.2), with its duration widely varied (Fig. 2.3).
Evaluation of patients by Glasgow Outcome Scale (Jennett and Bond 1975) showed prevalence of severe disability, n = 77; 37 % (Table 2.3). However, there was no significant predominance of unfavorable outcome (n = 105; 50.5 %) over favorable one (n = 103; 49.5 %).
< div class='tao-gold-member'>
Only gold members can continue reading. Log In or Register to continue
Related posts:
 Clinical and Prognostic Value of Neuroimaging in Traumatic Brain Injury
 Mapping of Cerebral Blood Flow in Focal and Diffuse Brain Injury
 Dynamic Study of White Matter Fiber Tracts After Traumatic Brain Injury
 Dynamics of Hemispheric and Brain Stem Regional Cerebral Blood Flow
 Neuroimaging Classification of Traumatic Brain Injury
 Anti–NMDA Receptor Encephalitis
Stay updated, free articles. Join our Telegram channel

Full access? Get Clinical Tree


