Fig. 7.1
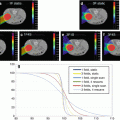
Effect of pencil beam size on the dose distribution. Dose volume histograms (DVH) for the target volume (prostate) and the rectum obtained with different pencil beam size and spot spacing are compared with DVH obtained with state of the art photon radiotherapy technique (helical tomotherapy (HT)).[22]
While defining the technical requirement for a PBS-based facility, one faces specific questions that require a compromise between conflicting needs. For instance:
1.
Which maximum proton energy? This is not a PBS-specific question but needs be addressed nonetheless. The current trend is for maximum energies in the 230 MeV range or lower, corresponding to a penetration depth in water of about 32 cm. In the interest of cost, there is an incentive in decreasing this limit even further. However, one should consider that one thing is achieving energies to treat lesions in any location and it is a different thing to have energies high enough to image with protons, which is a candidate solution for accurate in vivo range estimation (see, e.g., [18]). In the interest of proton imaging, the maximum available energy should actually be increased, not decreased.
2.
Which minimum proton energy? This is a PBS-specific question and it does have a significant impact on the clinical workflow. PBS is a technique which is mostly but not entirely free of beam-specific hardware, and a beam absorber (a.k.a. range shifter) is the beam modifier most likely to be needed in PBS. Such a device is needed because there is a limit to the lowest proton energy that can be safely and effectively transported through the beamline to the isocenter. Most commercially available proton therapy systems allow a minimum energy between 100 MeV (corresponding to a range of about 7.8 cm in water) and 60–70 MeV (3.1–4.1 cm). Obviously, the lower the minimum energy, the better. In addition to setting a low minimum energy, one should minimize the dosimetric effect of the preabsorber, which acts as an additional source of scatter for the beam, either by moving it as close as possible to the patient or to use it only for the energy layers where it is required.
3.
Which maximum field size? The maximum field size available in several PBS facilities nowadays it is quite large (e.g., 30 × 40 cm2), but this size is probably determined by the needs of scattered beams rather than PBS. There is of course a price to pay for large fields (in terms of both money and equipment size/weight), and in principle PBS treatments could rely on the routine use of abutting fields. As a consequence, there is a trend in new facilities relying entirely on PBS to accept smaller field sizes, e.g., 20 × 20 cm2. One must however take into account that in order to routinely rely on field abutment, appropriate planning techniques are needed, which are not the standard in all treatment planning systems (TPSs).
4.
Are beam apertures necessary? The pencil beam size can change by more than a factor 2 between high energies and low energies (Fig. 7.2). Therefore, when a sharp lateral penumbra is needed at shallow depths, apertures may have a role. Apertures, however, are associated with increased complexity both in terms of workflow (they should be inserted/removed at every field and they require a movable holder in order to have them as close as possible to the patient) and dose calculation (the dose contribution from scatter in the aperture may not be accurately estimated by pencil beam algorithms).
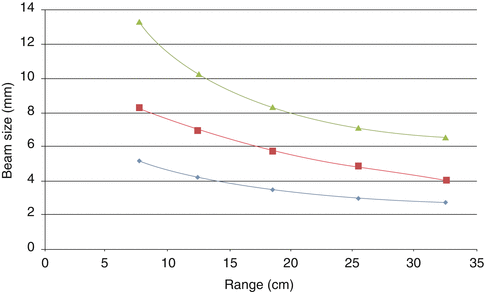

Fig. 7.2
Spot size (1 sigma in air at isocenter) as a function of beam range available in Trento
5.
How fast should the energy change between neighboring layers? Several strategies to minimize the so-called interplay effects between beam delivery and respiratory motion have been proposed through the years, such as beam tracking, volumetric repainting, and gating, but none of them have established themselves as the standard in clinical practice. With the exception of PSI, where energy changes in the range of 80 ms have been obtained, most current commercial solutions for PBS are associated with energy changes in the 1–2 s range, which may severely decrease the benefits of volumetric repainting [2].
6.
Are multiple spot sizes needed? The initial effort in PBS development was aimed at achieving spot size as small as possible. Then the question came whether using the smallest spot size, which is surely beneficial for most patients, is the best possible solution in all cases. The arguments in favor of the selected use of larger spot size are essentially twofold:
1.
Larger spot sizes result in a reduced total number of spots, i.e., a shorter beam-on time, which may be beneficial with very large target volumes. Given that in-layer dead times, to move a spot from one position to the next, are typically much smaller than dead times between layers (when the beam energy should be changed), of course the relative decrease in beam-on time is larger for smaller energy switching times.
2.
Larger spot size may produce dose distributions that are less sensitive with respect to intrafraction motion [7].
7.2 Commissioning a Pencil Beam Scanning Facility
Comparing pencil beam scanning with other beam delivery techniques (see, e.g., [3]), one current difficulty with PBS in clinical practice is that, due to the relative novelty of the techniques, the commissioning procedure are not fully established and are therefore quite time consuming. In this section we’ll summarize the work performed at our center to characterize our PBS system. While some details of what we’ll discuss are specific to our technical configuration, we’ll mostly focus on aspects that are vendor independent and that should therefore be characterized in any PBS facility.
Our center hosts a cyclotron-based beam production and delivery system serving two isocentric gantries (Figs. 7.3 and 7.4). The main technical characteristics relevant for the beam commissioning are shown in Table 7.1. The terminal part of the beam delivery system (the so-called nozzle (Fig. 7.5)) is designed for pencil beam only, so vacuum extends as far downstream as possible, PBS-specific beam focusing elements are present beside the scanning magnets, and the beam does not interact with any material prior to hitting the beam monitor chambers (IC2 and 3) and the exit window. The overall water equivalent thickness of the nozzle is therefore small.
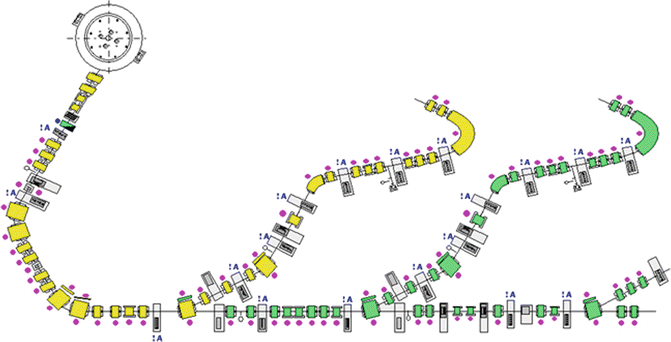
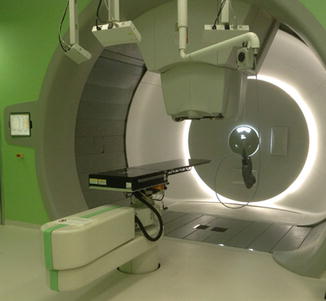

Fig. 7.3
Schematic layout of the PT center in Trento, where one cyclotron serves two gantry rooms and one fixed line room. Picture courtesy of IBA

Fig. 7.4
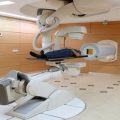
One of the two gantries available at the PT center in Trento
Table 7.1
Summary of the main beam characteristics of the PBS system installed in Trento
Type of accelerator | Cyclotron |
|---|---|
Maximum beam range at isocenter | 32 cm |
Minimum range at isocenter without beam modifiers | 4.1 cm |
Minimum spot size (in air) at maximum range | 2.5 mm |
Minimum spot size (in air) at minimum range | 7.0 mm |
Time needed for energy change between neighboring layers | ≤2.0 s |
Number of available spot sizes per range | 3 |
Time to deliver 2G to a 10 × l0 × 10 cm3 volume | <60 s |
Maximum field size | 30 × 40 cm2 |
Spot position accuracy | ≤1 mm |
7.2.1 Spot Size, Shape, and Geometrical Accuracy
Since our facility is one of the very first where PBS-only beam delivery systems are available on the gantry of an IBA machine, we went through an extensive set of measurements to characterize spot size and shape as a function of (a) energy, (b) position in the transversal plane, and (c) gantry angle. The beam properties in the transverse plane were typically measured with a scintillation detector coupled with a CCD camera (Fig. 7.5). The measurements did allow us to assess the normality of the spots as a function of beam energy, position, and gantry angle and to evaluate the fluctuations in spot size for each energy as a function of position and gantry angle (see example in Fig. 7.10). Overall, the range of variations was typically within 10 % of the spot size, which is considered to be adequate from a clinical perspective. Of course a crucial test for pencil beam scanning is the capability of the beam delivery system to accurately place the spots in absolute terms, not only relative to one. To assess such accuracy, we had to take account for a specific feature of our system, where the reference for beam alignment is the same as for patient alignment, i.e., two orthogonal pairs of X-ray tubes and flat panel detectors (Fig. 7.11). This means that whenever a geometrical property needed to be assessed (e.g., isocentricity), one should first evaluate beam and X-ray separately and then combine these measurements by testing the colinearity between beam and X-ray imaging system. Concerning the gantry, our commissioning procedure started with an assessment of mechanical isocentricity (see an example of the performances in Fig. 7.8). We then moved to a “star shot” test to evaluate the beam isocentricity. Since the beam is magnetically steered, this property is in principle a function of the energy, so such test was repeated for a number of representative energies (see an example of the results in Fig. 7.9). Last but not least, the overall beam-pointing accuracy depends on the performance of the patient positioning system that had to be characterized for all possible couch angles, isocenter position, and a broad set of weights (Fig. 7.10).


Fig. 7.5
Experimental setup to measure spot properties in the transverse plane for different gantry angles, energy, and position in the plane

Fig. 7.6
Variation in spot size in the isocenter plane as a function of position in the plane and gantry angle

Fig. 7.7
X-ray-based beam and patient alignment system. The two flat panels are extracted, thus being in imaging position. The X-ray tubes are located within the nozzle and behind the rolling floor

Fig. 7.8
Mechanical isocentricity of the gantry: The difference (in cm) between nominal and intended gantry position is shown as a function of the gantry angle. All differences are within 0.5 mm

Fig. 7.9
Results of the “star shot” test for 150 MeV protons and gantry angles from 180° to 350°

Fig. 7.10
Geometrical accuracy of the patient positioning system
7.2.2 Monitor Chamber Calibration
The aim of monitor chamber calibration is to establish a direct relationship between the number of protons delivered and the monitor units (MUs) read by the monitor chambers in the nozzle (IC2/3; see Fig. 7.11). Whenever a reference measurement of absolute dose is needed in radiation therapy, a code of practice has to be followed. Mainly for historical reasons (no PBS techniques were developed when the current code of practice, i.e., IAEA Code of Practice TRS 398, was written), there are no reference conditions of measurement specifically defined for active beam delivery techniques in proton therapy.
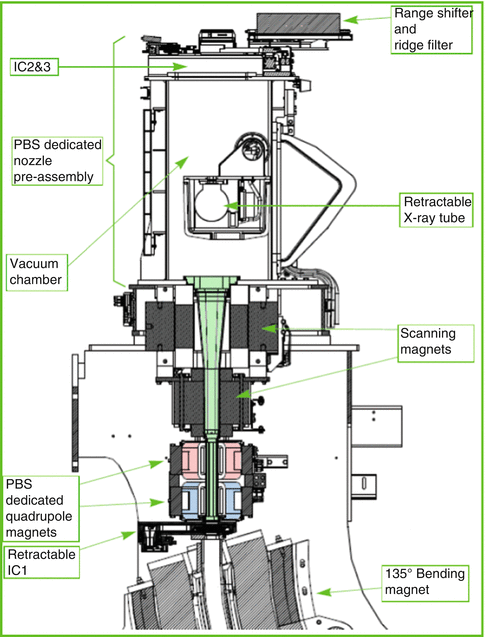

Fig. 7.11
Schematic representation of the “nozzle”: In this picture, the beam direction is from the bottom to the top, i.e., the isocenter is 30–40 cm from the range shifter (Picture courtesy of IBA)
However, several studies were published where such conditions are proposed [6, 9, 14]. In our facility we used two methods inspired by the methods of PSI [14] and GSI [9].
The first method is based on a Faraday cup (Fig. 7.12) where 10−4 mbar of vacuum was created and high voltage (HV) (≈1200 V) was applied in order to have the maximum yield from the device. The incoming protons hitting the thin entrance window travel along the vacuum space until they hit a copper block at the end of the vacuum. The vacuum is used to prevent protons interacting in this space, while the HV is applied in order to eliminate electron contamination in the signal. Protons reaching the copper block are absorbed and their charge is registered with an electrometer. Dividing this value by the proton charge, the number of protons hitting the entrance window can be derived. Since not all protons hitting the entrance window reach the copper (due to interactions with the entrance window itself), a Monte Carlo simulation of the exact geometry of the Faraday cup was performed to evaluate these losses at three different energies (70, 160, and 220 MeV). The correction factors estimated are 1.20 %, 0.84 %, and 0.79 % for the three energies, respectively. We then delivered single spots of 1MU/spot with 15 different energies (from 70 to 220 MeV with an energy step of 10 MeV). The results are summarized in Fig. 7.13.


Fig. 7.12
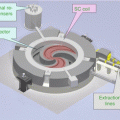
Faraday cup (Courtesy of E. Grussel)


