Introduction
Chronic liver disease (CLD) is a substantial worldwide problem. Any disease that incites liver inflammation can lead to liver fibrosis, which can then progress to cirrhosis.
The stage of liver fibrosis is important to determine prognosis, surveillance, progression, or regression of disease. The process of fibrosis is dynamic, and regression of fibrosis is possible up to the stage of early cirrhosis with treatment of the underlying conditions. Therefore it is important to detect the presence of the disease before the development of decompensated cirrhosis. Worldwide there is a significant increase in fatty liver disease, which can lead to cirrhosis, and noninvasive methods to detect steatosis and monitor progress or regression of the disease are needed.
With increasing fibrosis, the liver becomes stiffer and eventually portal hypertension develops. Previously, the only method of quantifying the degree of fibrosis was a random liver biopsy, which is an imperfect reference standard. Although conventional ultrasound (US) is limited in the detection of fibrosis stages less than cirrhosis, it is a widely used screening examination. Conventional US is used as a screening tool for assessment of steatosis because it is noninvasive, lacks radiation, and is widely available. Other methods such as shear wave elastography are more accurate in the assessment of the stage of fibrosis, and new US techniques are becoming available for fat quantification, which are discussed in other chapters of this book.
For liver stiffness and fat quantification, high quality B-mode images are required for accurate measurements. This chapter reviews the conventional US techniques and how to optimize both B-mode and Doppler images, eliminate artifacts, and use these features in CLD.
The use of B-mode imaging for liver stiffness measurements is discussed in Chapter 4 , portal hypertension in Chapter 8 , and fat quantification in Chapter 11 . Details about Doppler studies for the evaluation of portal hypertension are given in Chapter 8 . Detection and characterization of focal liver lesions in CLD are presented in Chapter 13 . A review of the normal anatomy of the liver can be found elsewhere. ,
B-mode imaging
Optimizing B-mode images
When evaluating patients with suspected CLD, a complete US evaluation of the liver should be performed. The entire liver should be evaluated in two planes to reconstruct its three-dimensionality. In adults the examination should be performed with a curved transducer optimized for abdominal imaging, usually with a range of 2 MHz to 6 MHz. The frequency of the transducer should be adjusted as needed for the patient’s body habitus. Most modern transducers are wideband and have the ability to adjust the center frequency to optimize the imaging. Most systems have a RES (resolution) setting using higher frequencies in easy-to-scan patients, a GEN (general) setting using mid-range frequencies, and a PEN (penetration) setting using lower frequencies in difficult-to-scan patients. Spatial compounding and harmonic imaging also improve the quality of the image by decreasing artifacts and clutter. Using these settings appropriately will improve the image quality. Generally, the left lobe of the liver is best imaged in a supine position using a subcostal approach whereas the right lobe is best imaged using a left lateral decubitus position using both a subcostal approach and through an intercostal window. Having the patient take a deep inspiration may be required to visualize the dome of the liver. A small sector probe also can be helpful in anatomically difficult locations and in pediatric patients. Vascular landmarks should be included in the images to allow identification of the segment according to the Couinaud classification. Color Doppler, power Doppler, or microvascular flow techniques are used to evaluate vessel patency and flow dynamics. Optimization of the Doppler images should be performed, including selecting the appropriate scanning frequency and filters. The biliary system including the gallbladder and intrahepatic and extrahepatic bile ducts also should be evaluated for masses, strictures, or areas of dilation. An examination for CLD should include evaluation of the liver echotexture, evaluation of the liver capsule to assess for nodularity using a high-frequency linear probe, and assessment of the size of the right lobe of the liver and caudate lobe and portal vein diameter. Doppler evaluation with spectral analysis of the portal vein and hepatic veins is required to assess for portal hypertension or hepatic venous outflow obstruction (see Chapter 8 ). Detection and characterization of focal liver lesions should be included as there is a risk for hepatocellular carcinoma in patients with severe fibrosis/liver cirrhosis, which is discussed in Chapter 13 . The spleen size should be estimated and the possible presence of varices should be evaluated, particularly in patients with advanced chronic liver disease (ACLD) as these are signs of clinically significant portal hypertension. Table 2.1 lists the conventional US protocol for CLD.
| Mode | Anatomic Location | Key Findings | |
|---|---|---|---|
| Curved linear probe |
|
|
| Linear probe | Liver capsule—smooth or nodular | ||
| Color Doppler with spectral analysis |
|
| |
| Elastography |
|
|
Fatty liver disease
Diffuse fatty infiltration results in increased echogenicity of the liver, thus the sound transmission is progressively and more markedly reduced from the proximal to the distal portions of the liver. This leads to poor or nonvisualization of the diaphragm, intrahepatic vessels, and posterior portion of the right hepatic lobe. It is important to remember that different US systems may have a more grainy or less grainy appearance of the liver, and learning the appearance of the liver echotexture on the system being used is important.
The main features to take into consideration for a qualitative estimate of liver fat content are liver–kidney contrast, diaphragm definition, and vessel blurring.
Liver–kidney contrast
The echogenicities of liver and kidney are almost equivalent in normal subjects. However, the liver appears hyperechoic as the fat deposition in the liver causes increased echogenicity. The contrast between the liver and parenchyma of the right kidney is therefore increased in liver steatosis ( Fig. 2.1 ). Due to the increased attenuation of the ultrasonic waves in a steatotic liver, the diaphragm, intrahepatic vessels, and the posterior part of the right lobe are poorly or nonvisualized. As an increased liver echogenicity leads to a decreased acoustic impedance between the liver parenchyma and other echogenic structures like portal vein walls, liver capsule, and gallbladder walls, those structures are depicted with difficulty ( Fig. 2.2 ). In rare cases, patients with liver steatosis may show a paradoxical lack of posterior attenuation on US images due to scattering in attenuation of the US beam seen in fatty livers ( Fig. 2.3 ).


Using a combination of some of the aforementioned parameters, the degree of steatosis may be qualitatively assessed as discussed later. , ,
Diaphragm definition
Diaphragm visualization is an important indicator for diagnosing liver steatosis. It can be visualized normally in mild liver steatosis. The echogenicity of the diaphragm is discontinuous in moderate liver steatosis, and it is not visualized in patients with severe liver steatosis.
Vessel blurring
Intrahepatic vessels are sharply demarcated in normal liver. Vessel blurring is an indicator of moderate liver steatosis, and it is based on an impaired visualization of the borders of the intrahepatic vessels and narrowing of their lumen. There are two major reasons for vessel blurring in fatty liver: attenuation of acoustic wave and intrahepatic vascular remodeling. These two reasons can exist alone or at the same time. Intrahepatic vascular remodeling contributes to high resistance and constricted sinusoidal vessels, even to the extent to which intrahepatic vascular shunts develop. Among the various criteria used to diagnose liver steatosis, vascular attenuation, which includes both portal vein and hepatic vein blurring, has lower sensitivity and specificity compared with hepatorenal echo contrast and bright liver.
The assessment of hepatic steatosis on US is subjective, leading to intra- and interreader variability. The features of large hepatic vein blurring, liver–kidney contrast, and overall impression have the highest intrareader, intertransducer, and interreader agreement. Large hepatic vein blurring has the highest accuracy for classifying dichotomized hepatic steatosis grade. Large hepatic vein blurring (intraclass correlation coefficient [ICC]: 0.76), liver–kidney contrast (ICC: 0.78), and overall impression (ICC: 0.75) have the highest mean intrareader agreement, whereas liver echo texture (ICC: 0.43) have the lowest mean intrareader agreement, also depending on the frequency of the transducer. Among individual imaging features, large hepatic vein blurring has the highest diagnostic accuracy (71%) for classifying dichotomized hepatic steatosis (80% sensitivity, 63% specificity) using histological grade as the reference standard. Large hepatic vein blurring provided nominally similar accuracy as overall impression for classifying dichotomized hepatic steatosis with higher specificity but lower sensitivity point estimates.
Grading liver steatosis
An accurate estimate of the fat in the liver is a crucial component in the diagnostic work-up of patients with nonalcoholic fatty liver disease (NAFLD) because liver steatosis is associated with metabolic syndrome and the degree of fatty degeneration is directly proportional to the cardiovascular risk.
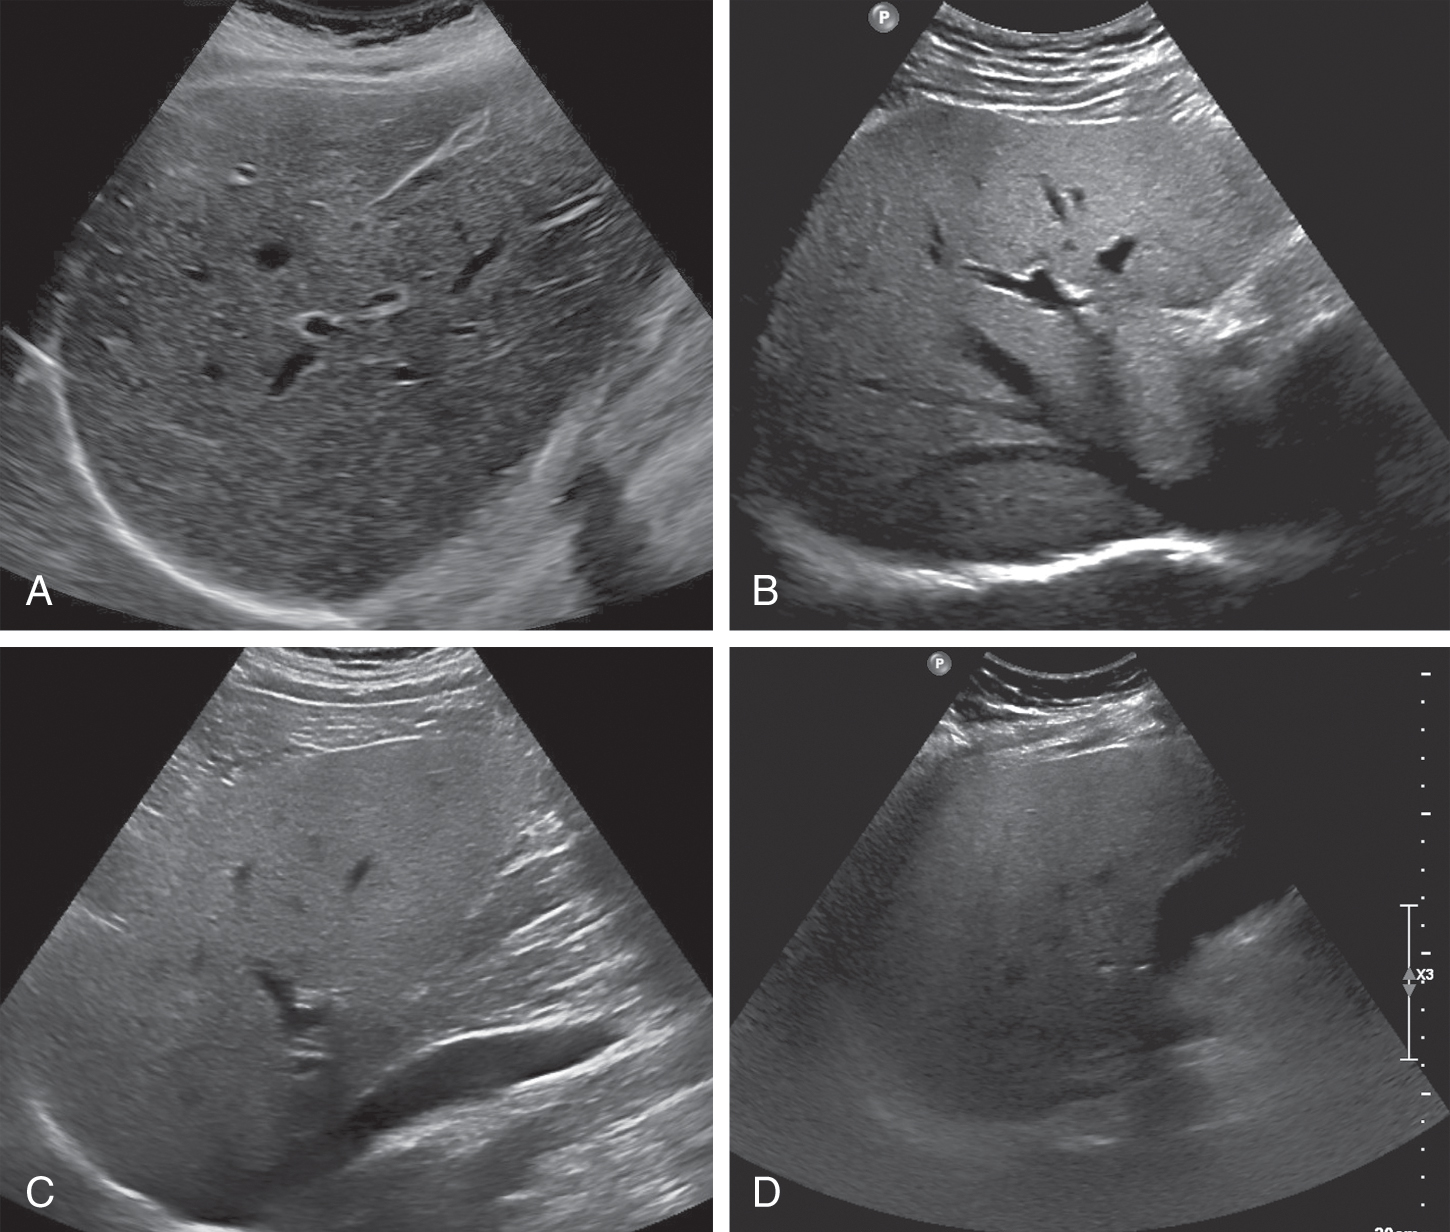
Based on the features discussed previously, US allows for a subjective estimate of the degree of fatty infiltration in the liver. Grading of liver steatosis can be made using a qualitative grading system of absent, mild, moderate, or severe. Absent (Grade 0) is when the echotexture of the liver is normal. Grade 1 (mild) is represented by a mild diffuse increase in liver echogenicity with normal visualization of the diaphragm and intrahepatic vessel borders (mainly portal vein). Grade 2 (moderate) is represented by a moderate diffuse increase in liver echogenicity with slightly impaired visualization of the portal vein and diaphragm. Grade 3 (marked) is represented by a marked increase in liver echogenicity with poor or no visualization of the intrahepatic vessel borders, diaphragm, and posterior portion of the right lobe of the liver ( Fig. 2.4 ). , , In mild hepatic steatosis, the liver size is normal and the edge is relatively sharp. In severe hepatic steatosis, the liver is enlarged and the edge is blunt. The liver size of moderate steatosis is in between. Numerous other studies have dealt with the US-based semiquantitative classification of fatty liver.
The Hamaguchi score and the Ultrasound Fatty Liver Indicator scores combine several US findings assigning a number to each of them, therefore a semiquantitative estimate of liver fat content is obtained. They are presented in detail in Chapter 11 . Conventional US is particularly accurate when there is no other underlying liver disease. The sensitivity and specificity of sonography for the detection of moderate to severe steatosis using histology as a reference standard are 80%–89% and 87%–97%, respectively. If all degrees of steatosis are considered, the sensitivity and specificity decrease to 65% and 81%, respectively. A metaanalysis based on 49 studies has shown a high accuracy of US for the diagnosis of moderate to severe steatosis. However, US accuracy is highly operator dependent, and its sensitivity is reduced when steatosis infiltration is lower than 30% or in morbidly obese patients. Furthermore, the quantification of hepatic steatosis is subjective and could be influenced by the heterogeneity seen in some patients with NAFLD. Due to substantial inter- and intraobserver variability and the reduced sensitivity in assessing mild steatosis, the four-point visual scale evaluation has clear limitations. , ,
As a diagnostic tool for the detection of fatty liver, US showed a sensitivity and specificity of 85% and 94%, respectively, as a large metaanalysis of 49 studies with 4720 patients found in which histology served as the gold standard. Computed tomography has inferior diagnostic value (low sensitivity for mild cases and intermachine variability) and exposes the patient to radiation, limiting it for screening. Magnetic resonance spectroscopy (MRS) allows for quantification of hepatic fat. Magnetic resonance imaging–derived proton density fat fraction (MRI-PDFF) is a quantitative noninvasive biomarker that objectively estimates the liver fat content and has been accepted as an alternative to the histological assessment of liver steatosis in patients with NAFLD. ,
Hepatorenal index
A semiquantitative method of grading liver steatosis is the sonographic hepatorenal index (HRI) , ( Fig. 2.5 ). This is based on comparison of the echogenicity of the liver to the normal kidney. The effectiveness of steatosis detection can be increased by quantification of liver brightness as compared to the kidney brightness. On a US image showing segment VI of the liver and the right kidney (usually the upper pole), two regions of interest should be selected: one in the liver parenchyma, far from vessels and bile ducts, and the other in the renal cortex (between the pyramids) at the same field depth. The mean brightness of each region of interest is determined using numerical values assigned to gray-scale pixels. The HRI is the mean liver brightness divided by the mean renal cortex brightness. A histogram analysis of the echogenicity can be performed directly on some US systems or may be exported to freeware available online as JPEGs. The results seem to be better if the histogram is performed on DICOM images downloaded from the PACS.

Significant correlation between histological steatosis and the HRI has been found in several studies. The accuracy of the HRI for the diagnosis of mild steatosis (≥5%) was excellent (AUROC 0.99) with 100% sensitivity and 91% specificity using a cutoff of 1.49. Further studies have confirmed that the HRI had excellent accuracy for the detection of steatosis (negative predictive value = 94%−100% with cutoffs ranging from 1.24 to 1.34). In addition, for the prediction of steatosis grades less than moderate or severe, HRI is superior to qualitative grading.
Several studies have found this technique to have significant correlation to histologic steatosis. A recent study using 3 Tesla magnetic resonance imaging as the gold standard found that cutoff values of 1.21, 1.28, and 2.15 had 100% sensitivity for diagnosis of greater than 5%, 25%, and 50%, respectively, with a specificity of greater than 70%. It is important to note that each vendor has its own method of assessing the HRI, and cutoff values may vary between vendors.
In some studies, histogram analyses of the echogenicity ratio of liver and renal cortex were performed. , The software-based histogram analyses significantly increased the diagnostic accuracy of sonography for a degree of fat ≥5% (AUROC >0.90). In another study, a sensitivity of 100% and a specificity of 54% were achieved for the detection of a degree of fat ≥5% with an HRI of ≥1.28. A more recent study by the same working group was able to achieve a sensitivity of 92% and a specificity of 85% for the detection of low-grade fatty degeneration (≥5%) using new software for an HRI calculation and a cutoff value of ≥1.34. Like the other previously mentioned scores, the HRI has not yet been sufficiently validated for clinical routine.
Focal fatty infiltration patterns
Hepatic steatosis may present with different patterns of deposition and sparing. In the literature six patterns of liver steatosis are described: diffuse, geographic, focal, subcapsular, multifocal, and perivascular. Diffuse fatty liver deposition is the most prevalent form of fatty liver disease. Geographic fatty liver disease is often encountered and can be attributed to specific causes (vascular or inflammatory) ( Fig. 2.6 ). Focal fat deposition and focal fatty sparing are less frequent and occur predominately in specific areas (i.e., perivascular and subcapsular regions abutting the hepatic hilum or falciform ligament) and can mimic a tumor ( Fig. 2.7 ).


