Fig. 11.1
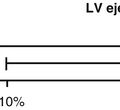
This graph, from the SCORE (Systematic COronary Risk Evaluation) database, illustrates a key feature of prevention strategies. Known as the “Rose prevention paradox,” the figure illustrates the seemingly contradictory situation that the majority of events from a disease occur in members of the population at low or moderate event risk, while only a minority of events occur in the highest-risk segment of the population. See text for additional details. CVD cardiovascular disease, SCORE Systematic COronary Risk Evaluation (With permission from Cooney et al., European Journal of Preventive Cardiology 2009)
11.2 Clinical Use
11.2.1 Measurement of Coronary Calcium
In the coronary arteries, calcifications almost always occur in the setting of atherosclerosis. The only known exception is renal failure, which may be associated with medial (nonatherosclerotic) calcification of the coronary artery wall along with atherosclerotic calcification. Even in renal failure patients, extensive intimal calcification is also present, contributing to the exceptionally high cardiovascular mortality. In fact, the coronary calcium score is considered to provide an estimate of vascular age in patients without renal failure. It has been shown that the amount of coronary artery calcium reflects the total atherosclerotic burden, including both calcified and noncalcified plaques. The quantitative relationship between calcified and noncalcified plaque components, however, is not uniform and, in some individuals, only noncalcified plaques are present.
Coronary artery calcium can be detected on noncontrast cardiac CT (Figs. 11.2 and 11.3). To quantify coronary artery calcium, the area and density, volume, or mass of calcified deposits is measured. Several quantification methods exist: (1) the Agatston score (Tables 11.1 and 11.2), (2) the volume score, (3) the derived calcium mass, and (4) the calcium coverage score (Table 11.2).
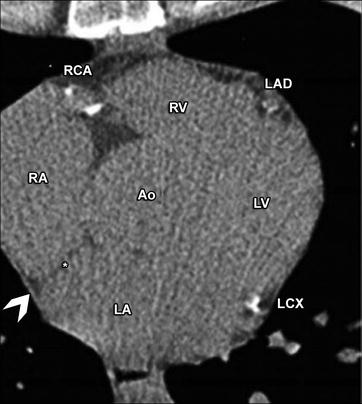
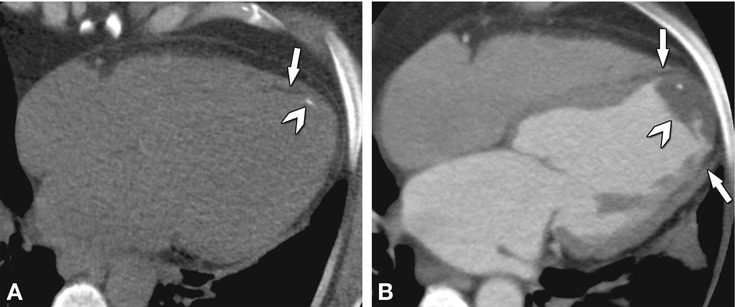
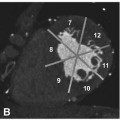
Fig. 11.2
Considerable information on cardiac structures can be garnered from noncontrast CT. The left anterior descending (LAD), left circumflex (LCX), right coronary artery (RCA), and the ascending aorta (Ao) can be seen, as labeled. The four chambers of the heart are also seen and labeled as RA (right atrium), RV (right ventricular outflow tract), LA (left atrium), and LV (left ventricle). Relative chamber sizes can be estimated from noncontrast CT. The pericardium is visible as a thin line (arrowhead). The inter-atrial septum is also seen (asterisk)
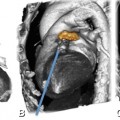
Fig. 11.3
Chronic apical infarction seen on a noncontrast scan as an incidental finding in a 50-year-old female patient with a calcium score of zero. Panel A shows the apical infarction with thinning and fatty degeneration of the myocardium (arrow), while a nearby calcification is also visible on a four-chamber view reconstructed from the non-contrast acquisition (arrowhead). Panel B shows a 5-mm average reconstruction in the four-chamber view from contrast-enhanced CT angiography in the same patient, delineating the thinned fatty myocardium (arrows) and an apical thrombus (arrowhead) that contains the calcification
Table 11.1
Classification of calcium scores using the Agatston method
Agatston units | Ranking |
|---|---|
0 | Absent |
>0 – 10 | Minimal |
>10 – 100 | Mild |
>100 – 400 | Moderate |
>400 – 1,000 | Severe |
>1,000 | Extensive |
Table 11.2
Comparison of four methods for coronary artery calcium (CAC) scoring
Agatston scorea | Volume score | Derived calcium mass | Calcium coverage score | |
|---|---|---|---|---|
Calculation of calcium score | CSb = Wc × Ad | VSe = Vnoxf × Nvoxg | Cach × Vcpi | Affected 5-mm segments/total number of 5-mm segments |
Advantages | Most commonly used method for which substantial reference data exist | High reproducibility | Accurate and little variability | Helpful in conveying to the patient the percentage of his/her arteries that have calcified plaque |
Useful for assessing progression of coronary calcium | ||||
Disadvantages | Low interscanner agreement | Partial volume effects may impair accuracy | Difficult to measure | Requires accurate tracing of the coronary arteries, which adds more reading time |
Nonlinearity with respect to amount of calcium | Less clinical data available | Requires a phantom to be placed under the patient for calibration | Not well established clinically | |
Dependence on noise | Less clinical data | |||
Score does not correspond to a physical measure | ||||
Interscan variability | 15–20% | 10–12% | 10–12% | No data |
Unit | mm2 | mm3 | mg of calcium hydroxyapatite equivalence | Percentage (%) |
Clinical use | Most commonly used | Can be used to measure progression of atherosclerosis | Best measure of the amount of calcium in coronary arteries | Too tedious for clinical practice |
The prevalence and extent of coronary artery calcium increases with age, and both are higher in men compared with women at any age. The prognostic value of absolute coronary artery calcium scores and calcium ‘percentiles’ – relative to age and gender – has been compared in the Multi-Ethnic Study of Atherosclerosis. In this study, although both scoring methods yielded effective risk stratification, the absolute measurement approach performed better than the percentile approach. Therefore, reporting the absolute coronary artery calcium score is currently recommended for clinical practice.
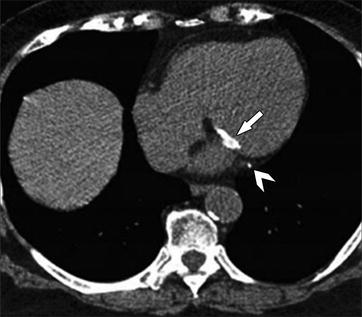
In cardiac CT imaging, certain noncardiac incidental findings may be seen such as thoracic and abdominal diseases including liver cysts, calcified lymph nodes, emphysema, and lung nodules. Other calcified tissues including cardiac valve leaflets can resemble coronary artery calcium and must be interpreted correctly in order not to falsely increase the total “coronary” calcium score (Fig. 11.4). Misinterpretation is highly unlikely in experienced centers, as these different entities are easy to distinguish from each other. Importantly, aortic valve calcification has independent prognostic value for risk stratification. It is important to distinguish all of these noncoronary findings so that they can be properly diagnosed and managed.
Get Clinical Tree app for offline access
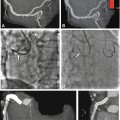
Fig. 11.4
Axial noncontrast CT showing a significantly calcified mitral annulus (arrow


Related posts:

Stay updated, free articles. Join our Telegram channel
Full access? Get Clinical Tree
