There are several magnetic resonance (MR) imaging techniques that benefit from high-field MR imaging. This article describes a range of novel techniques that are currently being used clinically or will be used in the future for clinical purposes as they gain popularity. These techniques include functional MR imaging, diffusion tensor imaging, cortical thickness assessment, arterial spin labeling perfusion, white matter hyperintensity lesion assessment, and advanced MR angiography.
- •
High-field intraoperative magnetic resonance (MR) imaging (functional MR imaging and diffusion tensor imaging) systems offer the possibility of integration of presurgical data with neuronavigation systems, which could change the face of functional neuroradiology.
- •
Differences in cortical thickness in different brain regions may have the potential to serve as biomarkers in different patient populations such as those with schizophrenia, dementia, and depression.
- •
White matter hyperintensities (WMHs) are associated with age and cardiovascular risk factors and are characterized by regional hypoperfusion. Extensive WMH load increases risk for stroke and detrimentally affects cognition, especially in older adults.
- •
WMH burden can be assessed using qualitative visual rating scales or quantitative computer-based techniques. Quantitative methods range from manual region-of-interest to fully automated techniques that are capable of providing reliable volumetric assessments of WMH load.
- •
In the future, WMH burden as assessed by MR fluid-attenuated inversion-recovery imaging may be helpful in predicting cognitive decline, perfusion deficits, and disease development.
- •
Arterial spin labeling (ASL) is a noninvasive method for quantitative assessment of cerebral perfusion or cerebral blow flow. This imaging method offers the possibility to detect perfusion deficit in clinical populations.
- •
Signal from ASL perfusion MR is highly reliable and reproducible within session and across sessions at a later time, making it suitable for longitudinal and replication studies.
- •
ASL is now used in various clinical setting including cerebrovascular diseases, central nervous system neoplasms, and neurodegenerative diseases such as Alzheimer disease, and has been proved to show similar perfusion deficits as observed in dynamic susceptibility contrast (DSC) perfusion imaging, positron emission tomography and single-photon emission computed tomography.
- •
Although DSC perfusion imaging still offers the most thorough evaluation of perfusion, ASL perfusion MR imaging provides a noninvasive MR perfusion method able to depict similar perfusion abnormalities and deficits without the need of injection of exogenous tracers.
- •
Advanced MR angiographic techniques have the potential to provide standard information about flow, stenosis with increased spatiotemporal resolution and signal-to-noise ratio as well as additional novel measures such as pressure gradient and wall shear stress.
fMR Imaging
- •
Preoperative fMR imaging at high-field scanner strength can provide reliable estimates of the spatial relationship of eloquent cortex with respect to brain tumor or lesion and is recommended to facilitate the risk-benefit assessment and decision regarding surgery with the aim of minimizing postoperative deficits.
- •
The use of noninvasive BOLD fMR imaging is recommended especially for language mapping because of the high concordance rates between fMR imaging and the traditionally accepted albeit invasive Wada test.
DTI
- •
Preoperative DTI at high-field scanner strength can provide reliable estimates of the spatial relationship of eloquent networks with respect to brain tumor or lesion and is recommended to facilitate the risk-benefit assessment and decision regarding surgery with the aim of minimizing postoperative deficits.
Cortical Thickness
- •
Cortical thickness measures can provide an assessment of whether an individual is at risk for dementia compared with normal aging-related thickness changes.
ASL Perfusion
- •
ASL perfusion offers a complementary clinical diagnosis tool to DSC perfusion and other MR imaging techniques.
- •
An alternative when patient has a contraindication to gadolinium (eg, allergy to gadolinium or renal insufficiencies).
WMH
- •
WMH burden can be accurately assessed using T2-weighted FLAIR sequences, especially at higher scanner strength (3 T and greater) and when acquired in 3D.
- •
The use of T2 FLAIR sequences to quantify WM disease is recommended to potentially assess increased risk of stroke and decreased cognitive performance, especially in older adults.
Advanced MRA
- •
Advanced MRA techniques can provide additional diagnostic information such as pressure gradient and shear stress as well as increased spatiotemporal resolution and SNR compared with current standard clinical MRA sequences.
High-field clinical fMR imaging
fMR imaging is a noninvasive technique widely used to study brain function in humans. Blood oxygenation level-dependent (BOLD) fMR imaging takes advantage of the different magnetic properties of oxygenated (oxy-Hb) and deoxygenated (deoxy-Hb) hemoglobin to generate image contrast. Neuronal activity increases local cerebral oxygen consumption, leading to an initial decrease in local oxy-Hb concentration and an increase in the deoxy-Hb in the functional area. Within a few seconds, there is an increase in blood flow in the capillaries and draining veins, with the result that deoxy-Hb is gradually washed out, leading to a reduction of local field inhomogeneity and an increase in the BOLD signal in T2∗-weighted MR images. The technique thus takes advantage of the differences in magnetic properties of oxy-Hb and deoxy-Hb to generate image contrast. A typical fMR imaging scan involves 20 to 30 seconds of task phase alternating with rest phase while a subject is presented with visual or auditory stimuli in the scanner. After preprocessing steps including removal of motion-related artifacts, and coregistration with the structural scan, images are generated that show areas of activation (ie, brain areas engaged during the specific task). These images are routinely reported with statistical thresholds that are applied to optimize the specificity and sensitivity of the functional activation. High sensitivity in identifying different functional areas and its noninvasiveness, obviating injection of any contrast, has led to increasing use of this technique in presurgical planning. Because of its high spatial and temporal resolution compared with other neuroimaging methods that use radioactive tracers, fMR imaging is used to identify areas of functional relevance or eloquent cortex as part of presurgical planning in patients with brain tumors, epilepsy, and vascular lesions to reduce the risk of morbidity associated with different treatment options. Patients with lesions are scanned while performing tasks that activate appropriate regions of the cortex, and the relative distance between the lesion and the activation areas provides a measure of risk involved in surgery.
The last decade has seen a proliferation of high-field MR scanners (3–4 T) and very high-field scanners (>4 T) throughout major research centers in the world. This situation is primarily a result of the linear relationship between the magnetic field strength (B 0 ) and the SNR, with more protons aligned with the main magnetic field. The use of improved pulse sequences and high SNR coils also yields increased spatial resolution, which allows for the scanning of deeper subcortical structures. Several factors have contributed to the growing use of 3 T scanners: the more than doubled increase in T2∗ sensitivity at 3 T compared with 1.5 T leads to greater dephasing of the proton signal, in turn leading to better visualization of blood oxygen changes at the vascular level. 3 T also facilitates acquisition of images with higher resolution at an accelerated rate because of the application of parallel imaging. Parallel imaging reduces the number of steps necessary in image acquisition as a result of the use of multiple radiofrequency (RF) receiving coils, each of which can acquire images faster and at shorter echo times (TEs), reducing artifacts and noise. Important scan sequences can therefore be performed more routinely in a 3 T than in a 1.5 T scanner. Although several other factors including magnetic field inhomogeneities and RF flip angle govern the observed SNR, the signal to noise gain is approximately doubled (about 1.7–1.8 times) from a 1.5 T to a 3 T scanner. Although the increase in field strength is accompanied by increase in SNR, high-field imaging has some limitations, the most important being the increased sensitivity of the images to magnetic field inhomogeneities, leading to geometric distortion in the images and nonuniform intensity. The differing susceptibility of neighboring tissues and poor shimming effects leads to these field inhomogeneities. The susceptibility effect can be large in areas of air-bone and air–soft tissue interface and may lead to signal loss in those regions. However, the advances in scan sequences and software, the use of echo-planar imaging (EPI), and the acquisition of field maps representing the field inhomogeneity across the images to correct for distortions in the EPI scans have led to improvement in the quality of the images.
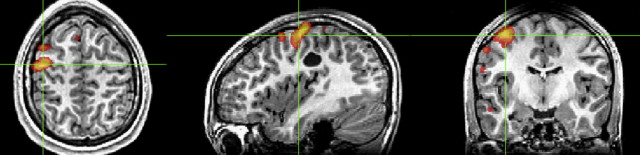
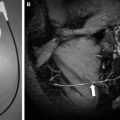
Several clinical functional imaging studies in recent years have provided evidence that fMR imaging at 3 T provides high-quality activation maps with a high degree of confidence in the localization of functional areas. There is evidence that the increase in field strength from 1.5 T to 3 T increases the percent signal change as a result of the BOLD effect, for example, from 1% to 2% to 3% to 4% for motor paradigms. Clinical fMR imaging can contribute effectively to preoperative decision making; fMR imaging maps can inform surgeons about the risk-benefits involved in surgery, contribute to making recommendations regarding patients suitable for invasive intraoperative mapping, and select an optimal surgical route to resect the tumor ( Fig. 1 ). More recent advances in clinical functional imaging include the availability of fully integrated fMR imaging systems that can handle the complete pipeline from data acquisition and paradigm delivery to technologist-driven streamlined processing. These systems offer a set of task paradigms for language and motor mapping that elicit reliable activations in the corresponding functional areas. With growing advances in pulse sequences and parallel imaging techniques, 3 T imaging has seen increased application in pediatric patients. The increased spatial resolution provides pediatric scans with superior anatomic details, leading to better visualization of small structures such as nerves and vessels. This advantage is especially useful in imaging children with epilepsy because it allows for better visualization of hippocampi and cortical dysplasia. The shorter scan time is especially useful in children, who may not be able to hold still for a long time.
Because of the large number of studies that have shown the usefulness of fMR imaging in the mapping of eloquent cortex as well as language lateralization, the last couple of years have seen increased efforts in the development and advancement of high-field intraoperative MR imaging. The usefulness of integrating functional data with neuronavigational systems, availability of neuronavigational tools that help to update the brain position intraoperatively, the ability to operate with routine surgical instruments, and also the ability to confirm complete resection have made intraoperative MR imaging increasingly attractive to neurosurgeons and neuroradiologists alike. Although few studies have used intraoperative fMR imaging for presurgical planning, there is some evidence that in patients with brain tumors, this holds promise in terms of achieving total resection in most patients and is associated with improved postoperative outcomes.
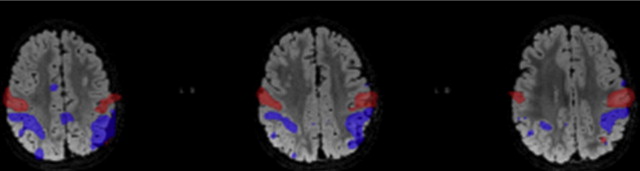
A relatively recent development in functional neuroimaging is the discovery that spontaneous low-frequency fluctuations occur in the BOLD fMR imaging signal during the resting condition in the absence of any explicit task performance or stimulation. Individuals are typically asked to rest with their eyes closed or open or fixating on a crosshair. The BOLD fMR imaging signal is recorded and analyzed to identify correlations between different brain area and is referred to as resting-state functional-connectivity MR (rs-fcMR) imaging. These rs-fcMR imaging maps have shown that brain regions with similar function, such as the right and left motor cortices, show coherent BOLD fluctuations even in the absence of any motor movements ( Fig. 2 ). Although few studies have specifically examined the effect of high-field strength on rs-fcMR imaging correlations, similar to task fMR imaging, high-field-strength systems could provide increased SNR, which also allows for detailed investigation of temporal fluctuations in rs-fcMR imaging, which may be important in specific neurologic disorders (eg, epilepsy ).
Given that rs-fcMR imaging studies require minimal patient compliance and can be used in different patient populations (eg, brain neoplasms, epilepsy, autism, schizophrenia, Alzheimer disease (AD), patients under anesthesia), several recent studies have used an rs-fcMR imaging approach to study different neurologic and psychiatric conditions. The motivation for applying rs-fcMR imaging to patients also stems from the differences in SNR in task versus resting states. Although the resting human brain consumes 20% of the energy of the body, task-related increase in neuronal metabolism is smaller (<5%). In addition, differences in task-related changes between healthy volunteers and diseased populations is still smaller (<1%). Furthermore, investigations into SNRs derived from task versus resting fMR imaging has shown that rs-fcMR imaging may have approximately 3 times the SNR as task-based fMR imaging. Therefore spontaneous fluctuations in the resting brain may be a rich source of disease-related signal changes ( Table 1 ).
| Procedure | Recommended MR Imaging Research Scan Parameters | Duration (Min) |
|---|---|---|
| 3 plane localizer , 2D gradient echo, fast | FOV, 24.0 cm; slice thickness, 10.0 mm; slice spacing, 2.5 mm Freq, 256; phase 128, NEX, 1.00; phase FOV, 1.00 cm | 2 |
| Calibration scan 2D gradient echo, fast | FOV, 30.0 cm; slice thickness, 6.0 mm; slice spacing, 0.0 mm; number of echoes, 1 | ∼10 seconds |
| 3D Ax gradient echo StealthBravo (with and without contrast) | TR, 9.228 ms; TE, 3.716 ms; slice thickness, 1.2 mm; slice spacing, 1.2 mm; acquisition matrix, 256 × 256; flip angle, 13; | ∼3 |
| EPI BOLD scan: gradient echo (4 task blocks alternating with 4 control blocks, each block = 20 s) | TE, 30 ms; TR, 2000 ms; flip angle, 75; FOV, 24.0 cm; freq, 256; phase, 256; freq DIR, R/L; slice thickness, 4.0 mm; slice spacing, 0.0 mm; | 3 |
| DTI | 56 directions; FOV, 25.6 cm; slice thickness, 2 mm; spacing, 0 mm; matrix, 128 × 128; NEX, 1; b-value, 2000; TE, 76.6 ms; TR, 9000 ms |
High-field DTI
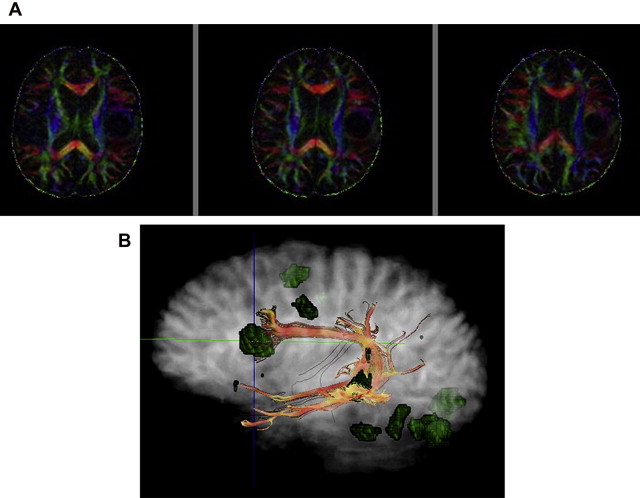
DTI is a clinically useful, model-based technique that attempts to characterize the three-dimensional (3D) diffusion profile in a voxel. Exponential signal decay related to dephasing from Brownian motion is sampled in many different directions and corresponding diffusion coefficients are calculated. These directionally specific diffusion coefficients are entered into a 3 × 3 diffusion tensor matrix and resolved into the eigenvalues and eigenvectors that define the 3 principle directions of diffusion in a voxel. Scalar metrics such as fractional anisotropy (FA) are derived from the eigenvalues of the diffusion tensor matrix. Ranging from 0 to 1, FA provides a quantitative measure of difference between the 3 eigenvalues in a given voxel. Higher FA (approaching 1) corresponds to a larger difference and alludes to the dominant orientation of diffusion in a voxel. Because intact axons are believed to be the main determinant of anisotropic diffusion in the brain, further influenced by the presence or absence of myelin, directionally encoded color FA maps of the brain can resolve the orientation of the major WM highways in the brain and are commonly interpreted alongside BOLD fMR imaging for preoperative planning. Diffusion tensor tractography can also be performed to render a certain WM tract in 3 dimensions. With certain caveats, metrics such as FA, mean diffusivity (MD), and other scalar metrics such as axial and radial diffusivity have been studied as tools to smoke out disease otherwise covert or wholly nonspecific on conventional MR imaging.
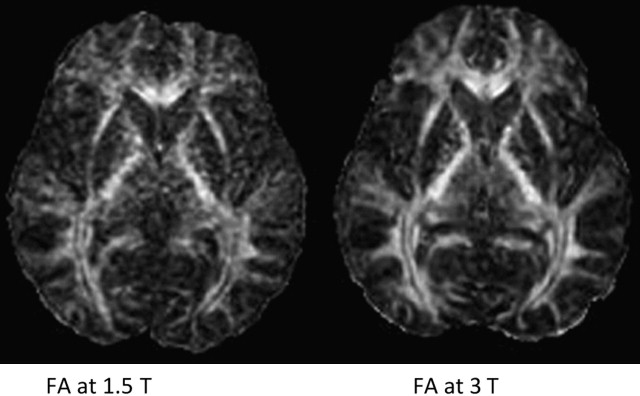
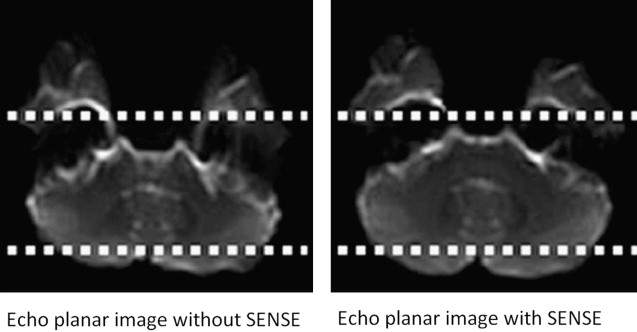
In the brain, DTI has significant improvements when performed at higher field strengths, and these benefits come mostly as gains in signal to noise. Using 8-channel head coils at 3 T, Alexander and colleagues, showed near 100% increase in SNR for DTI performed at 3 T over 1.5 T. These investigators emphasized that the increased sensitivity provided by multiple coils was necessary to harness full 3 T potential. Improved signal leads to more accurate calculation of directionally specific diffusion coefficients, which in turn leads to more reliable determination of eigenvalues and FA. Because single-shot EPI (SS-EPI) techniques remain the workhorse for functional imaging, the challenges of higher B o acquisitions in this setting begin to surface. The gains in signal to noise with DTI at 3 T or even 7 T must be pitted against greater geometric distortions and off-resonance effects in areas prone to susceptibility artifact. Further, long echo train lengths in the absence of refocusing pulses in SS-EPI predispose the image to off-resonance effects and blurring. Novel methods of filling k-space such as periodically rotated overlapping parallel lines with enhanced reconstruction (PROPELLER), when combined with SS-EPI, have been shown to reduce these effects in DTI at 3 T by shortening acquisition time while oversampling the center of k-space relative to the periphery, improving image contrast. In addition, parallel imaging techniques such as SENSE (sensitivity encoding) and ASSET (array spatial sensitivity encoding technique) are becoming necessities to an armory of techniques keeping susceptibility effects, geometric distortion, and off-resonance effects at bay. The goal of parallel imaging is to shorten acquisition time by reducing the number of required phase encode steps. This goal is accomplished with multichannel coils, each positioned in parallel so to listen to its own small field of view (FOV). However, the small FOV per receiver element also has the result of intentional aliasing, from which valuable secondary information, in the setting of different coil sensitivities, can be obtained. Taking into account all of the primary and secondary (aliased) information from the different receiver elements, a system of linear equations is used to assemble a full FOV image with fewer phase encode steps. The result is a faster acquisition, a shorter echo train, and a sharper image with less geometric distortion at higher field strengths. Although parallel techniques have a small fundamental loss of SNR because they operate with fewer phase encode steps (SNR decrease in the order of 19% per Alexander and colleagues ), the gains in image quality and overall SNR at higher field strengths make them worth this small price ( Figs. 3–5 ).
These improvements of DTI at 3 T translate into increased reliability of the tool in the clinical setting, particularly with regard to quantitative measures such as FA or MD as well as fiber tractography. For example, Song and colleagues showed differences between axial (the largest eigenvalue) and radial diffusivity (the mean of the 2 less eigenvalues of the diffusion tensor) in disorders of myelination. Improved SNR will improve reliability and consistency of such metrics. Several groups have also found significant benefits of parallel imaging and 3 T DTI in the spinal cord, a notoriously difficult structure to image given its narrow (1-cm) width, surrounding cerebrospinal fluid (CSF) pulsations, and susceptibility imposed by the bony spinal column. In particular, Hesseltine and colleagues found significant differences in FA in the dorsal, lateral, and central spinal cords of patients with MS compared with those the more anterior changes common to degenerative disease. Newer, reduced FOV diffusion-weighted image techniques have shown even better image quality, and along with cardiac gating, these techniques may further improve 3 T DTI acquisitions of the spinal cord. Although changes in FA have been applied to many different disease states (it remains a nonspecific measure), perhaps one of its greatest benefits will be as an indicator of occult disease, otherwise invisible on conventional MR imaging. This benefit could be particularly relevant to patients with multiple sclerosis who have clinical symptoms despite negative conventional imaging. Information of this nature could affect clinical decision making, especially if baseline quantitative studies differed from those of the acute phase. Reliable interpretation of FA, particularly changes in FA, should be as standardized as possible. Different MR scanners may produce different FA results, even within the same vendor.
Upadhyay and colleagues applied an innovation to DTI called diffusion tensor spectroscopy (DTS) to investigate differences in architecture of the right versus left arcuate fasciculus. Although DTI most commonly focuses on molecular diffusion of water, which is found in both intra-axonal and extra-axonal compartments, these investigators used DTS to specifically seek out diffusion properties of N -acetylaspartate (NAA), which is confined to the intra-axonal space. Images were acquired at 3 T using SENSE parallel imaging. Conventional DTI was first performed to isolate the arcuate fasciculus as a target for DTS. DTS was then performed with point-resolved spectroscopy (TE 135 milliseconds) combined with diffusion-sensitizing gradients to obtain directionally specific water and NAA spectra and diffusion information. Both NAA and water diffusion tensors were filled and respective eigenvalues were obtained, from which scalars including trace apparent diffusion coefficient, FA, radial, and axial diffusivities were calculated. The investigators found asymmetrically increased radial diffusivity of NAA in the left arcuate fasciculus, suggesting increased axonal diameters.
Although there are significant improvements in signal to noise and image quality at 3 T, it is necessary to revisit a fundamental concept in DTI to understand its limitation, regardless of the perfect acquisition at even the highest field strengths. These limitations are particularly relevant assessing FA as well as for tractography for those investigators interested in functional connectivity of the brain. Again, DTI is a model-based technique that is rooted in probability theory. The model assumes, in the absence of barriers that might constrain diffusion, that a spherical probability density function (PDF) would emerge. Specifically, the PDF is a 3D Gaussian distribution reflecting the proportion of water molecules displaced from the origin outward to a certain radius after a certain time. As time passes, the radius of the PDF becomes larger, expanding with the square root of time following stochastic theory and the Einstein equation r = √6Dt (D = diffusion coefficient, t = time). Each concentric layer of the sphere essentially represents a probability isosurface at a certain displacement or radius (ie, the proportion of water molecules diffusing outward from the origin to a certain distance). At more distant radii, a given isosurface is more sparsely populated by water molecules. The highest proportion of water molecules have traveled the smallest radius and congregate near the origin. Along with time and temperature, the diffusion coefficient D of water (or whatever the molecule happens to be) is also a contributor to its displacement. For clinical neuroimaging, temperature is essentially body temperature.
A diffusion tensor demands at least 6 diffusion coefficients to compute the eigenvalues and eigenvectors necessary to characterize the 3 principle directions of diffusion in a voxel. Even although 6 (or potentially 20–30) directionally specific diffusion coefficients have been collected, the model-based constraints of DTI distill this information down to 3 principal orientations. These directions can be visually rendered as color-coded probability isosurfaces, or ellipsoids, which are essentially spheres molded by the eigenvalues and eigenvectors specific to a voxel. Of these isosurfaces, 3 dominant shapes can arise: (1) prolate (cigar-shaped) (2) oblate (UFO-shaped or saucer-shaped), or (3) spherical. DTI tractography methods such as fiber assignment by continuous tractography attempt to link dominant eigenvector orientations, voxel to voxel, beginning from multiple points within a seed voxel. Although a family of resultant fiber tracts can arise from different geometric orientations borne in the seed voxel, the ultimate fiber tract is something of a summary of a summary. The largest eigenvector summarizes the principal direction of diffusion within a single voxel, and DTI tractography methods summarize diffusion patterns across several contiguous voxels. DTI tractography is most robust in areas populated by prolate tensors and concordantly these areas feature intrinsically higher FA. When a growing tract encounters progressively lower FA regions, or if the FA constraints on the growing tract are lowered, a wider array of tracts emerge. Further, as a fundamental limitation of the tensor model, intravoxel crossing WM tracts cannot be resolved by DTI. Despite idealized conditions (no motion, no noise) and even the highest field strengths, a symmetric intersection of 3 orthogonal WM tracts is imaged as a spherical tensor with FA = 0. As a result, tractography methods may generate nonphysiologic pathways, begging a careful approach to choosing seed points and a working knowledge of the anatomy.
To break free of these limitations, model-free methods of high angular resolution WM imaging were developed, notably diffusion spectrum imaging (DSI) and q-ball imaging (QBI). Using higher b-values and novel schemes of filling q-space (a 3D repository organizing diffusion-weighted images obtained at varying b-values in different directions), these methods attempt to more directly characterize molecular displacement (radii) in many different directions. For example, more than 500 directions are sampled in DSI and more than 60 directions are common in QBI. With these techniques, a more realistic representation of intravoxel diffusion can be rendered as a complex 3D shape called an orientation distribution function (ODF).
When studying diffusion along 1 particular direction, the distribution of water molecules can be depicted as a histogram, with higher density of water molecules near the origin and more sparsely populated at further distances. Summing the entire histogram (integrating under the curve) provides a measure of overall diffusion in that direction. This area is translated into a specific diffusion radius, which can be thought of as a strut of a specific length supporting its portion of the ODF surface. When performed in many directions, many struts of varying lengths are produced, and are used to construct the final ODF. Although analogous to the ellipsoids of DTI in that they reflect diffusion patterns in 3D, the ODFs of DSI and QBI are distinctly more complex shapes that can depict intravoxel crossing fibers. To understand the difference, imagine a simple orthogonal intersection of 2 fiber bundles within a given voxel. DTI would image this arrangement as a saucer, whereas DSI and QBI would attempt to render a cruciate object like a 4-leaf clover. The orientation of the leaves of the object, now visible and defined, can be incorporated into growing fiber tracts through this voxel and beyond. In contrast to model-based DTI, where essentially only three dominant, predicted ellipsoid shapes can emerge from the analysis, model-free DSI and QBI can render distinctly unique shapes that cannot be predicted by a model. QBI at 3 T has recently confirmed a more complex organization of the arcuate fasciculus, the principal language-processing WM highway in the brain. Until recently, the arcuate fasciculus was believed to essentially connect Broca and Wernicke language centers; however, DTI and high-angular resolution QBI techniques have shown that language connections also run alongside the classic arcuate fasciculus, such as in the extreme capsule, and have terminations in different areas of cortex, particularly the intraparietal region. Further, relay stations in the premotor area via Geschwind fibers have been elucidated in better detail.
Given minute difference in diffusion trends within a voxel, estimation of specific struts (radii) for the ODF demands exquisite SNR and high b-values. In an attempt to investigate the benefits of tensor-free techniques at ultrahigh-fields, Mukherjee and colleagues imaged supratentorial crossing tracts with QBI at 3 T and 7 T in healthy volunteers. These investigators reported 79.5% and 38.6% boosts in SNR at b = 3000 s/mm 2 and b = 6000 s/mm 2 , respectively, with the 7 T acquisition. Higher b-values (6000 s/mm 2 ) at 7 T, although not showing as high a gain in SNR compared with b = 3000 s/ mm 2 , helped sculpt the ODF, which improved high-angular resolution. Despite these gains in SNR and refinement in the ODF, the investigators did emphasize the exacerbation of susceptibility effects near the skull base at 7 T, suggesting that the greatest advantage of the ultrahigh-field QBI technique may come in imaging supratentorial tracts with application of parallel imaging techniques.
It seems that advancements in study of brain connectivity at higher field strengths will evolve alongside refinements in techniques such as multichannel parallel imaging ( Table 2 ).
| Procedure | Recommended MR Imaging Research Scan Parameters | Duration (Min) |
|---|---|---|
| DTI | 56 directions; FOV, 25.6 cm; slice thickness, 2 mm; spacing, 0 mm; matrix, 128 × 128; frequency, direction right/left; NEX, 1; b-value, 2000; TE, minimum; repetition time, 9000 ms | 5–10 |
Cortical thickness
High-resolution structural imaging coupled with advances in image processing has enabled researchers to investigate properties of the cortical thickness or surface at submillimeter resolution. The importance of these tools has recently been underscored in a review by Van Essen and Dierker, who concluded that cortical surface analysis can be invaluable for investigating cortical changes in individuals, improves localization of results, and provides a framework to compare results (eg, integrate information from previous studies to a single patient in a clinic). These ideas are driving surface-based analyses in the Human Connectome Project ( http://humanconnectome.org/ ).
In the past, several free software packages have been used to create cortical surface representations, including FreeSurfer ( http://surfer.nmr.mgh.harvard.edu/ ), CARET ( http://brainvis.wustl.edu/wiki/index.php/Caret:About ), and SUMA ( http://afni.nimh.nih.gov/afni/suma ). Currently, FreeSurfer and CARET dominate the research world. CARET has now changed to using FreeSurfer to create its cortical surfaces as well, although the registration methods differ (see later discussion). In addition, similar methods have been commercially developed. One such package, NeuroQuant developed by CorTech Labs ( http://www.cortechs.net/ ), is almost identical to FreeSurfer. NeuroQuant is now approved by the US Food and Drug Administration (FDA) for use in diagnostic imaging. Thus, from a research perspective, methodology can be freely developed using FreeSurfer and then migrated to a commercial FDA-approved platform such as NeuroQuant.
Cortical surface analysis requires 3 steps: segmentation, surface creation, and normalization. The failure or inaccuracies in any 1 step propagate through the processing stream to the final metrics. For example, if the segmentation misclassifies the tissue as CSF instead of gray matter (GM), then the computed pial surface is in the middle of the cortical ribbon along the edge of GM and CSF based on the segmentation.
The FreeSurfer segmentation has developed over time, but still requires manual intervention to produce the highest-quality segmentations. The T1-weighted MR image is transformed to the Talairach atlas. Next, the main body of WM is identified by atlas location, intensity, and neighbors, and the variation in intensity across WM is used to correct the B1 bias in the image. The image is then skull stripped leaving only the brain. The remaining voxels are classified as WM or non-WM based on intensity and neighbor constraints.
The FreeSurfer surface creation has also been refined over time, but in principle has not changed. First, the cerebellum, pons, and brainstem are removed and the hemispheres are split. Then, for each hemisphere, an initial surface is created along the edge of the WM and refined to follow the WM/GM intensity gradient. Next, this surface is pushed outward until the intensity gradient between GM and CSF is reached, or the pial surface. In CARET, the midthickness of the pial and GM/WM surface is used and is computed by averaging the 2 FreeSurfer surfaces.
The FreeSurfer normalization process can be divided into 2 parts. First, the surface is inflated into a sphere. Next, the sulcal and gyral pattern is aligned to FreeSurfer average surface. After normalization, the surface is resampled into a common reference space, with the same number of nodes, or points, on the surface to analyze the results across individuals node by node or regionally.
The CARET normalization process similarly involves 2 steps. First, the surface is inflated into a sphere. Next, 6 core landmarks that have the most consistency across individuals (calcarine sulcus, central sulcus, anterior half of the superior temporal gyrus, sylvian fissure, and the dorsal and ventral parts of the medial wall boundary) are identified. These landmarks are aligned to the PALS (population-average, landmark and surface-based) atlas landmarks. After normalization, the surface is resampled into a common reference space, with the same number of nodes, or points, on the surface to analyze the results across individuals node by node or regionally.
Both FreeSurfer and CARET report increased overlap of cortical areas compared with volume registration, validating the need for surface-based methodology. In comparing these 2 programs, Zhong and colleagues concluded that if one wants to preserve curvature/gyral estimates, then CARET should be used, whereas if one wants to use cortical parcellation to interrogate the data, then FreeSurfer should be used.
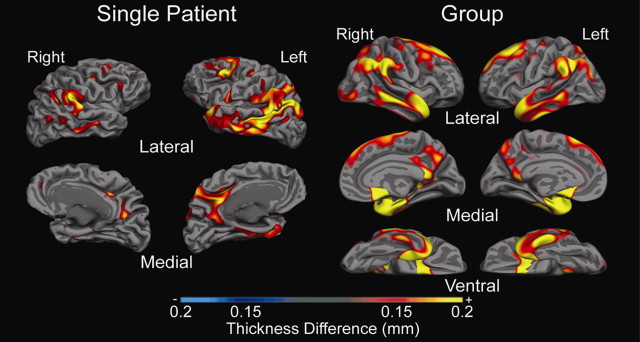
Both FreeSurfer and CARET have revealed important scientific and clinical findings related to brain morphology. For example, CARET was used to show that the olfactory sulcus was shallower in patients with Williams syndrome compared with healthy controls. Results from FreeSurfer typically focus on cortical thickness and have shown effects in patients with AD, Parkinson disease, depression, attention-deficit/hyperactivity disorder, epilepsy, schizophrenia, and many others. Differences have also been reported based on age, genotype, and amyloid deposition. Most studies focus on identifying group differences or correlations; however, Dickerson and colleagues used the difference between patients with AD and healthy controls to show that thinner cortices in areas of group differences predict the conversion to AD. Theses investigators termed this difference the Alzheimer signature. Future work will likely investigate which areas are predictive of different diseases or disorders. Currently, only T1-weighted images are typically used in these packages; however, FreeSurfer has recently developed a surface-based tractography tool, TRACULA, which is now publicly available. The integration of DTI and other modalities could be used in preoperative planning. Although cross-sectional studies are potentially more useful in the clinic, FreeSurfer also has a longitudinal processing stream that enables atrophy to be tracked over time. The use of longitudinal imaging has potential as a biomarker in clinical trials.
Surface-based analysis has been shown to have clinical implications from both a basic science perspective and from a treatment perspective. The use of surface-based image analysis clinically and in research will bring many benefits to patients ( Fig. 6 , Table 3 ).
| Procedure | Recommended MR Imaging Research Scan Parameters | Duration (Min) |
|---|---|---|
| 3D TR-weighted, Ax FSPGR BRAVO (high-resolution structural images) | Flip angle, 12; FOV, 25.6 cm; repetition time, 8.2; TR, 450 ms; TE, 3.2 ms (ARC on); number of echoes, 1; slice thickness, 1.0 mm; frequency, 256; phase, 256; frequency direction, right/left; NEX, 1; phase FOV, 1 cm | ∼4 |
ASL perfusion
Arterial spin labeling (ASL) is a noninvasive MR imaging method for the measuring of cerebral perfusion or cerebral blow flow (CBF), a measure quantified in units of mL/g/min. CBF reflects the volume of flow per unit brain mass per unit time. Two commonly adopted methods for the measuring of brain perfusion include the dynamic susceptibility contrast (DSC) approach, in which an intravascular contrast agent such as gadolinium is injected into the blood stream, and ASL, in which arterial blood water works as the endogenous tracer.
DSC perfusion MR imaging is the current method of choice for clinical use as it provides the most thorough evaluation of perfusion. DSC perfusion not only provides information regarding blood flow, but blood volume and transit time as well. However, the use of gadolinium-based contrast agents has raised concerns as it has been recently associated with nephrogenic systemic fibrosis, a new and rare disease of unknown cause that affects patients with significant renal insufficiency. Alternatively, ASL offers gadolinium-free method for conducting perfusion MR imaging with no injection of exogenous tracers, but with magnetically labeled arterial blood water serving as the endogenous flow tracer.
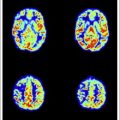
ASL typically works by magnetically tagging the arterial blood just upstream of the area of interest using RF, followed by an image acquisition of the tagged arterial blood in the plane or volume of interest. The effects of ASL are generated by a pair-wise subtraction of the image acquired from magnetically labeled arterial blood water and the image acquired from a nonmagnetized blood water control condition. Fig. 7 presents the ASL perfusion images from a patient with bilateral occipital lobe ischemic stroke (top) compared with the aged-matched control (bottom). Not only is a perfusion deficit observed in the area of the stroke but also an overall reduction of brain perfusion is recorded in the patient’s perfusion image. The intensity scale of the 2 sets of images is identical (8–80 mL/g/min) (see Fig. 7 ).
Related posts:
 Stroke: High-Field Magnetic Resonance Imaging
Current State-of-the-Art 1.5 T and 3 T Extracranial Carotid Contrast-Enhanced Magnetic Resonance Angiography
Ultrahigh-Field Magnetic Resonance Imaging: The Clinical Potential for Anatomy, Pathogenesis, Diagnosis and Treatment Planning in Neck and Spine Disease
Stroke: High-Field Magnetic Resonance Imaging
Current State-of-the-Art 1.5 T and 3 T Extracranial Carotid Contrast-Enhanced Magnetic Resonance Angiography
Ultrahigh-Field Magnetic Resonance Imaging: The Clinical Potential for Anatomy, Pathogenesis, Diagnosis and Treatment Planning in Neck and Spine Disease
 Vascular Disorders: Insights from Arterial Spin Labeling
 Pediatric High-Field Magnetic Resonance Imaging
 Ultrahigh-Field Magnetic Resonance Imaging: The Clinical Potential for Anatomy, Pathogenesis, Diagnosis and Treatment Planning in Neck and Spine Disease
Stay updated, free articles. Join our Telegram channel

Full access? Get Clinical Tree


