Chapter 4
Cystic diseases of the liver
Ersan Altun1, Mohamed El-Azzazi1,2,3,4, Richard C. Semelka1, and Miguel Ramalho1,5
1The University of North Carolina at Chapel Hill, Department of Radiology, Chapel Hill, NC, USA
2University of Dammam, Department of Radiology, Dammam, Saudi Arabia
3King Fahd Hospital of the University, Department of Radiology, Khobar, Saudi Arabia
4University of Al Azhar, Department of Radiology, Cairo, Egypt
5Hospital Garcia de Orta, Department of Radiology, Almada, Portugal
Cystic focal liver lesions can be classified as
- Developmental
- Neoplastic
- Inflammatory or
- Miscellaneous.
The identification and recognition of different types of cystic focal liver lesions are extremely important in order to determine the clinical implications, treatment, and management strategies (1–5).
Cystic focal liver lesions may be benign or malignant. Morphologically, they may be classified as
- Simple or complex.
- Solitary or multiple.
- Sporadic or hereditary.
Developmental cystic lesions
Benign developmental hepatic cysts
- Benign developmental hepatic cysts are the most common benign masses of the liver.
- Liver cysts are generally unilocular (95%). However, they may occasionally be multilocular.
- They may be solitary or multiple, with the latter being the more frequent situation.
- They are generally asymptomatic and incidentally discovered at the fifth to seventh decades of life.
- They are generally simple; however, they may occasionally be complicated with internal hemorrhage and infection, and may be symptomatic due to the presence of pain and fever.
- Large cysts may be symptomatic due to stretching of the liver capsule.
- Asymptomatic cysts require no further workup or treatment (1–5).
- Causes: They are benign congenital and developmental cysts deriving from biliary endothelium that does not communicate with the biliary tree. The current theory is that true hepatic cysts originate from the hamartomatous tissue (4, 5).
- Pathology: The lining of a true hepatic cyst shows a single layer of cuboidal to columnar epithelial cells that rest on an underlying fibrous stroma. A true hepatic cyst contains serous fluid (4, 5).
- Imaging:
- Simple Cysts
- On CT:
- Ovoid or round homogeneous lesions of near-water attenuation value (−10 to 20 HU) with sharply defined margins and smooth thin walls (Figure 4.1). They may occasionally contain a few thin septations.
- Usually do not contain multiple or thick septations, mural nodularity, calcifications, or fluid-debris level.
- Show no enhancement or negligible subtle enhancement after IV contrast in the hepatic arterial dominant, hepatic venous, or interstitial phases of enhancement.
- Small lesions may have a density higher than 20 HU due to partial volume averaging with adjacent hepatic parenchyma, especially on contrast enhanced scans. However, this is generally not a problem for the diagnosis of small cysts on MRI because of the higher soft tissue contrast resolution compared to CT (4, 5).
- Ovoid or round homogeneous lesions of near-water attenuation value (−10 to 20 HU) with sharply defined margins and smooth thin walls (Figure 4.1). They may occasionally contain a few thin septations.
- On MRI:
- Ovoid and round homogeneous well-defined lesions with smooth thin wall, possessing sharp margin with liver.
- Demonstrate moderate to prominent low signal on T1-WIs due to high fluid content.
- Demonstrate prominent high signal on T2-WIs due to high fluid content.
- Show no enhancement or negligible subtle wall enhancement in the early and late phases of enhancement on post-gadolinium sequences; show no change in shape, margination, and appearance from early to late postcontrast images (Figures 4.2–4.4). This observation ensures that lesions are simple cysts and not poorly vascularized metastases that show gradual enhancement (1–5).
- Ovoid and round homogeneous well-defined lesions with smooth thin wall, possessing sharp margin with liver.
- Complex Cysts
- Complex cysts contain hemorrhage or high protein levels, and fluid-debris level; thickened and irregular walls may be seen with complicated cysts.
- On CT:
- Complicated cysts with internal protein or hemorrhage show high attenuation on pre-contrast CT images and show no enhancement or subtle negligible enhancement on post-contrast images including all phases (Figure 4.5).
- On MRI:
- Hemorrhagic cysts and cysts containing high protein levels demonstrate similar imaging features.
- Hemorrhagic cysts may show variable signal intensities on pre-contrast T1-WI and T2-WI according to the age of hemorrhage.
- Hemorrhagic cysts and cysts with high internal protein levels commonly display high signal on T1-WI and may also show very low signal on T2-WI.
- They show no enhancement or negligible wall enhancement (Figures 4.5 and 4.6) (1–5). Comparison of appearance between early and late postcontrast images is essential.
- Hemorrhagic cysts and cysts containing high protein levels demonstrate similar imaging features.
- Differential Diagnosis and Pearls:
- The presence of heterogeneous content, mural nodules, enhancing thick and irregular septations, calcifications, and significantly enhancing cyst wall should raise the suspicion that the cystic lesion may be inflammatory and neoplastic. The differential diagnosis of inflammatory cystic lesions includes abscesses and hydatid cysts. The differential diagnosis of neoplastic cystic lesions includes biliary cystadenoma / biliary cystadenocarcinoma and cystic metastases (such as ovarian cancer, pseudomyxoma peritonei) (1–5).
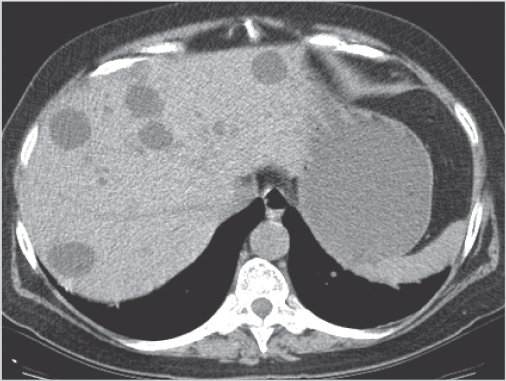
Figure 4.1 Simple cysts. Transverse non-contrast CT scan shows multiple rounded hypodense lesions scattered in both right and left lobes.
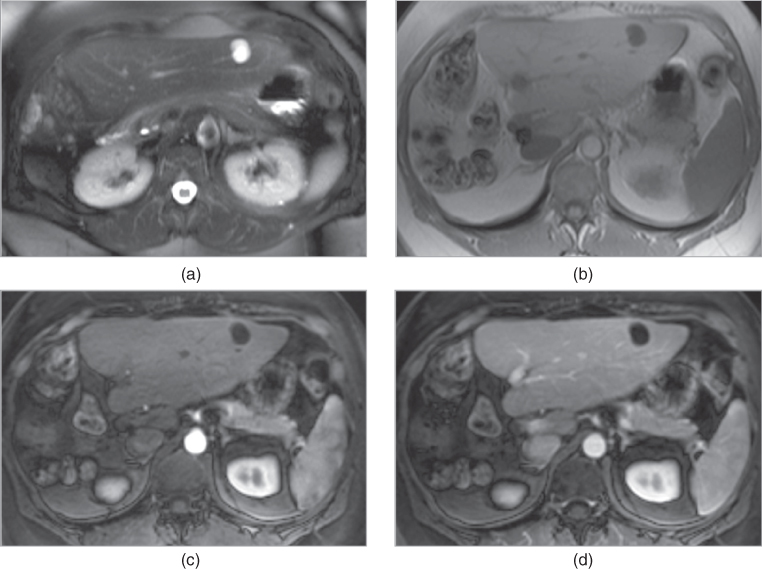
Figure 4.2 Solitary simple cyst. Transverse T2-weighted fat-suppressed single shot ETSE (a), T1-weighted 2D-GE (b), T1-weighted post-gadolinium fat-suppressed hepatic arterial dominant phase (c) and hepatic venous phase (d) 3D-GE images acquired at 3.0 T demonstrate a small solitary simple cyst. The cyst which illustrates markedly high signal on T2-weighted image (a) and low signal on pre-contrast T1-weighted image (b) shows no enhancement on post-gadolinium images (c, d).
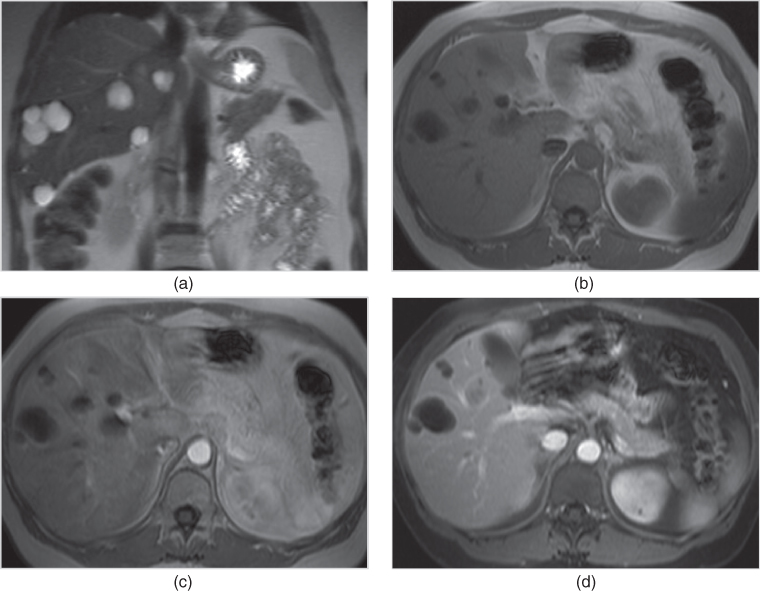
Figure 4.3 Multiple simple cysts. Coronal T2-weighted single shot ETSE (a), T1-weighted 2D-GE (b), T1-weighted post-gadolinium hepatic arterial dominant phase (c) and fat-suppressed hepatic venous phase 2D-GE (d) images acquired at 1.5 T show multiple intermediate size cysts. The cysts which illustrate markedly high signal on T2-weighted image (a) and low signal on pre-contrast T1-weighted image (b) show subtle cyst wall enhancement on post-gadolinium images (c, d).
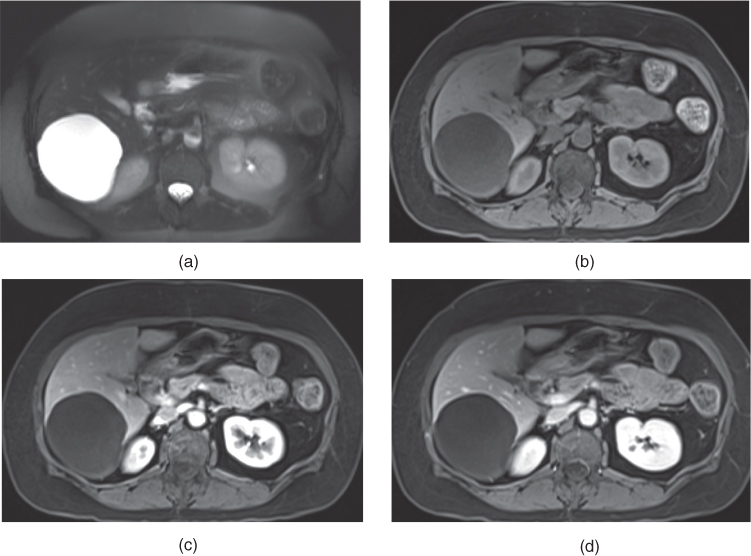
Figure 4.4 Solitary large simple cyst. Transverse T2-weighted fat-suppressed SS-ETSE (a), T1-weighted fat-suppressed 3D-GE (b), T1-weighted fat-suppressed post-gadolinium hepatic venous phase (c) and interstitial phase 3D-GE (d) images acquired at 1.5 T show a large liver cyst. The large cyst which demonstrates markedly high signal on T2-weighted image (a) and low signal on pre-contrast T1-weighted image (b) shows no wall enhancement on post-gadolinium images (c, d).
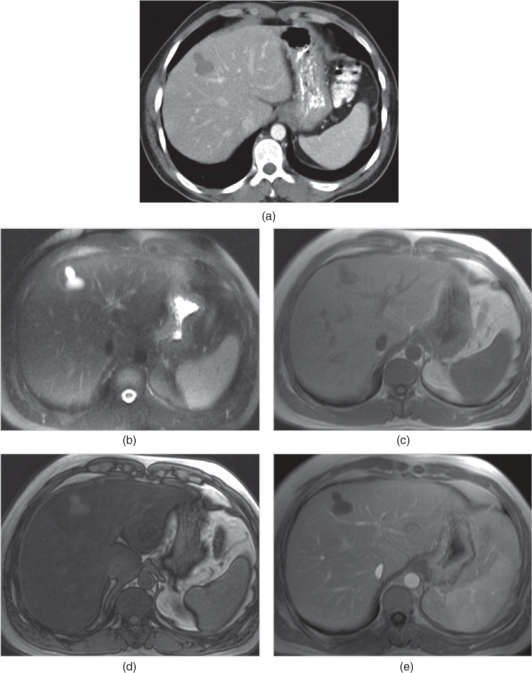
Figure 4.5 Solitary small complex cyst. Transverse hepatic venous phase contrast-enhanced CT scan (a) shows a lobulated cyst with no enhancement. Transverse T2-weighted fat-suppressed single shot ETSE (b), T1-weighted in-phase (c) and out-of-phase (d) 2D-GE, T1-weighted post-gadolinium hepatic venous phase 2D-GE (e) images acquired at 1.5 T demonstrate a lobulated complex cyst with high protein content. Due to its high protein content, the cyst displays high signal on in-phase and out-of-phase SGE images (c, d) without any signal loss on out-of-phase image (d). The cyst does not show any enhancement on post-gadolinium sequences (e). Note the diffuse signal drop on out-of-phase SGE image (d) compared to in-phase image (c) due to diffuse fatty infiltration of the liver.
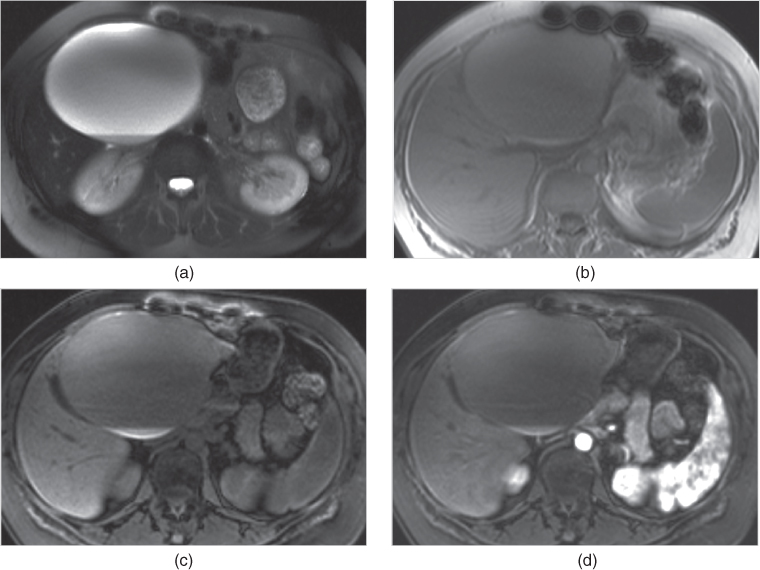
Figure 4.6 Solitary large complex cyst. Transverse fat-suppressed single shot ETSE (a), T1-weighted in-phase 2D-GE (b), T1-weighted fat-suppressed 3D-GE (c), T1-weighted post-gadolinium hepatic arterial dominant phase 3D-GE (d) images acquired at 3.0 T show a large cyst with high protein content. The cyst shows high signal intensity on T1-weighted SGE image (b), and fluid-fluid level with dependant low signal on T2-weighted (a) and high signal on T1-weighted images (b–d); which are consistent with high protein content. Note that the cyst wall does not show any enhancement.
Ciliated hepatic foregut cyst
- Ciliated hepatic foregut cysts are developmental solitary unilocular cysts. They are uncommon benign cysts.
- They arise from the embryonic foregut and differentiate towards bronchial tissue in the liver.
- Pathology:
- The cyst wall consists of four layers, including the innermost layer with pseudostratified ciliated columnar epithelium containing mucous cells, subepithelial connective tissue, abundant smooth muscle, and outermost fibrous capsule.
- They are most commonly located at the anterosuperior margin of the liver or at intersegmental locations and usually bulge (extend beyond) the liver contour (1–5).
- Imaging
- On CT:
- Ciliated hepatic foregut cysts are also well circumscribed oval lesions which show near-water attenuation on pre-contrast CT images with no enhancement or subtle wall enhancement on contrast enhanced CT images (Figure 4.7) (4, 5).
- On MRI:
- Ciliated hepatic foregut cysts demonstrate markedly high signal on T2-weighted image and variable signal intensity on T1-weighted image, including intermediate and high signal, depending on the internal protein content (Figures 4.7 and 4.8). They may show prominent uniform thickness wall enhancement (Figures 4.7 and 4.8) (1–5).
- Differential diagnosis and Pearls:
- Typical location of these cysts is generally suggestive of the diagnosis (Figures 4.7 and 4.8). They may also rarely demonstrate high density or wall calcifications (Figure 4.8g–i). The differential diagnoses of benign developmental hepatic cysts are also true for ciliated hepatic foregut cysts (1–5).
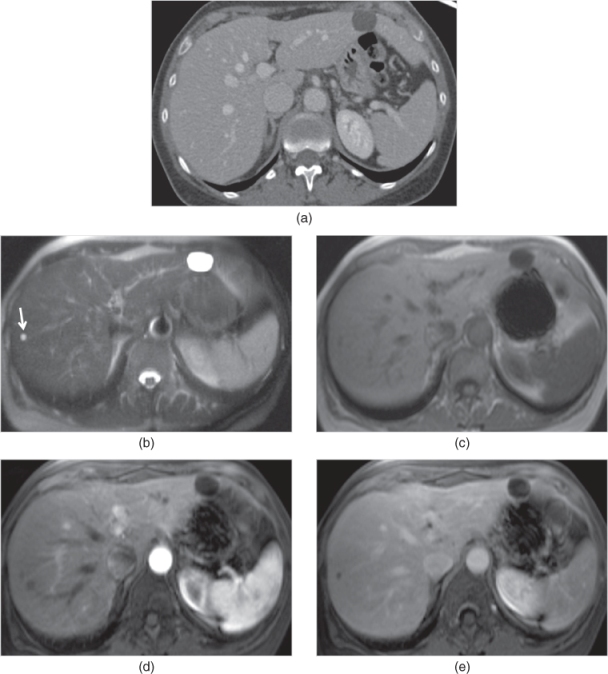
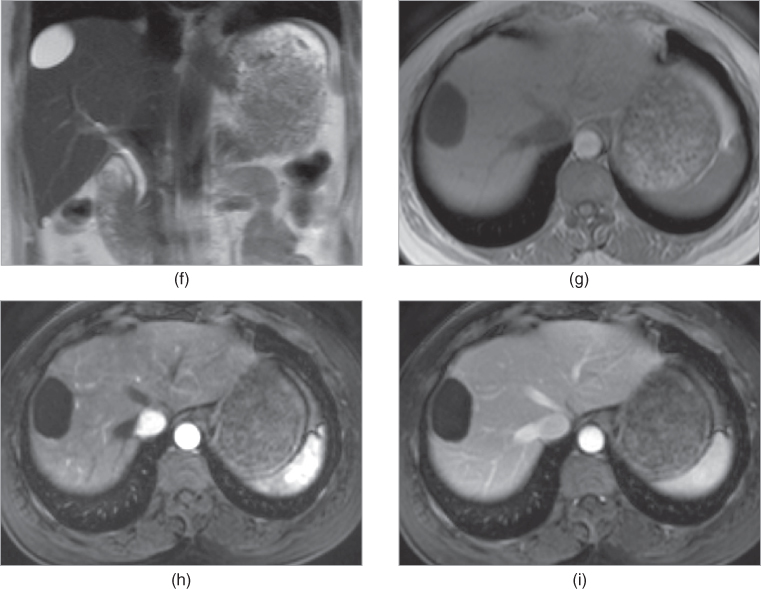
Figure 4.7 Foregut cyst. Transverse hepatic venous phase post-contrast CT image (a) demonstrates a simple foregut cyst, which does not show any wall enhancement, located at the anterior margin of the left lateral segment. Transverse T2-weighted single shot ETSE (b), T1-weighted 2D-GE (c), T1-weighted post-gadolinium hepatic arterial dominant phase (d) and interstitial phase (e) 3D-GE images acquired at 3.0 T demonstrate the foregut cyst located in the left lateral segment. The cyst shows markedly high homogeneous signal on T2-weighted image (b) and low signal on T1-weighted images without any wall enhancement (c–e). Note the presence of a small cyst (arrow, b) in the right liver lobe. Coronal T2-weighted single shot ETSE (f), T1-weighted 2D-GE (g), T1-weighted post-gadolinium hepatic arterial dominant phase (h) and hepatic venous phase (i) fat-suppressed 3D-GE images acquired at 3.0 T show a simple foregut cyst situated at the intersegmental location between segments 7 and 8, in another patient.
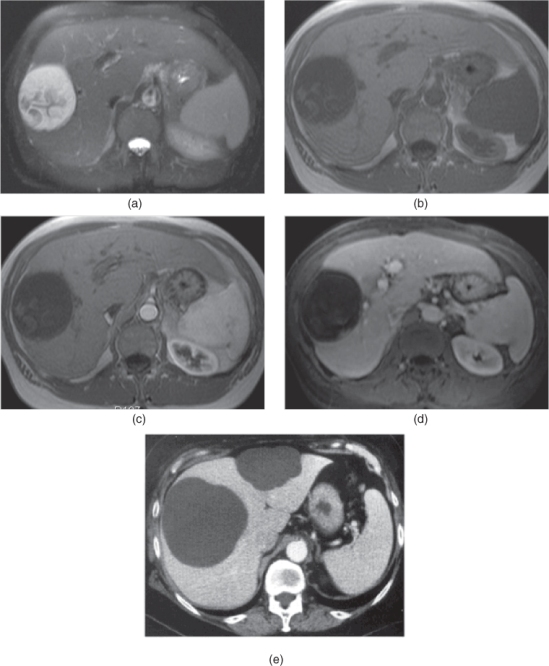
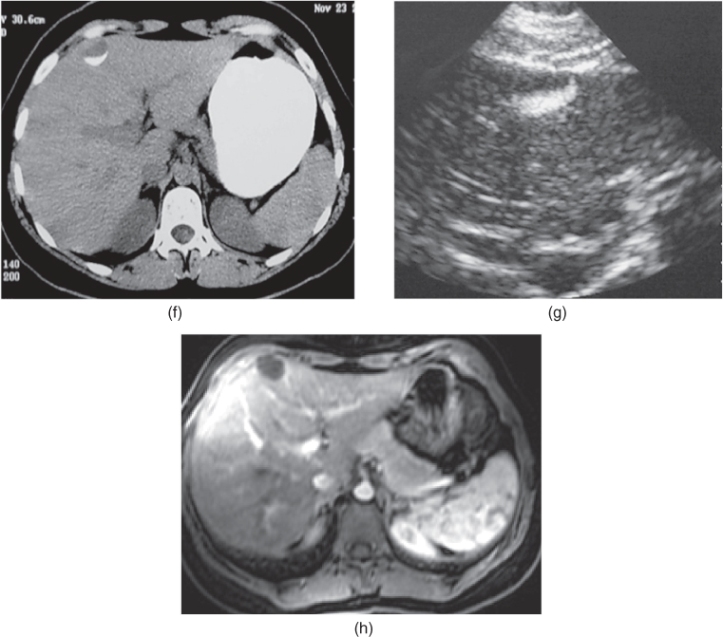
Figure 4.8 Complex foregut cyst. Transverse T2-weighted fat-suppressed single shot ETSE (a), T1-weighted 2D-GE (b), T1-weighted post-gadolinium fat-suppressed hepatic arterial dominant phase 2D-GE (c) and hepatic venous phase 3D-GE (d) images demonstrate a foregut cyst situated at the intersegmental location, in another patient. The cyst shows non-enhancing heterogeneous internal content with low signal on T2-weighted image (a) and relatively high signal on T1-weighted image (b). Large foregut cysts. Transverse contrast enhanced hepatic venous phase CT examination (e) shows two large foregut cysts which are located at the anterior margin of the liver and bulge the liver. Foregut cyst with rim calcification. Transverse non-contrast CT examination (f) and transverse US images (g) show a foregut cyst with rim calcification which shows high attenuation on CT (f) and high echogenicity on US (g). MR image (h) confirms the typical intersegmental location.
Polycystic liver disease
- Isolated polycystic liver disease is a rare distinct autosomal dominant genetic disease in which multiple cysts are present in the liver without any or substantial involvement of the kidneys.
- Most often, polycystic liver disease is associated with autosomal dominant polycystic kidney disease (ADPKD).
- Hepatic cysts are found in 40% of patients with ADPKD.
- Liver dysfunction occurs only rarely even despite extensive involvement. Advanced disease may result in hepatomegaly and compression of vascular structures, and, occasionally, in liver failure.
- Cysts tend to be multiple and smaller than the renal cysts.
- Cysts may undergo hemorrhage and may contain variable amounts of protein; however, this is much less common in the liver than in the kidney.
- Cysts exhibit similar CT and MR features to simple cysts and foregut cysts (Figures 4.9 and 4.10). However, complicated cysts which may contain hemorrhage or variable amounts of protein demonstrate variable signal intensities on T2-WI and T1-WI (Figure 4.10) (6, 7).
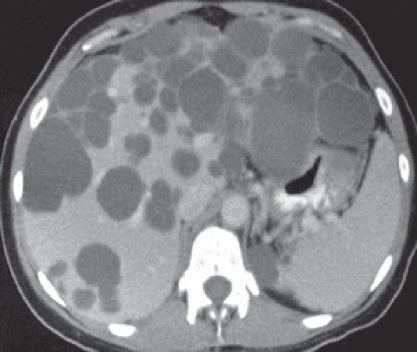
Figure 4.9 Liver cysts due to autosomal dominant polycystic kidney disease. Transverse hepatic venous phase contrast-enhanced CT examination shows multiple liver cysts due to autosomal dominant polycystic kidney disease.
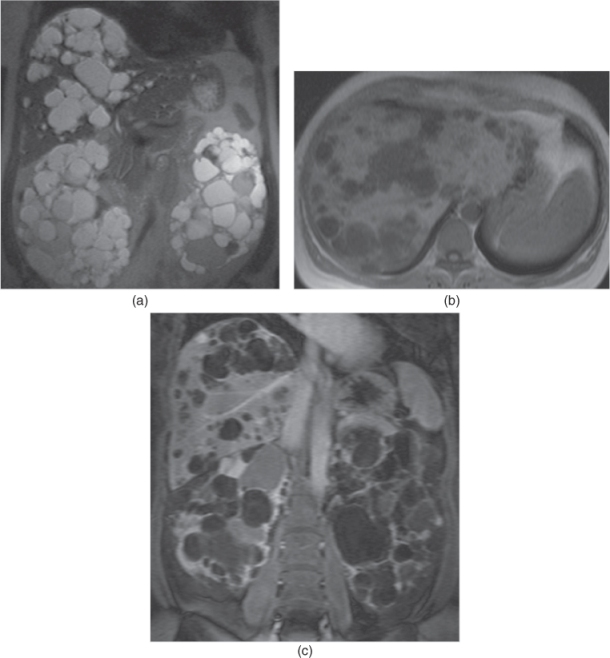
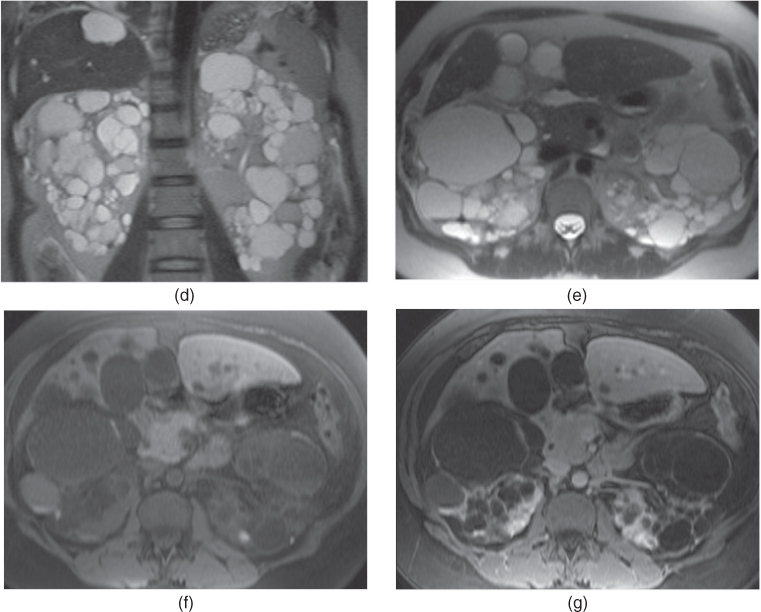
Figure 4.10 Liver cysts due to autosomal dominant polycystic kidney disease. Coronal T2-weighted single shot echo train spin echo (a), transverse T1-weighted 2D-GE (b), coronal T1-weighted fat-suppressed hepatic venous phase 3D-GE (c) images acquired at 3.0 T demonstrate multiple cysts in the kidneys and liver. The enlarged kidneys are replaced with innumerable cysts. Multiple cysts replacing a significant portion of normal liver are present in the liver. Due to their variable protein content, the cysts in the kidneys and liver show variable signal intensity ranging from markedly hypointense to markedly hyperintense signal on T2-weighted image (a) while the liver cysts show intermediate to markedly low signal intensity on T1-weighted image (b). The cysts show no enhancement or subtle wall enhancement on post-gadolinium hepatic venous phase 3D-GE (c). Coronal (d) and transverse (e) T2-weighted single shot ETSE, transverse T1-weighted water excitation MPRAGE (f) and T1-weighted postgadolinium water excitation MPRAGE (g) images demonstrate multiple liver and renal cysts with variable protein content in another noncooperative patient.
Biliary hamartomas
- Biliary hamartomas (also known as von Meyenburg complexes) are common benign malformations of the biliary tract and they are considered to arise from bile ducts that fail to involute.
- Present in approximately 5–10% of patients.
- Biliary hamartomas are generally asymptomatic and detected incidentally.
- Biliary hamartomas are often multiple, in most cases a few in number, but may be extensively scattered throughout the liver (Figure 4.11).
- Biliary hamartomas are round or oval lesions usually sizing less than 1.5 cm in diameter and have a thin appreciable wall, representing a thin layer of compressed liver tissue. Often, biliary hamartomas are smaller, more uniform, and numerous compared to simple cysts.
- They are usually predominantly cystic although they may be occasionally predominantly solid (4, 5).
- Biliary hamartomas may be large in size (Figure 4.11j–l), where they would be termed giant cystic biliary hamartomas, and may be complicated with hemorrhage (8).
- Pathology:
- Biliary hamartomas consist of a collection of small, sometimes dilated, irregular, and branching bile ducts embedded in a fibrous stroma.
- Biliary hamartomas may contain inspissated bile, with no or few vascular channels (4, 5).
- Imaging
- On CT:

Stay updated, free articles. Join our Telegram channel
- They are usually predominantly cystic although they may be occasionally predominantly solid (4, 5).

Full access? Get Clinical Tree


