and Lori Ann Lewis1
(1)
Clinical Research Center of North Texas, Denton, TX, USA
Abstract
Clinical densitometry is relatively new, but densitometry itself is actually quite old. It was first described over 100 years ago in the field of dental radiology as dentists attempted to quantify the bone density in the mandible [1, 2]. With today’s techniques, bone density can be quantified in almost every region of the skeleton. The extraordinary technical advances in recent years have expanded the realm of densitometry from that of a quantitative technique to that of an imaging technique as well. But even the oldest techniques remain both viable and valuable with computer modernization. Densitometry technologies have evolved as our understanding of relevant disease processes has increased. In a complimentary fashion, our understanding of the disease processes has increased as the technologies have evolved. Although current clinical guidelines have focused our attention overwhelmingly on DXA studies of the spine and proximal femur, other technologies for quantifying the bone density and other skeletal sites to which they may be applied are worthy of attention.
Clinical densitometry is relatively new, but densitometry itself is actually quite old. It was first described over 100 years ago in the field of dental radiology as dentists attempted to quantify the bone density in the mandible [1, 2]. With today’s techniques, bone density can be quantified in almost every region of the skeleton. The extraordinary technical advances in recent years have expanded the realm of densitometry from that of a quantitative technique to that of an imaging technique as well. But even the oldest techniques remain both viable and valuable with computer modernization. Densitometry technologies have evolved as our understanding of relevant disease processes has increased. In a complimentary fashion, our understanding of the disease processes has increased as the technologies have evolved. Although current clinical guidelines have focused our attention overwhelmingly on DXA studies of the spine and proximal femur, other technologies for quantifying the bone density and other skeletal sites to which they may be applied are worthy of attention.
Plain Radiography in the Assessment of Bone Density
The earliest attempts to quantify bone density utilized plain skeletal radiography. When viewed by the unaided eye, plain skeletal radiographs can only be used in an extremely limited fashion to quantify bone density. Demineralization becomes visually apparent only after 40% or more of the bone density has been lost [3]. If demineralization is suspected from a plain film, a great deal of demineralization is presumed to have occurred. A more precise statement cannot be made. Plain radiographs have been used for qualitative and quantitative skeletal morphometry. Plain radiographs were also used to assess bone density based on the optical densities of the skeleton when compared to simultaneously X-rayed standards of known density made from ivory or aluminum. With the advent of the photon absorptiometric techniques, most of these early methods as originally performed have fallen into disuse. Nevertheless, a brief review of these techniques should enhance the appreciation of the capabilities of modern testing and provide a background for understanding modern technologies.
Qualitative Morphometry
Qualitative morphometric techniques for the assessment of bone density have been in limited use for over 50 years. Grading systems for the spine and proximal femur were developed in an attempt to characterize the severity of bone loss. Interpretations based on such systems could be highly subjective and were best performed using a set of reference radiographs.
Qualitative Spinal Morphometry
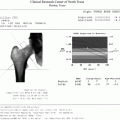
Grading systems for the spine relied on the appearance of the trabecular patterns within the vertebral body and the appearance and thickness of the cortical shell [4]. Vertebrae were graded from IV down to I as the vertical trabecular pattern became more pronounced with the loss of the horizontal trabeculae and the cortical shell became progressively thinned. The spine shown in Fig. 2-1 demonstrates a more pronounced vertical trabecular pattern. The cortical shell appears as though it was outlined in white around the more radiotranslucent vertebral body. These vertebrae would be classified as grade II.
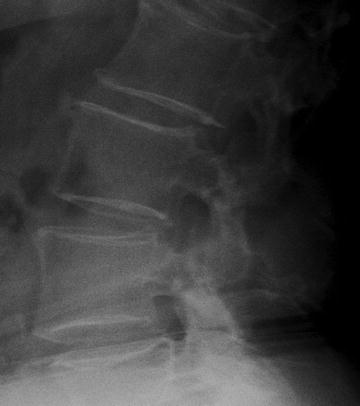
Fig. 2-1.
Qualitative spine morphometry. The vertebrae on this lateral lumbar spine X-ray demonstrate marked accentuation of the vertical trabecular pattern and thinning of the cortical shell. This is a grade II spine. This patient is a 76-year-old Caucasian woman who was known to have a compression fracture at T12 and a T-score at the femoral neck of −2.5.
The Singh Index
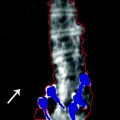
The Singh Index is a qualitative morphometric technique that was similarly based on trabecular patterns but based on those seen in the proximal femur [5]. Singh and others had noted that there was a predictable order in the disappearance of the five groups of trabeculae from the proximal femur in osteoporosis. Based on the order of disappearance, radiographs of the proximal femur could be graded 1 through 6, with lower values indicating a greater loss of the trabecular patterns normally seen in the proximal femur. Studies evaluating prevalent fractures demonstrated an association between Singh Index values of 3 or less and the presence of fractures of the hip, spine, or wrist. Figure 2-2 shows a proximal femur with a Singh Index of 2. Only the trabecular pattern known as the principle compressive group, which extends from the medial cortex of the shaft to the upper portion of the head of the femur, remains. This patient was known to have osteoporotic spine fractures as well as a contralateral proximal femur fracture. Later attempts to demonstrate an association between Singh Index values and proximal femur bone density measured by dual-photon absorptiometry were not successful [6].
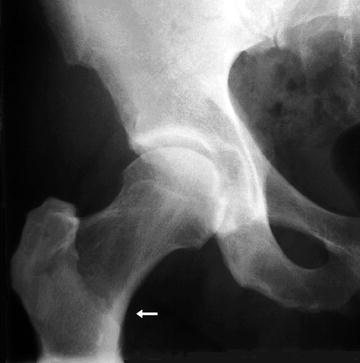
Fig. 2-2.
The Singh Index and calcar femorale thickness. A grade 2 Singh Index would be assessed based on having only remnants of the principle compressive and tensile trabecular groups visible. This is indicative of osteoporosis. The arrow points to the calcar femorale, which measured 4 mm in thickness. Values <5 mm are associated with hip fracture. This patient had experienced a contralateral hip fracture.
Quantitative Morphometric Techniques
Quantitative morphometric techniques again utilized plain X-rays of either the spine or proximal femur. In these techniques, however, some parameter was measured in order to produce a quantitative assessment of the severity of bone loss.
Calcar Femorale Thickness
A little known quantitative morphometric technique involved the measurement of the thickness of the calcar femorale. The calcar femorale is the band of cortical bone immediately above the lesser trochanter in the proximal femur. In normal subjects, this thickness is greater than 5 mm. In femoral fracture cases, it is generally less than 5 mm in thickness [7]. The arrow seen in Fig. 2-2 is pointing to the calcar femorale. This patient had previously suffered a femoral neck fracture. The thickness of the calcar femorale measured 4 mm.
Radiogrammetry
Radiogrammetry is the measurement of the dimensions of the bones using skeletal radiographs. Metacarpal radiogrammetry has been in use for almost 50 years. As originally practiced, the dimensions of the metacarpals were measured using a plain radiograph of the hand and fine calipers or a transparent ruler. The total width and medullary width of the metacarpals of the index, long, and ring fingers were measured at the midpoint of the metacarpal. The cortical width was calculated by subtracting the medullary width from the total width. Alternatively, the cortical width could be measured directly. A variety of different calculations were then made such as the metacarpal index (MI) and the hand score (HS). The MI is the cortical width divided by the total width. The HS, which is also known as the percent cortical thickness, is the metacarpal index expressed as a percentage. Measurements of the middle three metacarpals of both hands were also made and used to calculate the six metacarpal hand score (6HS). Other quantities derived from these measurements included the percent cortical area (%CA), the cortical area (CA), and the cortical area to surface area ratio (CA/SA). The main limitation in all of these measurements is that they were based on the false assumption that the point at which these measurements were made on the metacarpal was a perfect hollow cylinder. Nevertheless, using these measurements and knowledge of the gravimetric density of bone, the bone density could be calculated. The correlation1 between such measurements and the weight of ashed bone was good, ranging from 0.79 to 0.85 [8, 9]. The precision of metacarpal radiogrammetry was quite variable depending upon the measurement used.2 The measurement of total width is very reproducible. The measurement of medullary width or the direct measurement of cortical width is less reproducible because the delineation between the cortical bone and the medullary canal is not as distinct as the delineation between the cortical bone and soft tissue. Precision was variously reported as excellent to poor, but in expert hands, it was possible to achieve a precision of 1.9 % [10].
Although metacarpal radiogrammetry is an old technique and somewhat tedious to perform, it remains a viable means of assessing bone density in the metacarpals. Metacarpal radiogrammetry demonstrates a reasonably good correlation to bone density at other skeletal sites measured with photon absorptiometric techniques [11]. The technique is very safe as the biologically significant radiation dose from a hand X-ray is extremely low at only 1 mrem.
Radiogrammetry can also be performed at other sites such as the phalanx, distal radius, and femur [12–14]. Combined measurements of the cortical widths of the distal radius and the second metacarpal are highly correlated with bone density in the spine as measured by dual-photon absorptiometry [12].
Today, plain films of the hand and forearm can be digitized and radiogrammetry performed with computerized analysis of the digitized images. Using such a digital radiogrammetry (DXR) system, Bouxsein et al. [15] evaluated the utility of metacarpal radiogrammetry in predicting fracture risk and the correlation between metacarpal DXR-BMD and BMD measured by other techniques at other sites. The authors used a case-cohort approach to identify three groups of 200 women based on their having experienced a hip fracture, wrist fracture, or spine fracture during the first 5 years of the Study of Osteoporotic Fractures [16]. DXR-BMD of the metacarpals was strongly correlated with distal and proximal radial BMD measured by single-photon absorptiometry3 (r = 0.68 and 0.75, respectively). The correlation with femoral neck and lumbar spine BMD measured by dual-energy X-ray absorptiometry† was more modest (r = 0.50 and 0.44, respectively). Metacarpal DXR-BMD predicted spine and wrist fracture risk as well as single-photon absorptiometry BMD measurements of the distal or proximal radius or heel or dual-energy X-ray absorptiometry measurements of the PA lumbar spine or femoral neck. The increase in risk for wrist fracture increased 1.6-fold for each standard deviation decline in DXR-BMD and 1.9-fold for spine fracture. Although femoral neck BMD was the strongest predictor of hip fracture risk, metacarpal DXR-BMD predicted hip fracture risk as well as the other BMD measurements with an increase in risk of 1.8-fold for each standard deviation decline in BMD. DXR systems are available commercially as part of a PACS4 system.
The Radiologic Osteoporosis Score
The radiologic osteoporosis score combined aspects of both quantitative and qualitative morphometry [14]. Developed by Barnett and Nordin, this scoring system utilized radiogrammetry of the femoral shaft and metacarpal as well as an index of biconcavity of the lumbar vertebrae. In calculating what Barnett and Nordin called a peripheral score, the cortical thickness of the femoral shaft divided by the diameter of the shaft and expressed as a percentage was added to a similar measurement of the metacarpal. A score of 88 or less was considered to indicate peripheral osteoporosis. The biconcavity index was calculated by dividing the middle height of the third lumbar vertebra by its anterior height and expressing this value as a percentage. A biconcavity index of 80 or less indicated spinal osteoporosis. Combining both the peripheral score and biconcavity index resulted in the total radiologic osteoporosis score, which indicated osteoporosis if the value was 168 or less.
Radiographic Photodensitometry
Much of the development of the modern techniques of single- and dual-photon absorptiometry and dual-energy X-ray absorptiometry actually came from early work on the X-ray-based method of photodensitometry [17]. In photodensitometry, broad-beam X-ray exposures of radiographs were obtained, and the density of the skeletal image was quantified using a scanning photodensitometer. One such early device at Texas Woman’s University is shown in Fig. 2-3. The effects of variations in technique such as exposure settings, beam energy, and film development were partially compensated by the simultaneous exposure of a step wedge of known densities on the film. An aluminum wedge was most often used, but other materials such as ivory were also employed [13]. This technique could only be applied to areas of the skeleton in which the soft tissue coverage was less than 5 cm such as the hand, forearm, and heel. This restriction was necessary because of technical limitations from scattered radiation in thicker parts of the body and “beam hardening” or the preferential attenuation of the softer energies of the polychromatic X-ray beam as it passed through the body. Photodensitometry was also used in cadaver studies of the proximal femur [18]. Such studies noted the predictive power for hip fracture of the density of the region in the proximal femur known as Ward’s triangle5 30 years before studies using the modern technique of dual-energy X-ray absorptiometry in 1993 [19]. The accuracy of such measurements was fairly good with a %CV of 5 %. The correlation between metacarpal photodensitometry and ashed bone was also high at 0.88 [8]. This was slightly better correlation than seen with metacarpal radiogrammetry. The precision of photodensitometry was not as good however ranging from 5% to 15 % [20]. In this regard, the six metacarpal radiogrammetry hand score was superior [4]. Radiation dose to the hand was the same for metacarpal radiogrammetry and radiographic photodensitometry. In both cases, the biologically significant radiation dose was negligible.
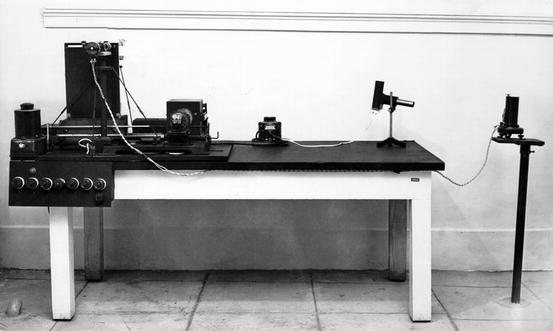
Fig. 2-3.
A radiographic photodensitometer at Texas Woman’s University from the early 1950s.
Radiographic photodensitometry was developed and used extensively by researchers Pauline Beery Mack and George Vose [21]. Many of the original studies of the effects of weightlessness on the skeleton in the Gemini and Apollo astronauts were performed by Pauline Beery Mack and her colleagues at Texas Woman’s University [22]. The photodensitometry hand film of one of the Gemini astronauts is shown in Fig. 2-4.
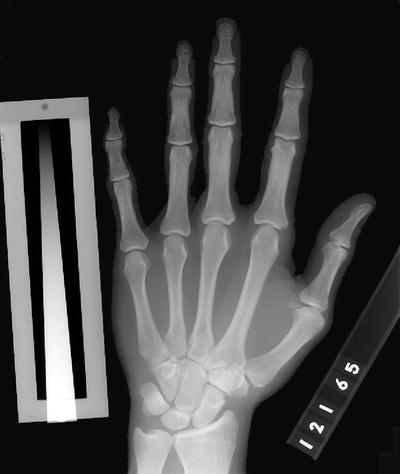
Fig. 2-4.
A radiographic photodensitometry hand film taken in 1965 of one of the Gemini astronauts. The Texas Woman’s University aluminum wedge is seen next to the little finger.
Radiographic Absorptiometry
Radiographic absorptiometry (RA) is the modern-day descendent of radiographic photodensitometry [23, 24]. The ability to digitize high-resolution radiographic images and to perform computerized analysis of such images largely eliminated the errors introduced by differences in radiographic exposure techniques and overlying soft tissue thickness. In an early version of RA, two X-rays of the left hand using non-screened film were taken at slightly different exposures. Standard X-ray equipment was used to perform the hand films. The initial recommended settings were 50 kVp at 300 mA for 1 s and 60 kVp at 300 mA for 1 s. The exact settings varied slightly with the equipment used and were adjusted so that the background optical density of each of the two hand films matched a quality control film. An aluminum alloy reference wedge was placed on the film prior to exposure, parallel to the middle phalanx of the index finger. After development, the films were sent to a central laboratory where they were digitized and analyzed by computer. The average bone mineral density in arbitrary RA units of the middle phalanxes of the index, long, and ring fingers was reported. Figure 2-5 illustrates the X-ray appearance of the hand and aluminum alloy reference wedge.
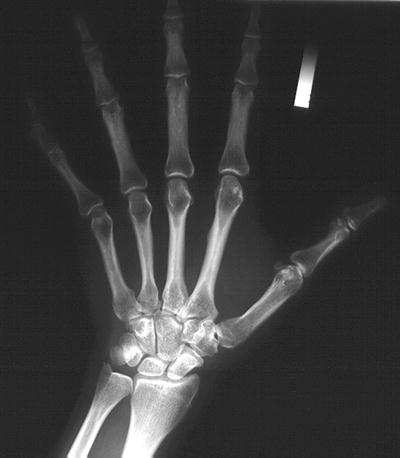
Fig. 2-5.
A radiographic absorptiometry hand film. The small aluminum wedge, originally known as the Fel’s wedge, is seen next to the index finger.
In cadaveric studies, the accuracy of RA for the assessment of bone mineral content of the middle phalanges was good at 4.8% [25]. The authors of this study noted that very thick of soft tissue that might be seen in very obese subjects could potentially result in an underestimation of RA values. The correlation between the RA values and the ashed weight in the phalanges was excellent, with r = 0.983. The short-term reproducibility of these measurements was also excellent at 0.6%.
The ability to predict bone density at other skeletal sites from hand radiographic absorptiometry is as good as that seen with other techniques such as single-photon absorptiometry, dual-photon absorptiometry, dual-energy X-ray absorptiometry, or quantitative computed tomography of the spine [23, 26]. This does not mean that RA hand values can be used to accurately predict bone density at other skeletal sites. Although the correlations between the different sites as measured by the various techniques are correctly said to be statistically significant, the correlations are too weak to allow clinically useful predictions of bone mass or density at one site from measurement at another.
The utility of modern-day radiographic absorptiometry in predicting hip fracture risk was suggested by an analysis of data acquired during the first National Health and Nutrition Examination Survey (NHANES I, 1971–1975). During this survey, 1,559 hand radiographs of Caucasian women were obtained with the older technique of photodensitometry using the Texas Woman’s University wedge [27]. During a median follow-up of 14 years that extended through 1987, 51 hip fractures occurred. Based on radiographic photodensitometry of the second phalanx of the small finger of the left hand, the risk for hip fracture per standard deviation decline in bone density increased 1.66-fold. These films were then reanalyzed using radiographic absorptiometry with some compensation for the differences in technique. This reanalysis yielded an increase in the risk for hip fracture per standard deviation decline in RA bone density of 1.81-fold.
Huang and colleagues [28] evaluated the utility of RA in the prediction of vertebral fractures. They followed 560 postmenopausal women, average age 73.7 years, for an average of 2.7 years in the Hawaii Osteoporosis Study. The risk for vertebral fracture in this study using RA was 3.41-fold for each standard deviation decline in bone density.
Photon Absorptiometry Techniques
In radiology, attenuation refers to a reduction in the number and energy of photons in an X-ray beam. Attenuation, then, is a reduction in an X-ray beam’s intensity. To a large extent, the attenuation of X-rays is determined by tissue density. The difference in tissue densities is responsible for creating the images seen on an X-ray. The more dense the tissue, the more electrons that it contains. The number of electrons in the tissue determines the ability of the tissue to either attenuate or transmit the photons in the X-ray beam. The differences in the pattern of transmitted or attenuated photons create the contrast necessary to discern images on the X-ray. If all the photons were attenuated (or none were transmitted), no image would be seen because the film would be totally white. If all of the photons were transmitted (or none were attenuated), no image would be seen because the film would be totally black. The difference in the attenuation of the X-ray photon energy by different tissues is responsible for the contrast on an X-ray, which enables the images to be seen. If the degree of attenuation could be quantified, it would be possible to quantitatively assess the tissue density as well. This is the premise behind the measurement of bone density with photon absorptiometric techniques. The earliest photon absorptiometric techniques employed radionuclides to generate photon energy. These radionuclide-based techniques have given way to X-ray-based techniques. The basic principles on which they operate, however, remain the same.
Single-Photon Absorptiometry
Writing in the journal Science in 1963, Cameron and Sorenson [29] described a new method for determining bone density in vivo by passing a monochromatic or single-energy photon beam through bone and soft tissue. The amount of mineral encountered by the beam could be quantified by subtracting the beam intensity after passage through the region of interest from the initial beam intensity. In the earliest single-photon absorptiometry (SPA) units, the results of multiple scan passes at a single location, usually the mid-radius, were averaged [30]. In later units, scan passes at equally spaced intervals along the bone were utilized such that the mass of mineral per unit of bone length could be calculated. A scintillation detector was used to quantify the photon energy after attenuation by the bone and soft tissue in the scan path. After the photon attenuation was quantified, a comparison to the photon attenuation seen with a calibration standard derived from dried defatted human ashed bone of known weight was made in order to determine the amount of bone mineral.
The photon beam and the detector were highly “collimated” or restricted in size and shape. The beam source and detector moved in tandem across the region of interest on the bone, coupled by a mechanical drive system. Iodine-125 (125I) at 27.3 keV or americium-241 at 59.6 keV was originally used to generate the single-energy photon beam, although most SPA units subsequently developed in the United States employed only 125I.
The physical calculations for SPA determinations of bone mineral were valid only when there was uniform thickness of the bone and soft tissue in the scan path. In order to artificially create this kind of uniform thickness, the limb to be studied had to be submerged in a water bath or surrounded by a tissue-equivalent material. As a practical matter, this limited SPA to measurements of the distal appendicular skeleton such as the radius and later, the calcaneus. Figure 2-6 is a photograph of an old SPA device, the Norland 2780, that was in use in the 1980s.
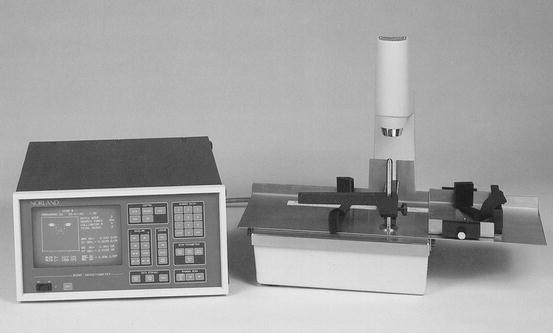
Fig. 2-6.
An early Norland model 2780 single-photon absorptiometer. This device utilized 125I to generate photon energy (Photo courtesy of CooperSurgical Norland, Trumbull, CT).
Single-photon absorptiometry was both accurate and precise6, although the parameters varied slightly with the site studied. For SPA measurements of the mid-radius, accuracy ranged from 3 to 5 % and precision from 1 to 2 % [29, 31–33]. Early measurements of the distal and ultra-distal radius with SPA did not demonstrate the same high degree of precision primarily due to the marked changes in the composition of the bone with very small changes in location within the distal and ultra-distal radius.7 With later instruments that employed computer-enhanced localization routines and rectilinear scanning, SPA measurements of the distal and ultra-distal radius approached a precision of 1 % [34]. Accuracy and precision of measurements at the calcaneus with SPA were reported to be less than 3 % [32]. The skin radiation dose for both the radius and calcaneus was 5–10 mrem [32, 33]. The biologically important radiation dose, the effective dose,8 was negligible. Results were reported as either bone mineral content (BMC) in g or as bone mineral content per unit length (BMD/l) in g/cm. The time required to perform such studies was approximately 10 min [35].
SPA is rarely performed today, having been supplanted first by single-energy X-ray absorptiometry (SXA) and now dual-energy X-ray absorptiometry. The demise of SPA was due to improvements in ease of use and precision seen with SXA and DXA. SPA was an accurate technology that could be used to predict fracture risk. The ability to predict the risk of appendicular fractures with SPA measurements of the radius was convincingly established [36–38]. SPA measurements of the radius were also good predictors of spine fracture risk and global9 fracture risk [36, 39, 40]. Indeed, the longest fracture trials published to date, demonstrating the ability of a single bone mass measurement to predict fracture, were performed using SPA measurements of the radius.
Dual-Photon Absorptiometry
The basic principle involved in dual-photon absorptiometry (DPA) for the measurement of bone density was the same as for single-photon absorptiometry: quantifying the degree of attenuation of a photon energy beam after passage through bone and soft tissue. In dual-photon systems, however, an isotope which emitted photon energy at two distinct photoelectric peaks or two isotopes, each emitting photon energy at distinct photoelectric peaks, was used. When the beam was passed through a region of the body containing both bone and soft tissue, attenuation of the photon beam occurred at both energy peaks. If one energy peak was preferentially attenuated by bone, however, the contributions of soft tissue to beam attenuation could be mathematically subtracted [41]. As in single-photon absorptiometry, the remaining contributions of beam attenuation from bone were quantified and then compared to standards created from ashed bone. The ability to separate bone from soft tissue in this manner finally allowed quantification of the bone density in those areas of the skeleton which were surrounded by large or irregular soft tissue masses, notably the spine and proximal femur. DPA was also used to determine total body bone density. The development of DPA and its application to the spine, proximal femur, and total body are attributed to a number of investigators: B.O. Roos, G.W. Reed, R.B. Mazess, C.R. Wilson, M. Madsen, W. Peppler, B.L. Riggs, W.L. Dunn, and H.W. Wahner [42–47].
The isotope most commonly employed in dual-photon absorptiometry in the United States was gadolinium-153 (153GD) which naturally emitted photon energy at two photoelectric peaks, 44 keV and 100 keV. At the photoelectric peak of 44 keV, bone preferentially attenuated the photon energy. The attenuated photon beams were detected by a NaI scintillation detector and quantified after passage through pulse-height analyzers set at 44 and 100 keV. The shielded holder for the 153Gd source, which was collimated and equipped with a shutter that was operated by a computer, moved in tandem with the NaI detector in a rectilinear scan path over the region of interest. A point-by-point calculation of bone density in the scan path was made. Figure 2-7 is an image of the spine created with an early DPA device.
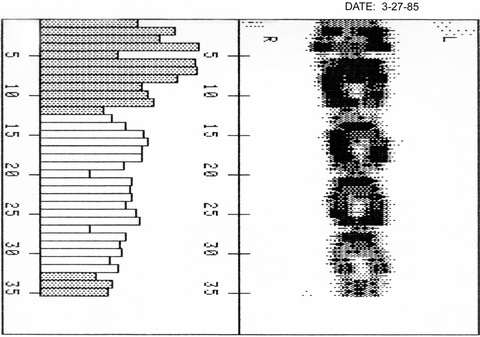
Fig. 2-7.
A dual-photon absorptiometry PA spine study obtained on a device as shown in Fig. 2-8. The spine image is upside down. The histogram on the left was used to place the intervertebral disc space markers. The shortest bar in the vicinity of the disc space was identified, and the marker was placed there.
DPA bone density studies of the lumbar spine were performed with the photon energy beam passing in a posterior to anterior direction. Because of the direction of the beam, the vertebral body and the posterior elements were included in the scan path. The transverse processes were eliminated. This resulted in a combined measurement of cortical and trabecular bone, or an integral measurement, that included the more trabecular vertebral body surrounded by its cortical shell and the highly cortical posterior elements. The results were reported as an areal density in g/cm2. The bone mineral density of the proximal femur was also an areal density that was acquired with the beam passing in a posterior to anterior direction. Figure 2-8 shows an early dual-photon absorptiometer with the patient positioned for a study of the lumbar spine.
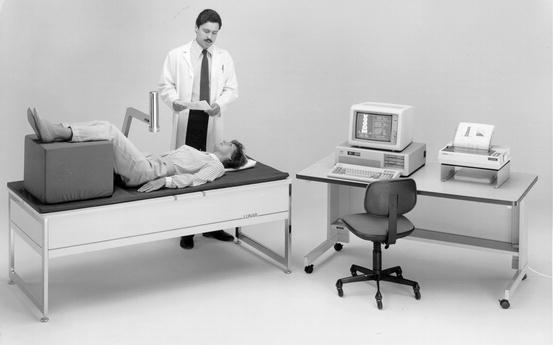
Fig. 2-8.
An early GE Lunar DP3 dual-photon absorptiometer. This device utilized 153Gd to generate photon energy (Photo courtesy of GE Healthcare, Madison, WI).
DPA studies of the spine required approximately 30 min to complete. Studies of the proximal femur took 30–45 min to perform. Total body bone density studies with DPA required 1 h. Skin radiation dose was low during spine or proximal femur studies at 15 mrem. Accuracy of DPA measurements of the spine ranged from 3% to 6 % and for the proximal femur, 3–4 % [48]. Precision for measurements of spine bone density was 2–4 % and around 4 % for the femoral neck.
Dual-photon absorptiometry was considered a major advance from single-photon absorptiometry because it allowed the quantification of bone density in the spine and proximal femur. DPA did have several limitations however. Machine maintenance was expensive. The 153Gd source had to be replaced yearly at a cost of $5,000.00 or more. It had also been noted that as the radioactive source decayed, values obtained with DPA increased by as much as 0.6 % per month [49]. With replacement of the source, values could fall by as much as 6.2 %. Although mathematical formulas were developed to compensate for the effect of source decay, it remained a cause for concern, potentially affecting both accuracy and precision. The precision of 2–4 % for DPA measurements of the spine and proximal femur limited its application in detecting changes in bone density. With a precision of 2 %, a change of at least 5.5 % from the baseline value had to be seen before one could be certain at the 95 % confidence level10 that any change had occurred at all [50]. With a precision of 4 %, this figure increased to 11.1 %. At a lower 80 % confidence level, the required changed for precision values of 2 % and 4 % were 3.6 % and 7.2 %, respectively. As a practical matter, this meant that DPA bone density studies would not show significant changes for up to 5 years. This was too long a period to wait to be clinically useful.
In DPA spine bone density studies in which the photon beam passed in a PA direction, the highly trabecular vertebral body could not be separated from its more cortical posterior elements. In addition, the cortical shell of the vertebral body could not be separated from its trabecular interior. Calcifications in the overlying soft tissue or abdominal aorta will attenuate such a beam, falsely elevating the bone density values. Arthritic changes in the posterior elements of the spine also affect the measurement [51]. These effects are discussed in greater detail in Chap. 3. PA dual-energy X-ray absorptiometry (DXA) studies of the spine are not immune to these effects either, but lateral DXA spine studies can be performed to overcome these limitations. Studies of the spine in the lateral projection were never available with DPA.
The ability to make site-specific predictions of fracture risk of the spine and proximal femur or global fracture risk predictions with dual-photon absorptiometry was established in prospective trials [19, 39]. Like SPA, DPA is rarely performed in the United States now because of the availability of DXA with its technological improvements.
Dual-Energy X-Ray Absorptiometry
Related posts:
Stay updated, free articles. Join our Telegram channel

Full access? Get Clinical Tree


