Chapter Outline
Toxin- and Drug-Induced Liver Disease
Radiation-Induced Liver Disease
Hemosiderosis and Hemochromatosis
Acquired Immunodeficiency Syndrome
General Radiologic Findings: Cirrhosis
Computed Tomography: Cirrhosis
Magnetic Resonance Imaging: Cirrhosis
Ultrasound: Portal Hypertension
Computed Tomography: Portal Hypertension
Magnetic Resonance Imaging: Portal Hypertension
The liver has quite accurately been called the custodian of the milieu intérieur , and as such, it is vulnerable to a variety of metabolic, vascular, toxic, infectious, and neoplastic insults. Diffuse liver disease can be diagnostically challenging because of nonspecific and overlapping clinical signs and symptoms or even asymptomatic disease. The ability to assess liver and spleen size and the presence of ascites is limited on physical examination. Liver function tests also lack diagnostic specificity, are affected by nonhepatic factors, and in general poorly correlate with physiologic hepatic function.
Imaging plays a critical role in the diagnosis and treatment of diffuse liver disease by detecting its presence, determining its distribution and severity, and identifying associated complications, such as cirrhosis, portal hypertension, and malignant disease. Dramatic advances, particularly in magnetic resonance imaging (MRI), have led to novel techniques to noninvasively diagnose and to characterize patterns of diffuse hepatic disease.
Hepatic Steatosis
The excessive accumulation of intracellular fat within hepatocytes, known as hepatic steatosis, occurs as a metabolic complication of a variety of hepatic exposures ( Table 89-1 ). Common causes include alcohol abuse and viral hepatitis (discussed separately), obesity and metabolic disorders, toxins, human immunodeficiency virus (HIV) infection, genetic lipodystrophies, and chemotherapy. This abnormal intracellular accumulation of fat within hepatocytes is now recognized as an important causative factor in liver injury. Although it is initially reversible, the process may also progress and can result in cirrhosis and increased risk for hepatocellular carcinoma (HCC).
| TOXIN OR MEDICATION RELATED |
|
| INFECTIOUS |
|
| METABOLIC |
|
| CHRONIC DISEASE |
|
| OTHER |
|
Nonalcoholic fatty liver disease (NAFLD) is a disease spectrum extending from simple steatosis to the more severe form with inflammation and fibrosis known as nonalcoholic steatohepatitis (NASH), the result of hepatic metabolic disturbance in the absence of alcohol abuse. Steatosis is the hallmark feature of NAFLD. NASH is established histopathologically by the presence of steatosis with evidence of hepatitis (centrilobular inflammation, hepatocyte ballooning degeneration, and spotty necrosis) and variable degrees of fibrosis (stages 0-3). Advanced or stage 4 fibrosis is indicative of cirrhosis. Severity of NASH is based on grading of inflammation and different stages of fibrosis. As a result of the current epidemic of obesity and metabolic syndrome, NAFLD is reported to occur in 20 to 80 million Americans and is the most common chronic liver disease in the United States. Recent research suggests that NAFLD is an independent risk factor for cardiovascular disease and contributes to the development of diabetes by impairment of insulin regulation within the liver.
The development of HCC is common in steatohepatitis; up to 7% of patients with NAFLD-related cirrhosis develop HCC within 10 years. The population of patients with chronic liver disease is growing, particularly from NAFLD, and it is anticipated to become an increasingly significant burden on the health care system as well as the number one cause of cirrhosis and HCC.
Clinical Findings
Hepatic steatosis from any cause is often clinically asymptomatic, which clinically increases the challenge for early intervention and treatment of the patient. In NAFLD, liver chemistry values are often normal. On physical examination, liver size may be normal or slightly enlarged and potentially difficult to evaluate in the obese patient. Alcohol-related steatosis can be manifested with vague right upper quadrant pain, with or without hepatomegaly, and is more often associated with liver function test abnormalities. One third of patients with alcoholism, however, have a fatty liver and are asymptomatic. Hepatic steatosis is also commonly seen in oncology patients as a result of chemotherapy administration, and its presence can impair imaging detection of concurrent metastatic disease. Hepatic steatosis with concomitant viral hepatitis can accelerate cellular damage and also decreases the effectiveness of antiviral therapies. Less commonly, hepatic steatosis can develop acutely secondary to pregnancy, carbon tetrachloride exposure, or binge drinking and can be manifested with jaundice, acute hepatic failure, or encephalopathy.
Hepatic steatosis is a potentially reversible disease treatable by removal of the insulting agent such as alcohol, other drug cessation, or treatment of infection. NAFLD can be treated by weight loss; however, it is often difficult for patients to achieve the recommended amount (5%-10% of body weight) without intervention, such as gastric bypass or banding surgery. Bariatric surgery patients have an incidental rate of 91% with NAFLD and 37% with steatohepatitis. Cellular damage from inflammation and the development of fibrosis and cirrhosis are irreversible, however, and the definitive treatment to prevent liver failure is transplantation. The early reversibility of this disease obviates the need for effective screening and treatment in a largely asymptomatic population.
Pathologic Findings
Fat is deposited in the liver as a result of a number of metabolic derangements. These include increased hepatic synthesis of fatty acids (alcohol), decreased hepatic oxidation or utilization of fatty acids (carbon tetrachloride, high-dose tetracycline), impaired release of hepatic lipoproteins, and excessive mobilization of fatty acids from adipose tissue (starvation, steroids, alcohol).
On pathologic examination, lipid accumulates within the cytoplasm of the hepatocyte, predominantly in the centrilobular zone ( Fig. 89-1 ). As lipid accumulation progresses, these small vacuoles coalesce, creating large, clear, macrovesicular spaces that peripherally displace the cell nucleus and virtually transform the hepatocyte into a lipocyte. Retention of water and protein adds to cellular enlargement. The liver may weigh 4 to 6 kg (normal, 1.5-2.5 kg) and at gross pathologic examination has a soft, yellow, greasy cut surface.

Segmental areas of fatty infiltration of the liver may develop as a result of a variety of traumatic and ischemic insults that reduce the amount of nutrients and insulin normally necessary to produce glycogen, culminating in a “metabolic infarct” of the involved region. Fatty replacement occurs where glycogen is depleted from the liver. This occurs primarily in regions where portal venous blood is reduced secondary to tumor, Budd-Chiari syndrome, or vascular thrombus. There is a difference in hormonal balance between the right and left lobes; pancreatic and splenic venous blood contains higher concentrations of insulin, and glycogen preferentially supplies the left portal vein. Accordingly, fat often infiltrates the right lobe of the liver before involvement of the left.
Focal fat sparing of the parenchyma in an otherwise fatty liver can also present as a diagnostic challenge. This occurs in characteristic locations, including the inferior medial portion of the liver, along the gallbladder fossa adjacent to the interlobar fissure, subcapsular portions of the liver, and adjacent to the porta hepatis. Direct vascular communications to the portal system from aberrant gastric venous flow or accessory cystic veins are found in certain areas of these spared regions, and it is postulated that these areas are perfused by systemic blood rather than by splanchnic venous blood from the portal veins. The posterior aspect of segment IV, a common area to be spared in diffuse fatty infiltration, has been shown to have aberrant direct gastric venous flow when focal fat sparing is present. Consequently, a “third blood supply” to these areas may help spare them the adverse effects of toxic agents entering through the portal circulation.
Radiologic Findings
Several major patterns of fat deposition can be visualized at cross-sectional imaging: diffuse deposition; focal deposition and focal sparing; multifocal deposition; perivascular deposition; and subcapsular deposition. Diffuse deposition is the most common pattern and is associated with homogeneous involvement and hepatomegaly. Focal deposition or diffuse deposition with focal sparing is a less common pattern that characteristically occurs adjacent to the falciform ligament, fissure for the ligamentum venosum, porta hepatis, and gallbladder fossa. This probably relates to variant arterial supply or venous drainage as described before. A true mass can be differentiated from focal regions of fat deposition and focal sparing because these occur in characteristic locations and typically have a geographic shape (but may appear nodular), poorly delineated margins, and, importantly, absence of mass effect on blood vessels. Multifocal deposition of fat may simulate true masses such as metastases. In these patients, differentiation can be made by measurement of the tissue density on computed tomography (CT) or specific sequences performed with MRI to evaluate for the presence of fat. With perivascular fat deposition, halos of fat surround the hepatic or portal veins. This fat is tramlike or tubular in appearance when the course is in the imaging plane and ringlike or round for vessels with a course perpendicular to the imaging plane. Subcapsular fat deposition can be seen in patients with renal failure and insulin-dependent diabetes in which insulin is added to the peritoneal dialysate. The dialysate exposes the subcapsular hepatocytes to a higher concentration of insulin than in the remainder of the liver and promotes the esterification of free fatty acids into triglycerides. This in turn results in subcapsular deposition of fat.
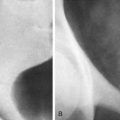
Plain Radiographs
Plain film radiography is relatively insensitive to the presence of fat in the liver unless marked degrees of infiltration are present. In these cases, the liver may appear hyperlucent and blend imperceptibly with the right retroperitoneal fat stripe. This produces a visible interface between the combined radiolucency of the fatty liver and flank stripe and the relatively radiodense abdominal musculature. A fat-fluid interface may be present if the patient has ascites. The outer wall of the gut may produce a viscus wall sign as the soft tissue density of the bowel wall is contrasted with the fatty liver. These changes, however, are most commonly seen in pediatric patients.
Ultrasound
Ultrasound is the most common modality used to evaluate the liver and is often the first imaging examination performed. It is low in cost, fast, and readily available. The positive predictive value for the presence of steatosis is low, however, at 62% to 77%. It is also operator dependent and difficult in obese patients, who represent a large population of those patients requiring assessment.
On sonographic evaluation, in diffuse hepatic steatosis, there is increased hepatic echogenicity roughly proportional to the histopathologic grade of steatosis ( Fig. 89-2 ). Sonographic changes also tend to correlate with the severity of biochemical and clinical dysfunction. The key ultrasound findings are accentuation of the brightness of parenchymal echoes and an increased number of echogenic foci resulting from the proliferation of fat-nonfat interfaces. These small echogenic foci increase attenuation of the ultrasound beam, resulting in poor visualization of deep hepatic structures and of the hepatic venous system.

Normally, four to six portal and hepatic veins are seen per longitudinal section of the right lobe. With fatty infiltration, fewer vessels are seen, and the smaller vascular structures may be nonvisible. This dropout of vessels is due to physical vascular compression by parenchymal swelling, decreased sound penetration, and loss of contrast between echogenic vascular walls and abnormally increased echogenicity of the surrounding parenchyma.
Four sonographic patterns of focal fatty infiltration have been described: (1) hyperechoic nodule, (2) multiple confluent hyperechoic lesions, (3) hypoechoic skip nodules, and (4) irregular hyperechoic and hypoechoic areas. On occasion, a focal area of liver parenchyma may be spared from fatty metamorphosis and appear as an ovoid, spherical, or sheetlike hypoechoic mass in an otherwise echogenic liver. The characteristic location, lack of mass effect on surrounding vessels, straight linear interface between normal and fatty parenchyma, and increased echogenicity of the liver compared with the cortex of the right kidney are useful diagnostic criteria. Hepatic hemangiomas, most often sonographically hyperechoic, in the presence of fat may appear hypoechoic compared with the adjacent liver and simulate a suspicious mass. Focal fatty infiltration in an otherwise normal-appearing liver may also produce a hyperechoic space-occupying mass. An angular or interdigitating geometric margin, when present, is characteristic of focal fat. Hepatic steatosis and fibrosis appear similar on ultrasound and often coexist. Differentiation of hepatic steatosis from a mass or other liver pathologic process may necessitate confirmation with CT or MRI, both of which have an increased sensitivity.
Technical considerations are important in the sonographic diagnosis of focal fat. The operator should take care not to erroneously change the time-gain-compensation curve, which can cause fatty parenchyma to have normal rather than increased echogenicity, whereas the spared, normal liver appears abnormally hypoechoic, simulating focal disease.
Computed Tomography
CT is an imaging technique that is also fast and widely available ( Fig. 89-3 ). It is a strong diagnostic tool for hepatic steatosis because of the excellent correlation between the hepatic parenchymal CT attenuation value and the amount of hepatic triglycerides found on liver biopsy specimens.

On non–contrast-enhanced scans, the normal liver appears homogeneous with an attenuation value ranging from 50 to 70 Hounsfield units (HU), which is 8 to 10 HU greater than the attenuation of the spleen. The diffusely steatotic liver has a reduced attenuation value of less than 40 HU and appears and measures less dense than the spleen. The accumulation of other substances, such as iron, copper, glycogen, drugs (including amiodarone and gold therapy), and even cirrhosis or edema, can increase the attenuation value of the liver and underestimate the presence of fat. CT is also insensitive for mild steatosis, which makes it a poor screening tool for early disease. In a study of potential liver donors, unenhanced CT was able to provide an accurate diagnosis of macrovesicular steatosis of 30% or greater. A meta-analysis from 2011 compared CT with histopathologic examination with an overall sensitivity of 46.1% to 77%.
The rapid intravenous administration of contrast medium causes transiently increased attenuation of the spleen in comparison with the liver secondary to differences in vascularity that vary with rate of contrast agent administration and scan acquisition time, particularly early (<100 seconds) after the infusion, which can mimic the presence of fat in a normal liver. Hepatic steatosis can be suggested on postcontrast images, with confirmation needed, preferably, on noncontrast or delayed phase postcontrast imaging. A recent publication on assessment of hepatic steatosis with contrast-enhanced CT found this technique 100% specific but only 60.5% sensitive.
In patients with NASH, the mean liver-to-spleen attenuation ratio is 0.66. The craniocaudal span of the liver has a mean of 21.4 cm; hepatomegaly is present in 92% of patients. The caudate lobe–to–left lobe ratio is usually normal (mean, 0.43), as is the preportal space (mean, 4.5 mm). Mildly prominent lymph nodes are present in the porta hepatis in 58.3% of patients. In mild but visible steatosis, the diagnosis can be made by comparing the relative CT attenuation of the liver and spleen, which appear and measure nearly equal. In more severe steatosis, the liver appears less dense than the spleen as well as the portal and hepatic veins, simulating the appearance of intravascular contrast material on a noncontrast examination.
Hepatic steatosis is manifested with a wide spectrum of CT appearances (see Fig. 89-3 ). Although diffuse parenchymal involvement is commonly seen, similar to the ultrasound appearance, fat may also be deposited in a focal, lobar, segmental, or nonpattern-like distribution. Fatty infiltration of the liver can obscure the detection of focal liver lesions, such as neoplasm or abscess, by lowering the background liver attenuation to a level similar to that of an otherwise hypoattenuating mass or fluid collection.
When fatty infiltration is lobar, segmental, or wedge shaped, differentiation from other focal hepatic disease is straightforward. In such cases, it usually has a straight-line margin, typically extending to the liver capsule without associated bulging of the contour to suggest an underlying mass. When the steatosis is focal or nodular, differentiation from metastatic disease can be challenging. Absolute attenuation values are affected by multiple parameters other than fat as previously described and alone are not diagnostically reliable. The previously mentioned differentiating features of focal fat, including characteristic location, lack of contour abnormality, and normal course of the hepatic vessels, are helpful and are only rarely simulated in metastatic tumor lesions. On occasion, discrete focal areas of fatty replacement have a central core of normal-appearing tissue, the reverse of the typical tumor necrosis pattern.
Because of its unique ability to characterize the presence of fat, MRI is often required. It is the most reliable diagnostic tool in differentiating any geographic pattern of hepatic steatosis or fatty sparing from metastatic disease.
Magnetic Resonance Imaging
MRI is the most sensitive modality for hepatic steatosis and has the highest correlation with histopathologic evaluation with a sensitivity of 76.1% to 95.3%. In addition, MRI can be used to quantify the amount of fat present. Severity of liver fat or steatosis is categorized by a 4-point grading system for histopathologic liver fat of 0 to 3, representing less than 5%, 6% to 33%, 34% to 66%, and more than 66%, respectively. The grading system incorporates the accepted normal value of liver fat, which is less than 5%. Limitations of MRI include increased cost, longer time to be performed, and less widespread availability. MRI also requires the patient’s cooperation, such as the ability to lie still and breath-hold.
Proton chemical shift imaging, also termed opposed-phase gradient-echo imaging, is a rapidly acquired, high-resolution, and commonly used sequence to confirm the presence of microscopic fat within multiple organs including the liver, kidney, and adrenal gland ( Fig. 89-4A, B ). This technique capitalizes on the difference in precession frequency between fat and water protons (3.7 ppm). Imaging is performed when their signals are additive (in-phase) and opposite or subtractive (opposed-phase). The presence of water alone in a solid organ will have the same signal intensity on both the in-phase and opposed-phase images. When fat and water are present, signal will be lost in the corresponding area on the opposed-phase image only because of cancellation of the contribution of signal from both water and fat in opposite phases or direction. At 1.5T, water and fat are in-phase every 4.6 ms (2.3 ms at 3T), with signal acquired at 4.6 ms, 9.2 ms, 13.4 ms, and so on (2.3 ms, 4.6 ms, 6.9 ms, and so on at 3T). Opposed-phase imaging occurs at 2.3 ms and every subsequent interval of 4.6 ms (6.9 ms, 11.5 ms, and so on). At 3T, opposed-phase imaging starts at 1.15 ms and is performed at every multiple of 2.3 ms (3.5 ms, 5.8 ms, and so on). A fat signal fraction can be calculated to quantify fat by the equation (IP − OP)/(2IP), where IP is the signal of the liver with in-phase divided by the signal of the spleen with in-phase and OP is the signal of the liver with opposed-phase divided by the signal of the spleen with opposed-phase. Inclusion of the spleen signal is used to normalize inherent imaging inhomogeneities. In normal liver, the lipid fraction is less than 10% and is without significant signal loss on opposed-phase imaging. Clinically significant hepatic steatosis is often greater than 20% and can be detected with proton chemical shift imaging qualitatively with a visualized signal loss or quantitatively by creation of a fat signal fraction map ( Fig. 89-4C-E ). Chemical shift imaging is limited in the detection of a low amount of fat (<10%); at higher levels, fat amount is detected but ambiguous, with 40% fat appearing the same as 60%, reducing accurate quantification at these levels. Additional methods to detect fat include fat suppression with either T1 or T2, which performs as well as or better than chemical shift imaging, and MR spectroscopy, which is sensitive to small amounts of fat and has high accuracy but with limitations of difficulty to perform and to analyze, limited availability, high cost, small spatial sample region, and sampling error with repeated examinations.

When signal loss is present with chemical shift imaging, the presence of fat is confirmatory. The technique is limited, however, secondary to several confounders, including magnet field inhomogeneities such as in the presence of iron, T2* decay, T1 bias (which refers to the different T1 weighting for fat versus water), and inclusion of only one spectral peak for fat when multiple smaller peaks exist and add to the fat signal. These confounders result in underestimation or lack of detection of fat. These effects are most dramatic at low fat levels, the range where screening for early disease would be important.
New MRI techniques continue to be developed to correct for these cofounders and also to better quantify the presence of fat to accurately grade steatosis. The benefit of these techniques is the potential to replace the “gold standard” for fat quantification, which currently is percutaneous biopsy, an invasive technique that samples only a small portion of the liver. These techniques may also serve as an early and accurate screening tool for asymptomatic but high-risk patients. These techniques result in accurate separation of signal created by mobile fat protons from all other mobile protons by calculating a proton density fat fraction. This fraction can be used to create a fat map of the entire liver that can be viewed with a color scale to demonstrate the variability of fat fractions throughout the parenchyma. These maps are also useful in monitoring changes over time with treatment. Early results have demonstrated high correlation of these methods with MR spectroscopy and improved ability to detect smaller amounts of fat (<5%) where the transition lies from normal to clinically significant steatosis (>5.56%).
Hepatitis
Hepatitis is a general term used to describe acute or chronic inflammation of the liver. In general medical parlance, hepatitis refers to viral hepatitis, but diffuse parenchymal inflammation can result from numerous hepatic infectious or inflammatory processes. It can also be seen after inhalation, ingestion, or parenteral administration of a number of agents, including alcohol, acetaminophen, carbon tetrachloride, halothane, isoniazid, chlorpromazine, oral contraceptives, α-methyldopa, methotrexate, azathioprine, and 6-mercaptopurine.
Viral Hepatitis
The liver is almost invariably involved in all hematogenous viral infections. These include mononucleosis; herpes simplex; cytomegalovirus infection in patients with acquired immunodeficiency syndrome (AIDS); yellow fever in tropical countries; and rubella, adenovirus infection, and enterovirus infection in children. The term viral hepatitis is usually reserved for hepatic infections caused by a small group of hepatotropic viruses known as hepatitis A, B, C, D, and E. Viral hepatitis is the etiology for 60% of cases of fulminant hepatic failure in the United States.
Clinical Findings
Viral hepatitis type A is an acute infection that occurs sporadically or epidemically and is transmitted by a fecal-oral route. Its incubation period is 15 to 50 days, and it most often has a benign self-limited course that does not cause chronic hepatitis and only rarely causes fulminant hepatitis.
Viral hepatitis type B is the most common of the hepatotropic viruses worldwide. It is also the most versatile in its presentation and can cause an asymptomatic carrier state, acute hepatitis, chronic hepatitis, cirrhosis, fulminant hepatitis with massive hepatocyte necrosis, or HCC. Viral hepatitis type B is manifested within 30 to 180 days of infection by parenterally administered infected blood or by vertical transmission from mother to child at birth. There are more than 240 million carriers of the virus worldwide and 1.4 million in the United States.
Hepatitis B viral infection is closely linked to the global distribution of HCC. In endemic areas, the annual incidence of HCC is 387 per 100,000 for men and 63 per 100,000 for women. In Europe and the United States, the carrier rate of hepatitis B virus is less than 1%. In Africa and Southeast Asia, the carrier rate is up to 10%. In high-incidence locales, HCC accounts for almost 40% of all cancers, as opposed to 2.3% in the West. Vertical transmission of the virus from infected mothers is the most common means of disease spread in these regions. Vaccination has been available since 1982 and is 95% effective.
Hepatitis C is caused by a parenterally transmitted RNA virus that affects 0.5% to 1% of normal volunteer blood donors in the United States. It now accounts for 90% of the cases of hepatitis as a result of contaminated blood transfusions before standard screening. A routine blood test for anti–hepatitis C antibody has been developed, greatly improving transfusion safety. The use of unclean needles is also a major mode of transmission. Approximately 150 million people are chronically infected with hepatitis C worldwide. The mean delay of the onset of symptoms and seropositivity is 22 weeks. Hepatitis C can cause either acute or chronic hepatitis; at least 50% of acute cases progress to chronic hepatitis. Chronic hepatitis C tends to be a silent, insidious disease; 10% to 20% of patients eventually develop cirrhosis.
The hepatitis D virus (HDV), a defective virus that requires the presence of the hepatitis B virus (HBV) to exist, can be acquired either as a coinfection (occurs simultaneously) with HBV or as a superinfection in persons with existing chronic HBV infection. HBV-HDV coinfection has a more severe acute disease and a higher risk (2%-20%) for development of acute liver failure compared with those infected with HBV alone. Chronic HBV carriers who acquire HDV superinfection usually develop chronic HDV infection. Progression to cirrhosis is believed to be more common with HBV-HDV chronic infections than with HBV infection alone.
Hepatitis E is a single-stranded RNA virus that is waterborne and transmitted by the fecal-oral route; it has an incubation period of 6 weeks. There is no chronic carrier state, and the disease is usually self-limited with a rate of fulminant hepatic failure of about 2%. The mortality and morbidity are significantly higher in pregnant women, with a morality rate of 20%.
Patients with viral hepatitis typically present subacutely with fatigue, anorexia, nausea and vomiting, malaise, mild pyrexia, myalgias, photophobia, pharyngitis, cough, and coryza. These constitutional symptoms precede the onset of jaundice by 1 to 2 weeks. When jaundice appears, the patient’s clinical condition improves, but the liver becomes enlarged and tender in 70% of cases. Splenomegaly is present in 20%. Complete clinical and biochemical recovery is usually seen in 3 to 4 months. If the inflammatory changes persist for more than 6 months, the patient is considered to have chronic hepatitis. The prognosis is often poor for these patients, who have jaundice and hepatosplenomegaly associated with an immune-mediated multisystem disease.
Pathologic Findings
On pathologic examination, the changes of acute viral hepatitis are virtually the same regardless of the offending agent. The entire liver is acutely inflamed, with centrilobular necrosis, hepatocyte necrosis, periportal infiltration by leukocytes and histiocytes, and reactive changes in the Kupffer cells and sinusoidal lining cells ( Fig. 89-5 ). Centrilobular cholestasis and bile duct proliferation also occur.

In chronic active hepatitis, the chronic periportal inflammatory changes extend into the liver parenchyma, producing necrosis and formation of intralobular fibrous septa. Chronic persistent hepatitis is a relatively benign condition characterized histologically by cellular infiltrates within the necrosis. In both disorders, definitive diagnosis is made by liver biopsy.
Radiologic Findings
The diagnosis of viral hepatitis can usually be made on the basis of history, serologic markers, and liver function test abnormalities. Imaging is usually done to ensure that there is no obstructive component of the patient’s hepatic dysfunction, to assess for cirrhosis and its complications, to exclude focal hepatic abnormalities such as HCC, and to assess hepatic vascular patency.
Ultrasound
Ultrasound findings in acute hepatitis, although often present, are nonspecific. The major role of ultrasound in hepatitis is to exclude biliary obstruction as the cause of liver disease and to diagnose other major complications, such as ascites or vascular occlusion. In chronic viral hepatitis, ultrasound is also used to screen for the development of cirrhosis or HCC. Although its sensitivity for both lags in comparison to CT and MRI, ultrasound is less expensive and more readily available.
In acute viral hepatitis, the liver and spleen are frequently enlarged. When parenchymal damage is severe, the parenchymal echogenicity is decreased and the portal venule walls are “brighter” than normal ( Fig. 89-6 ). The increased sonographic contrast between the parenchyma and the periportal collagenous tissue is probably due to increased hepatic water, hydropic swelling of hepatocytes, and inflammatory cell infiltration. The increased hepatic water (periportal edema) accentuates the acoustic mismatch between the hepatocytes and the portal tracts. Also, the decreased attenuation of the liver allows greater sound penetration to “highlight” these vessels, with increased echogenicity of the walls of peripheral portal veins. This has been termed the centrilobular pattern or “starry sky” appearance. It has been observed in up to 60% of patients with acute hepatitis and is best appreciated in thin patients. This pattern is nonspecific and has also been reported in toxic shock syndrome, cytomegalovirus infection, idiopathic neonatal jaundice, leukemia, diabetic ketoacidosis, and lymphoma. Hepatomegaly is another nonspecific finding in patients with acute hepatitis.

When it is severe, chronic hepatitis produces increased parenchymal echogenicity and loss of mural definition of the portal veins. This is attributed to “silhouetting out” of the portal vein walls by the echogenic fibrotic and inflammatory process surrounding the lobules that abut the portal triads. These findings are nonspecific and can also be seen in patients with fatty infiltration and cirrhosis. One useful differentiating feature is the presence of adenopathy in the hepatoduodenal ligament in chronic active hepatitis, which has been attributed to direct spread of the hepatic inflammatory process.
Acute viral hepatitis can also be associated with thickening of the gallbladder wall. In early hepatitis, the gallbladder is hypertonic, whereas in patients more than 9 days after disease onset, the gallbladder is hypokinetic with a large volume and demonstrates a diminished response to a fatty meal.
Computed Tomography
The primary role of CT in patients with hepatitis is to assess for the development of cirrhosis and associated sequelae, including HCC. CT findings in hepatitis are usually nonspecific. Hepatomegaly, gallbladder wall thickening, and hepatic periportal lucency ( Fig. 89-7 ) are the major CT findings in patients with acute viral hepatitis. This lucency is due to periportal fluid and lymphedema surrounding the portal veins and has also been reported in patients with AIDS, trauma, neoplasm, liver transplants, liver transplant rejection, and congestive heart failure. Early in the disease, the liver is enlarged and heterogeneous. Multiple regenerative nodules may be seen, and the liver becomes smaller and nodular with time as fibrosis increases and progresses to cirrhosis. CT has shown that hepatic necrosis is repaired by hypertrophy of regenerative nodules rather than by an increase in the number of nodules. These nodules give rise to the macronodular pattern of postnecrotic cirrhosis. Rarely, the nodules may be hypodense and simulate metastases on CT. Cirrhosis is discussed in detail later in this chapter.

In patients with chronic active hepatitis, lymphadenopathy is commonly found in the porta hepatis, gastrohepatic ligament, and retroperitoneum; it may be the only CT abnormality in a patient with severe hepatic dysfunction. CT can also follow the course of antiviral therapy by observing a reduction in lymph node size.
Magnetic Resonance Imaging
On MRI, acute hepatitis may show nonspecific findings such as heterogeneous signal intensity, most apparent on T2-weighted sequences, and a heterogeneous pattern of enhancement on arterial-dominant phase spoiled gradient-echo images. This abnormal enhancement becomes more marked and can persist into the venous and delayed phases as the severity of disease increases. High signal intensity periportal edema can be seen on T2-weighted images. In both acute and chronic hepatitis, adenopathy in the lesser omentum may be the only abnormality identified.
In chronic hepatitis, MRI can provide information on the degree of histologic activity of disease and help monitor the response to therapy. Homogeneous or heterogeneous increase in signal intensity has been described on T2-weighted images and reflects the presence of inflammation or necrosis of the liver parenchyma. Early patchy enhancement patterns in patients with chronic hepatitis have been shown to be associated with significant parenchymal inflammatory reaction. Absence of this early patchy enhancement correlates with low inflammatory reaction.
In patients with chronic fibrosis associated with cirrhosis, there is progressive enhancement on delayed images due to leakage of gadolinium contrast from the intravascular into the interstitial space.
Alcoholic Hepatitis
Clinical Findings
Alcoholic liver disease is manifested as three distinct but overlapping entities: fatty liver, alcoholic hepatitis, and cirrhosis. The first is reversible with abstinence; the last two are progressive and shorten life expectancy. Alcoholic hepatitis is part of the spectrum of alcoholic liver disease in which a major drinking binge produces acute liver cell necrosis. These changes are usually superimposed with steatosis or already developing cirrhosis from chronic alcohol use. In most cases, cessation of alcohol consumption and adequate nutrition may ameliorate the patient clinically and histologically. Repeated bouts of acute alcoholic hepatitis are associated with a 10% to 20% risk of death and a 35% risk for development of cirrhosis. Patients usually have fever and neutrophil leukocytosis and may present with malaise, anorexia, weight loss, upper abdominal pain, tender hepatomegaly, and jaundice.
Pathologic Findings
The specific mechanism of alcohol-induced hepatotoxicity is uncertain despite extensive research on both biochemical and immunologic models of hepatocyte damage. Theories range from peroxidation of cell membranes to modification of membrane permeability to sensitized T cells directed against hepatocytes. The histologic hallmark of alcoholic hepatitis consists of Mallory bodies, which are eosinophilic cytoplasmic inclusions that take the form of “candle droppings” in ballooned, degenerating hepatocytes. In most cases, alcoholic hepatitis is accompanied by pericellular and perivenular fibrosis, again suggesting that this is a precursor to cirrhosis.
Radiologic Findings
In patients with alcoholic hepatitis, imaging is done to exclude obstructive biliary disease and neoplasm and to evaluate parenchymal damage noninvasively.
Ultrasound
In acute alcoholic hepatitis, the liver is hyperechoic secondary to fatty infiltration. The liver may be enlarged early in the disease process, but it becomes atrophic as cirrhosis ensues. Because cirrhosis and fatty infiltration appear similar sonographically, both with heterogeneous echotexture, increased echogenicity, and sound attenuation, CT and MRI are more sensitive in their differentiation.
Computed Tomography
CT may show fatty infiltration in a normal-sized, enlarged, or atrophic liver, depending on the extent of prior liver injury. As hepatitis progresses to cirrhosis, alcoholic cirrhosis characteristically demonstrates a micronodular pattern as well as enlargement of the caudate lobe and of the right posterior hepatic lobe notch of greater proportion than in other causes of hepatitis. HCC develops at a 5-year cumulative rate of 8%. Biliary stasis and development of gallstones as well as periportal lymphadenopathy are common in alcoholic hepatitis.
Magnetic Resonance Imaging
Similar to CT, MRI depicts hepatic size and morphology and can be useful in depicting hepatic fibrosis, steatosis, and cirrhosis. MRI is also the most sensitive modality for detection of HCC. Phosphorus 31 MR spectroscopy has shown that livers of patients with alcoholic hepatitis and cirrhosis can be differentiated from normal liver and from each other on the basis of intracellular pH and absolute molar concentration of adenosine triphosphate. Hepatocytes are more alkaline than normal in alcoholic hepatitis and more acidic than normal in cirrhosis.
Toxin- and Drug-Induced Liver Disease
Although drug-induced liver disease represents a small proportion of all adverse drug effects, it accounts for 2% to 5% of hospital admissions for jaundice in the United States and up to 43% of admissions for “acute hepatitis.”
Anesthetics (halothane, enflurane), anticonvulsants (phenytoin), anti-inflammatory agents (gold, clometacin, sulindac), analgesics (acetaminophen), hormonal derivatives (danazol), antidepressant or antianxiety drugs (amitriptyline, amineptine), antimicrobials (isoniazid, amoxicillin, sulfamethoxazole-trimethoprim), antiulcer drugs (cimetidine, ranitidine), hypolipidemic agents (nicotinic acid, gemfibrozil), drugs for inflammatory bowel disease (sulfasalazine), and cardiovascular drugs (quinidine, amiodarone) have all been associated with parenchymal liver disease. Liver damage may be severe, exemplified by 20% to 50% of cases of fulminant hepatic failure being attributed to drugs such as halothane, acetaminophen, α-methyldopa, and phenytoin.
Certain drugs and other chemical agents are capable of producing a wide variety of clinical consequences ranging from very mild liver disease to hepatic failure. The spectrum of hepatotoxicity varies from acute, dose-related, predictable, hepatocellular necrosis to chronic inflammatory disorders ranging from mild chronic persistent hepatitis to severe chronic active hepatitis. In addition, vascular disorders, such as peliosis hepatis and the Budd-Chiari syndrome, and neoplastic lesions, such as angiosarcomas and benign hepatic adenomas, are associated with certain naturally occurring toxins such as “bush teas” and aflatoxins in peanuts, oral contraceptives and anabolic steroids, industrial toxins such as vinyl chloride (Thorotrast), and organic arsenic found in pesticides.
Chemotherapy Toxicity
The liver plays a key role in the metabolism of most medications that are either parenterally administered or gastrointestinally absorbed into the portal venous system and therefore is vulnerable to possible injury as a result of exposure. Hepatic deterioration resulting from chemical toxicity can be a diagnostic dilemma in oncology patients with known liver metastases. It is often clinically difficult to differentiate chemotherapy-induced parenchymal injury from other processes, including tumor progression, tumor necrosis, portal and hepatic venous thrombosis, hepatic ischemia and infarction, transfusion reactions, viral hepatitis, and segmental biliary obstruction by tumor. Radiology plays a key role in elucidating the cause of hepatic dysfunction in these patients.
Clinical or subclinical hepatotoxicity is common during systemic chemotherapy. A large series of patients with breast cancer demonstrated that 77% of those receiving systemic adjuvant chemotherapy and 82% of those being treated for metastatic breast cancer, all with normal pretreatment liver function test results, developed abnormal hepatic laboratory values during and after therapy. The mechanism of chemotherapy agents often involves prevention or retardation of cell division, which can also damage liver cells and diminish immune response. Methotrexate is often associated with steatosis, fibrosis of the portal triads, and eventually cirrhosis. Corticosteroids and l -asparaginase may produce steatosis. Dacarbazine and 6-thioguanine can cause thrombosis of intrahepatic portal veins, producing a Budd-Chiari–like appearance. Azathioprine and 6-mercaptopurine therapy may result in intrahepatic cholestasis and variable degrees of parenchymal cell necrosis. Intra-arterial infusion of floxuridine may cause chemical hepatitis and biliary strictures simulating sclerosing cholangitis. Mithramycin is perhaps the most hepatotoxic drug used in chemotherapy and is associated with acute parenchymal necrosis. Bevacizumab (Avastin) has been associated with hepatic veno-occlusive disease.
On cross-sectional images, the findings are fairly nonspecific and identical to those seen in other liver injuries: hepatomegaly, cirrhosis, and fatty infiltration. Cross-sectional imaging, however, is vital in excluding biliary obstruction or worsening liver metastases as the cause of the patient’s hepatic dysfunction. MRI and MR spectroscopy may be helpful in evaluating parenchymal injury. In vitro and laboratory MR experiments have shown that carbon tetrachloride produces water and sodium retention, which can be detected by sodium 23 and proton imaging. Cellular damage is most prominent in the periportal regions, which may be seen as a high signal intensity on T2-weighted images and high sodium signal intensity on spectroscopy.
Amiodarone Toxicity
Hepatotoxicity caused by amiodarone is well documented and is usually manifested by mild asymptomatic elevation of serum transaminase levels. When more severe injury occurs, it can simulate alcoholic liver disease with steatosis, Mallory bodies, and cirrhosis. The length of treatment with amiodarone before recognition of hepatic damage can range from several weeks to several years.
The sonographic findings in this disorder are nonspecific and related to steatosis or cirrhosis. The CT appearance ( Fig. 89-8 ), however, is distinctive. When this drug or its metabolites, which contain iodine, accumulate in sufficient quantities in the liver, increased parenchymal attenuation simulating hemochromatosis can be identified.

Radiation-Induced Liver Disease
Clinical Findings
Although the liver was once believed to be relatively radioresistant, hepatic morphologic and functional alterations have been observed after radiation therapy since the 1960s and are now established as a complication.
The liver is usually not the intended target for radiation treatment; its exposure occurs when it is unavoidably included in the treatment portal for primary malignant neoplasms of the breast, esophagus, stomach, pancreas, and lymphoma. Patients who receive greater than 30 Gy of total liver radiation are at risk of developing radiation-induced hepatitis. Nearly 75% of patients receiving whole liver irradiation have liver function test abnormalities. The classic signs and symptoms of acute hepatic radiation injury are hepatomegaly and ascites. Such effects are not observed when the area of irradiated hepatic tissue is small. High doses of radiation to the liver during childhood can result in hepatic atrophy. In children, restricted development can occur in other structures included in the radiation field, such as the kidney or vertebral bodies.
Radiation damage can also occur from local effects of targeted radiation therapy to the liver with yttrium 90. These microspheres are delivered angiographically to treat either a primary malignant neoplasm or metastatic disease to the liver and inflict a combination of local intense radiation and embolic devascularization. Although local radiation effects can occur, a major advantage of targeted radiation is that radiation-induced diffuse liver disease with hepatomegaly and ascites is extremely rare.
Pathologic Findings
Radiation hepatitis is characterized by massive panlobular congestion, hyperemia, hemorrhage, and mild proliferative change in the sublobular central veins. Most of the acute findings are sequelae of blood flow stasis secondary to injury of these veins. Complete clinical recovery is typically seen within 60 days, but there may be irreversible hepatocyte loss, fat deposition, fibrosis, or obliteration of the central veins.
Radiologic Findings
With ultrasonography, geographic areas of radiation injury are hypoechoic relative to the remainder of the liver. This is likely the result of localized hepatic congestion or edema. These changes are more easily detected sonographically in patients with a background of hepatic steatosis resulting from chemotherapy or other causes, which accentuates the hypoechoic areas of radiation injury.
CT performed within several months of the radiation therapy shows a sharply defined band of low attenuation corresponding to the treatment port ( Fig. 89-9 ). This is due to edema or fatty infiltration of the involved area. If hepatic congestion is severe, it may appear heterogeneous and possibly simulate other processes, such as malignant neoplasms. In patients with a background of diffuse hepatic steatosis, the irradiated hepatic area may appear as a region of relatively increased attenuation. This may be due to loss of fat accumulation in the irradiated hepatocytes or regional edema, with the water content demonstrating higher attenuation in comparison with the steatotic parenchyma. During a period of weeks, the initially sharp borders of the irradiated zone become more irregular and indistinct as the peripheral areas of parenchyma begin to regenerate. Eventually, the irradiated area may become atrophic, demonstrated by volume loss. Radiation effects from yttrium 90 therapy can be manifested with hyperenhancement or hypoenhancement of a portion of the liver and chronically result in atrophy, similar to external beam radiation. The difference is that the distribution of the changes occurs in a hepatic arterial territory distribution rather than along a sharply marginated line. Extensive fibrosis from any radiation source can also potentially cause portal hypertension. Biliary strictures and radiation-induced cholecystitis can rarely occur.

Radiation hepatitis on MRI is manifested as geographic areas of low signal intensity on T1-weighted images and high signal intensity on T2-weighted images secondary to increased water content as determined by proton spectroscopic imaging. Similar to CT, a distinctly sharp margin between the normal and abnormal liver parenchyma and appropriate clinical history are useful in making the specific diagnosis of postradiation changes.
Hemosiderosis and Hemochromatosis
The body normally contains 2 to 6 g of iron, 80% of which is functional iron in the form of hemoglobin, myoglobin, and iron-containing enzymes. The other 20% is in the storage form as either hemosiderin or ferritin and is normally stored within the reticuloendothelial system, which includes Kupffer cells within the liver and macrophages within the spleen and bone marrow. When it is present in excess amounts, iron is deposited into additional organs, where it can potentially cause dysfunction. Increased iron deposition without parenchymal organ damage is called hemosiderosis and is usually seen with body iron stores between 10 and 20 g.
Hemochromatosis is an iron overload disorder that results in structural and functional impairment of the involved organs. In these cases, body iron accumulation may reach 50 to 60 g. Primary hemochromatosis is an inherited disorder characterized by abnormally increased iron absorption by the mucosa of the duodenum and jejunum that leads to excessive delivery of iron into the portal venous system. Iron accumulates within the liver; once it is saturated, the iron spills into the systemic circulation, where it binds to transferrin. Iron is then deposited preferentially into organs with a high transferrin receptor density, including the pancreas, heart, thyroid, gonads, pituitary gland, and skin, and generally spares the reticuloendothelial system. Secondary hemochromatosis develops in three groups of patients: those with high iron intake (e.g., prolonged consumption of medicinal iron, iron-laden wine, kaffir beer, multiple blood transfusions); anemic patients with ineffective erythropoiesis and multiple blood transfusions (e.g., thalassemia major, sideroblastic anemia); and patients with liver disease in alcoholic cirrhosis and after portacaval shunts. Iron liberated from red blood cells as a result of multiple transfusions or hemolytic anemias is taken up primarily by phagocytes within the liver, spleen, bone marrow, and lymph nodes, and organ function is generally preserved (hemosiderosis). Unlike in primary hemochromatosis, reticuloendothelial cell iron overload resulting from transfusions and rhabdomyolysis is usually of little clinical consequence; however, if it is prolonged or severe, such as in thalassemia or sickle cell disease, iron overload can cause a similar pattern of organ dysfunction and is then referred to as secondary hemochromatosis.
Clinical Findings
The classic triad of hemochromatosis consists of micronodular pigment cirrhosis, diabetes mellitus, and hyperpigmentation. Patients with primary hemochromatosis usually present in the fourth or fifth decade of life because it takes many years to accumulate sufficient iron (20-40 g) to result in symptoms. There is a 10 : 1 male predominance in fully developed hemochromatosis. Women are protected from this disorder by the iron loss that occurs during normal menstruation, pregnancy, and lactation.
The liver is the first organ damaged in hemochromatosis, and hepatomegaly is present in 95% of symptomatic cases. Splenomegaly is present in nearly 50% of cases. Arthropathy of the small joints of the hands develops in 25% to 50% of cases and may antedate other symptoms. Cardiac involvement is the presenting complaint in about 15% of cases and is most commonly manifested as congestive heart failure in young adults. Loss of libido, loss of body hair, and testicular atrophy resulting from failure of gonadotropin production are also common. Increased melanin deposition in the basal layers of the epidermis leads to hyperpigmentation, resulting in so-called bronze diabetes in these patients.
The life expectancy of untreated patients with idiopathic hemochromatosis after the disease becomes clinically manifested is 4.4 years. The most common causes of death in these patients are cardiac failure (30%), hepatic coma (15%), hematemesis (14%), HCC (14%), and pneumonia (12%). Removal of iron by repeated phlebotomy and use of iron chelators increases the 5-year survival from 33% to 89%. The liver and spleen decrease in size, liver function test results return to normal, pigmentation decreases, glucose tolerance normalizes, and cardiac function improves with successful therapy. Once cirrhosis occurs, liver injury is irreversible, and about one third of patients develop HCC as a late sequela despite adequate therapy. The risk for development of HCC is increased more than 200-fold in patients with hereditary hemochromatosis. It is therefore important to diagnose this disorder early, in the pre-cirrhotic stage. Early diagnosis, however, is often difficult because there may be considerable hepatic iron accumulation before the patient becomes symptomatic. CT and MRI may fortuitously detect iron overload, and these modalities are useful in confirming the diagnosis in patients with equivocal laboratory data. Classically, the serum iron level is greater than 250 mg/dL (normal, 50-150 mg/dL), serum ferritin value is above 500 ng/dL (normal, below 150 ng/dL), and transferrin saturation approaches 100% (normal, 25%-30%) in patients with hemochromatosis. Transferrin saturation is the earliest and most sensitive indicator of increased iron stores. Virtually all patients older than 20 years have levels greater than 50%. Serum ferritin levels, however, are nonspecific and influenced by the presence of inflammatory states, neoplastic disorders, and other hepatocellular diseases. Imaging or biopsy helps clarify the results of these sensitive but somewhat nonspecific tests.
Pathologic Findings
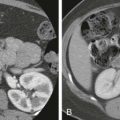
The principal features of classic primary hemochromatosis are excessive intracellular ferritin and hemosiderin aggregates as the result of excessive intestinal absorption of iron. Iron first accumulates in periportal hepatocytes and then in the lobular hepatocytes, Kupffer cells, and biliary epithelium. When the liver becomes overwhelmed, iron enters the systemic circulation bound to transferrin and subsequently is deposited into organs with high transferrin-binding receptors including the pancreas, heart, joints, endocrine glands, and skin, in decreasing order of severity ( Figs. 89-10 and 89-11 ). Free iron within cells causes formation of free radicals and results in cell damage leading to inflammation, cell death, and fibrosis. Because the liver contains up to one third of the total body store of iron, it is the organ most profoundly damaged in hemochromatosis. At gross pathologic examination, early in the disease, the liver is slightly larger than normal, dense, and chocolate brown due to ferritin with focal golden yellow granules of hemosiderin. Progressive deposition leads to slowly evolving liver damage and development of fibrous septa similar to those in alcoholic cirrhosis, ultimately producing micronodular cirrhosis. Late in disease, the liver size is only slightly diminished, and fat is usually absent. Liver biopsy can be used to provide an objective measurement of hepatic iron concentration (normal, 7 to 100 pg/100 mg). With primary hemochromatosis, the pancreas is intensely pigmented and demonstrates diffuse interstitial fibrosis resulting in a deficiency of exocrine and, to a greater extent, endocrine function. Hemosiderin is found in both acinar and islet cells, and some correlation is reported between the degree of iron deposition in pancreatic islets and the severity of endocrine dysfunction.


Radiologic Findings
Plain Radiographs
Rarely, diffuse, homogeneously increased density of the liver may be seen on plain abdominal radiographs in patients with hemochromatosis. Skeletal abnormalities include chondrocalcinosis and degenerative arthritis in the second and third metacarpal heads. Chondrocalcinosis occurs in two thirds of patients and is associated with cartilage narrowing.
Ultrasound
The sonographic appearance of hemochromatosis is nonspecific and related to fibrosis and cirrhosis. Parenchymal iron deposits are too small to be reflective, so ultrasound has no role in the early diagnosis of hepatic iron overload.
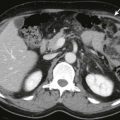
Computed Tomography
CT has had a significant impact on the noninvasive diagnosis of excess hepatic iron deposition, although it has a limited sensitivity (63%) and high specificity (96%). The normal density of the liver is between 45 and 65 HU on noncontrast scans obtained at 120 kVp. On CT, in patients with hemochromatosis, the liver demonstrates homogeneously increased density with an attenuation of greater than 72 HU ( Fig. 89-12 ). The increased attenuation highlights the lower attenuation hepatic and portal veins on unenhanced CT. As discussed elsewhere in this chapter, a similar, diffuse pattern of increased attenuation can be seen in patients treated with amiodarone and in patients with glycogen storage disease that can be indistinguishable from iron overload with CT. Other causes of high parenchymal attenuation that are usually inhomogeneous or focal include calcification resulting from shock liver, exposure to Thorotrast, prior intravasation of enteric barium, gold therapy administration for treatment of rheumatoid arthritis, and, rarely, Wilson’s disease and chronic arsenic poisoning. Clinical history and the lack of homogeneity in these entities are useful in differentiating these from iron accumulation. High density may also been seen on noncontrast CT in siderotic nodules of cirrhosis.

Measurement of the liver attenuation with CT is confounded by the presence of other diffuse liver processes, particularly hepatic steatosis. The fat decreases the attenuation value, which masks the increase in density seen from iron accumulation. The use of dual-energy CT has been proposed as a method with accuracy similar to that of MRI for the detection of iron in the setting of hepatic steatosis.
For accurate assessment for malignant disease in patients with iron accumulation, it is particularly important to obtain a noncontrast sequence. The high attenuation of the background liver parenchyma can decrease the conspicuity of contrast-enhancing masses, and the noncontrast images may best demonstrate the attenuation difference between a hypoattenuating mass and high-attenuation background parenchyma. Nonspecific changes of cirrhosis and portal hypertension with end-stage hemochromatosis can also be readily depicted with CT.
Magnetic Resonance Imaging
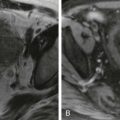
MRI is the most sensitive and specific imaging test for the demonstration of hepatic iron overload and for follow-up of patients undergoing treatment ( Figs. 89-13 and 89-14 ). In primary hemochromatosis, MRI shows dramatic reduction in the signal intensity of the liver (90%). This signal loss is due to the large paramagnetic susceptibility of ferritin and hemosiderin-iron-oxyhydroxide crystals, which contain ferric ions (Fe 3+ ), that profoundly shortens both the T1 and T2 relaxation times of the adjacent protons within the liver. This paramagnetic effect is more conspicuous on T2-weighted images and is most profound on T2*-weighted images, both clinically used to assess for iron. When iron concentrations within the liver are elevated, the T2-shortening effect predominates, accounting for the diminished hepatic signal intensity. Iron overload can sometimes be recognized in the heart and pancreas by diminished signal intensity, as seen in the liver. In reticuloendothelial overload, decreased signal intensity is seen on T2 within the spleen and bone marrow. In hemolytic anemias, the renal cortex also occasionally has decreased T2-weighted signal intensity. The paramagnetic effect increases as the echo time increases. On T1 in-phase and opposed-phase gradient-echo sequences, signal loss is greater on the T1 in-phase imaging because of its longer echo time in comparison with the opposed-phase imaging. This is opposite to the pattern of signal loss seen in the presence of microscopic fat, when signal loss occurs on the opposed-phase sequence. Focal iron deposition may also be demonstrated by MRI, such as in siderotic nodules seen in cirrhosis.


The normal hepatic parenchyma has a slightly increased T2- and T2*-weighted MR signal intensity compared with that of the kidney and paraspinous musculature, which can be used for comparison both qualitatively and quantitatively. MRI can be helpful to distinguish the parenchymal overload that occurs in primary hemochromatosis from reticuloendothelial cell iron overload (see Figs. 89-13 and 89-14 ). Whereas abnormally decreased T2 signal intensity is seen in both, in primary hemochromatosis, decreased signal intensity is observed within the pancreas and heart; in reticuloendothelial cell iron overload, decreased signal intensity of the spleen, bone marrow, and occasionally lymph nodes is observed with normal signal intensity of the other organs.
MRI can also be used to diagnose and to monitor treatment of patients with parenchymal iron overload. Quantitative assessment can be performed with two techniques, signal intensity ratio and relaxometry. The signal intensity ratio method uses T2- and T2*-weighted imaging at multiple different echo times or flip angles and measures the signal intensity of the liver and of a reference tissue that will not accumulate iron, usually the paraspinous muscle. The mean signal intensity of the liver is divided by the mean signal intensity of the reference tissue. For estimated concentration of more than 85 µmol/g, the positive predictive value for hemochromatosis is 100%; for less than 40 µmol/g, the negative predictive value for hemochromatosis is 100%. Complete signal loss at concentrations above 300 µmol/g precludes accurate measurements with iron overload above these levels. Other limitations of this technique include the need for breath holding and inhomogeneity of signal intensity resulting from the presence of fat or minor variations in the location of selected regions of interest between sequences. In the relaxometry method, the signal intensity of the liver is measured as a function of increasing echo time, which is used to calculate a signal decay constant. Iron concentration is inversely proportional to these values. Technical factors include calibration for the field strength and choosing a clinical range of echo time values. The choice of parameters used for measurement and the pulse sequence design also affect the calculated result. For both methods, normal variability within tissues, concurrent processes such as steatosis and fibrosis, choice of voxel size and location, technical factors related to MRI hardware and technique, and mathematical models used for data calculation all potentially limit the accuracy of iron quantification.
Glycogen Storage Disease
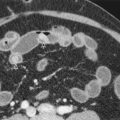
Clinical and Pathologic Findings
The liver has a major role in the synthesis and storage of glycogen as well as its ultimate catabolism into glucose. Among inherited disorders of glycogen metabolism, types Ia, Ib, II, III, IV, VI, and IX affect the liver and are manifested with hepatomegaly. Type Ia (von Gierke’s disease) is the most common subtype to affect the liver. It is due to a deficiency of glucose-6-phosphatase in the liver and kidneys, which results in excessive glycogen deposition in the hepatocytes and proximal renal tubules. On pathologic examination, intracytoplasmic accumulations of glycogen and small amounts of lipid are found. Patients clinically demonstrate failure to thrive, hypoglycemia, hyperlipidemia, hyperuricemia, stunted growth, hepatomegaly, and nephromegaly. Hepatic adenomas are much more common than in the normal population, and the presence of more than 10 hepatic adenomas, known as adenomatosis, is seen in up to 60% of patients with type Ia glycogen storage disease. Adenomas are also seen in glycogen storage disease types Ib and III. Increase in the size and number of adenomas increases the risk for associated hemorrhage. Much less commonly, HCCs can occur from malignant degeneration of an adenoma. Both processes are thought to result from hepatic exposure to chronic hormonal stimulation resulting from the chronic hypoglycemia. Types III and IV glycogen storage disease can progress to cirrhosis. Imaging surveillance of these patients is useful to evaluate for complications of the disease, including hemorrhage and malignant transformation.
Radiologic Findings
Ultrasound
On sonographic evaluation, the liver is enlarged with increased echogenicity and beam attenuation, presumably from fatty infiltration and possibly contributed to by the excess glycogen deposition. Adenomas are common and can appear well circumscribed and may be hypoechoic, isoechoic, or hyperechoic in relation to the remainder of the liver. Increased sound transmission with refractile shadowing at the tumor margins is commonly seen. These findings are related to the paucity of fat and glycogen in the adenomas compared with the rest of the involved liver. These sonographic features are unique to adenomas in patients with glycogen storage disease, whereas adenomas from other causes tend to contain more fat in comparison to the background liver parenchyma. Change in the sonographic appearance of adenomas over time may reflect malignant degeneration or hemorrhagic necrosis. HCC can occur, and any new or significantly changing mass should be further evaluated with contrast-enhanced CT or MRI.
Computed Tomography
The CT density of the liver in glycogen storage disease is altered by two processes with conflicting imaging effects: hepatic attenuation is increased by glycogen storage and decreased by fatty infiltration ( Fig. 89-15A, B ). Which appearance predominates within the liver depends, therefore, on the predominant underlying pathologic process. In addition to the liver, the spleen and kidneys are typically enlarged and the renal cortex may appear dense secondary to glycogen deposition. On noncontrast CT, hepatic adenomas are hypodense compared with normal liver and spuriously hyperdense if there is concomitant fatty infiltration. Unenhanced CT may also demonstrate hemorrhage within an adenoma. Adenomas are also usually well circumscribed and rarely have calcification. After the administration of contrast material, adenomas usually are hypervascular to the liver parenchyma on arterial phase imaging and nearly isoattenuating during the portal venous phase. Adenomas should remain stable in size or show slow growth on follow-up examination. Although distinction of adenomas from HCCs may be challenging on the basis of imaging morphology alone, malignant degeneration should be suspected if there is rapid growth or density change with a focal mass. Clinical assessment with surveillance of α-fetoprotein can also be used to detect development of malignancy and should not be elevated with the presence of adenomas alone.

Magnetic Resonance Imaging
On MRI, the appearance of adenomas varies but in general is heterogeneously hyperintense on T1- and T2-weighted imaging. Focal areas of hypointensity may represent old hemorrhage or calcification. The presence of microscopic fat demonstrates focal signal intensity loss on the T1 opposed-phase sequence in comparison with the in-phase sequence ( Fig. 89-15C ). Enhancement on hepatobiliary phase imaging with liver-specific gadolinium agents is not expected, which, however, does not help differentiate an adenoma from a dysplastic or malignant mass.
Amyloidosis
Clinical and Pathologic Findings
Amyloidosis is a systemic process whereby insoluble protein aggregates accumulate in various organs throughout the body. Several categories of amyloidosis exist, all of which can affect the liver. Primary amyloidosis results from overproduction by the bone marrow, such as in multiple myeloma. Secondary amyloidosis is due to chronic inflammatory disease. A rare familial form of amyloidosis also exists. Hepatic infiltration and enlargement are frequently found in patients with systemic amyloidosis, but significant liver disease is rare. Amyloid within the liver is deposited within spaces of Disse and then progressively encroaches on adjacent hepatic parenchymal cells and sinusoids. Cellular replacement of large areas of liver parenchyma may occur, giving the liver at gross pathologic examination a pale, waxy gray, firm appearance. Hepatic function is usually preserved despite marked amyloid infiltration. When amyloidosis is severe, it may be clinically symptomatic, manifested with right upper quadrant pain caused by stretching of Glisson’s capsule, pruritus, ascites, malaise, weight loss, intrahepatic cholestasis, or portal hypertension.
Radiologic Findings
Radiologic findings of amyloidosis are mostly nonspecific. On sonographic evaluation, the liver is enlarged and inhomogeneous in echotexture. On CT, findings also include hepatomegaly, and areas of low attenuation can occasionally be seen in focal areas of amyloid deposition. Calcification, also nonspecific, can also be present. Delayed contrast enhancement may be seen in the involved areas because of vascular and sinusoidal infiltration. A specific pattern of hepatomegaly with focal triangular enlargement near the falciform ligament and pointed surface anteriorly has been suggested. Concomitant abnormalities seen in the spleen, including enlargement, decreased attenuation, and possible calcification, are helpful in differentiating amyloid deposition from hepatic neoplasm and fatty infiltration but are not often present.
On MRI, patients with primary amyloidosis demonstrate decreased T2 signal intensity within the spleen and adrenal glands and increased T2 signal intensity of the pancreas in comparison with normal individuals. Signal intensity within the liver may appear normal or increased on T1 (etiology unknown); however, T2 intensity is not significantly changed within the liver. Suggestion of delayed or absent contrast enhancement with liver-specific contrast agents has been suggested as a way to identify focal areas of amyloid deposition.
Wilson’s Disease
Clinical and Pathologic Findings
Wilson’s disease, also called hepatolenticular degeneration, is an autosomal recessive inherited disorder of copper metabolism. Copper is balanced within the body by regulation of its excretion and is protein bound within the serum. In Wilson’s disease, there is a copper-transporting enzyme mutation that is manifested with decreased biliary excretion of copper, excessive absorption of copper from the gastrointestinal tract, abnormal urinary excretion of copper, and decreased levels of ceruloplasmin, the serum protein to which 95% of body copper is bound. Copper accumulates in hepatocytes until all the binding sites are used, at which point unbound copper causes oxidative damage. Accumulation then occurs in other organs, including the basal ganglia, renal tubules, cornea, bones, joints, and parathyroid glands.
Clinical presentation can vary secondary to different mutations and degree of dysfunction of the copper-transporting adenosine triphosphatase; onset of the disease occurs as early as 5 years to as late as 40 years of age. Liver disease with a completely nonfunctioning enzyme most often is manifested in childhood or early adolescence with signs and symptoms including fatigue, hepatosplenomegaly, variceal bleeding, ascites, and encephalopathy. Hemolytic anemia can occur by a mechanism thought to be due to hemoglobin damage secondary to serum copper accumulation. This can result in acute fulminant hepatic failure.
The onset of neurologic symptoms usually occurs later, in early adulthood after cirrhosis is present. If hepatic changes remain subclinical, the patient may present with an asymmetric tremor, ataxia, speech disturbance, personality changes, and Parkinson-like symptoms including decreased movement and facial expression. Kayser-Fleischer rings are green to brown copper deposits in the cornea, and their presence is a helpful diagnostic finding in 98% of untreated patients. A slit-lamp examination is warranted in any patient with this suspected diagnosis of Wilson’s disease.
Laboratory diagnostic tests can be helpful in differentiating Wilson’s disease from other hepatic diseases. Low serum ceruloplasmin concentration (<50 mg/100 mL) is present in 95% of cases and highly suggestive of Wilson’s disease. Urinary copper (>100 pg/day) is elevated and can be useful in diagnosis and treatment monitoring. Liver aspartate transaminase, although nonspecific, is also elevated early in the disease. Genetic testing in patients with a family history can be performed.
On pathologic examination, electron microscopy of liver biopsy specimens shows fat droplets, nuclear glycogen deposits, and cellular necrosis. Inflammatory cells accumulate, and eventually fibrosis, loss of hepatic architecture, and cirrhotic changes are seen. Hepatic copper content is high (>250 µg/g dry weight; normal is <55 µg/g), which is concentrated in the sinusoidal and periportal distribution. Copper initially accumulates in the cytoplasm, followed by lysosomes. Morphologic abnormalities of the mitochondria are also seen. Marked elevation of hepatic copper can also be seen in the setting of chronic cholestasis but can usually be differentiated from Wilson’s disease with clinical information and biliary obstruction seen with imaging.
The difficulty in the early recognition of this disease is its infrequency and subtlety of its early manifestations. Early diagnosis is crucial to the prognosis; effective treatment is available with copper chelators, such as penicillamine, to prevent toxic copper deposition. Dietary intake of copper should also be limited. According to the American Association for the Study of Liver Diseases, the diagnosis of Wilson’s disease should be considered in patients aged 3 to 55 years with liver disease of uncertain etiology, in acute hepatic failure, and in NAFLD. Treatment of asymptomatic patients prevents manifestations of the disease; however, treated symptomatic patients also often improve, sometimes dramatically. Acute hepatic failure, end-stage cirrhosis, and failure of chelation therapy are indications for liver transplantation, which is curative.
Radiologic Findings
Imaging findings of Wilson’s disease are predominantly nonspecific, although more specific features have been suggested. The natural history of Wilson’s disease is similar to that of other diffuse liver diseases and includes fatty infiltration, acute hepatitis, chronic active hepatitis, cirrhosis, and sequelae of portal hypertension.
Ultrasound, CT, and MRI can show heterogeneous hepatic parenchyma, contour irregularity, and macronodularity (nodules >3 mm). Ultrasound can demonstrate these macronodules, which are predominantly hypoechoic. A publication evaluating 28 patients suggests that unique imaging features of Wilson’s disease, which include a normal caudate lobe–to–right hepatic lobe ratio (normal, <0.6) and a perihepatic layer of fat, can be demonstrated with all three modalities. HCC can occur but is reported almost exclusively in patients who have developed cirrhosis.
Copper has a high atomic number and can increase hepatic attenuation on CT. This can be seen diffusely or focally within hepatic nodules. This finding is not often seen, however, probably secondary to coexistent hepatic steatosis, lowering the overall hepatic density and diminishing this effect.
Copper also has a paramagnetic effect and shortens T1 relaxation time, which would be expected to result in T1 hyperintensity. Copper, however, has low magnetic susceptibility and does not significantly alter the local magnetic field in comparison to other metals, such as iron and titanium. MRI signal is therefore not visibly altered in the presence of copper and cannot be used to differentiate Wilson’s disease from other diffuse liver diseases. Regenerative nodules are often present and as in other forms of cirrhosis can contain iron, resulting in T1/T2 hypointensity, also nonspecific.
Phosphorus 31 MR spectroscopy is a technique that can be used to assess the severity of hepatic injury and provide a noninvasive baseline to assess treatment response as an alternative to percutaneous biopsy ( Fig. 89-16 ). This technique may have limited availability and practicality.