Diffusion tensor imaging (DTI) is a widely applied quantitative magnetic resonance imaging (MRI) approach to characterize tissue microstructure throughout the body. In addition to quantifying the amount of water diffusion hindrance by tissue, DTI also captures the orientational bias (anisotropy) caused by a microstructural environment with a preferred direction. Although the initial application of DTI largely occurred in the axonal nerve bundles of the brain, a growing literature of studies have performed DTI of the breast, applied most often to study breast cancer. This has led to extensive DTI research of both breast cancer lesions themselves and the surrounding fibroglandular tissue (FGT) to identify DTI properties distinguishing the two that can aid in diagnosis. Lesions tend to be dense, cellular, and disorganized, whereas FGT comprises more freely diffusing fluid-filled ducts and collagen oriented within the ductal tree. Thus both degree of restriction and its orientation may be diagnostic breast MR biomarkers. DTI metrics have shown promise to facilitate biological stratification of breast lesions (related to presence of malignancy, prognostic factors, and subtypes) and to aid in prediction of response to therapy. Finally, the Gaussian anisotropic model behind DTI is only one of a variety of models to capture tissue microstructure, and other models are also under exploration for the case of the breast. This chapter will summarize DTI in the breast in these areas, including technical issues, interpretive frameworks, and clinical potential. As with each organ of the body, the application of DTI to the breast is unique in both challenges and benefits.
DTI in the Breast: Basics, Metrics, and Pitfalls
In recent years, diffusion-weighted imaging (DWI) and DTI have been explored as complementary tools in breast MRI to improve lesion characterization, and enhance specificity. Both DWI and DTI allow the quantification of an average diffusion coefficient (i.e., apparent diffusion coefficient [ADC] or mean diffusivity [MD]) that is sensitive to variations in the water diffusion caused by the differences in tissue complexity, such as cell density, cell size, membrane permeability, and extracellular tortuosity. By also capturing diffusion anisotropy, DTI can give a more complete tissue description of both healthy and pathological tissues and potentially provide higher value clinical tools. This includes extraction of additional information reflecting glandular microstructure: the ductal lumens, the epithelial cells, and the surrounding supporting stromal tissue. Specifically, the mammary ductal network comprises a “tree” pattern that facilitates lactation, such that locally (i.e., within an MRI voxel) the orientation of lactiferous ducts and adjacent collagen fibers displays a common direction. Water molecules whose transport is hindered by the ductal wall or collagen fibers will show anisotropic diffusion (i.e., displace further along the duct than across it, on average). Malignant transformation may in turn cause blockage of the ducts by proliferating neoplastic cells and loss of structured organization, potentially resulting in a concomitant reduction of anisotropy measures. Future sections will delve into this literature, sources of contrast, and comparison with pathological lesions in detail. Here we will review the metrics of DTI and the technical requirements to ensure confidence in their deployment, as reviewed recently and in Chapter 1 .
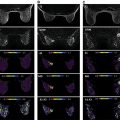
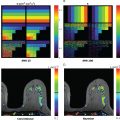
DTI extends the average diffusivity derived by DWI by applying diffusion gradients in multiple directions and allowing characterization of water diffusion directionality or anisotropy. Mathematically, at least six noncollinear directions are required given the need to calculate six independent elements of the symmetrical 3 × 3 diffusion tensor D ij . The tensor is then typically transformed to its principal frame where its diagonal elements (eigenvalues) (λ 1 , λ 2 , and λ 3 ) are the principal diffusivities, their average is the MD, and their corresponding eigenvectors ( v 1 , v 2 , and v 3 ) define the principal diffusion directions. Anisotropy indices are different combinations of the directional diffusion coefficients, such as the normalized variance called fractional anisotropy (FA), which indirectly describe structural elements such as fibers or ducts that partially restrict water diffusion ( Fig. 9.1 ). Although the ADC and MD are in principle equivalent markers of diffusion, the sampling scheme and tensor analysis of DTI add robustness to MD in comparison with ADC measurements by single direction or average of three orthogonal directions in terms of signal-to-noise ratio (SNR) and sensitivity to gradient hardware directional differences. In other organs such as the brain or skeletal muscle, optimization studies have been conducted to determine b value and number of directions choices to minimize noise-induced bias or uncertainty ; a minimum 20 or 30 directions are typically recommended, but it is advised to apply diffusion-weighted images in many directions as allowed by scan time limitation. Analogous efforts have been performed for breast DTI for the application of tractography. In most breast DTI studies, FA has been the common anisotropy index applied both for characterization of the FGT and for cancer diagnosis. It has been shown that water diffusion anisotropy in the healthy breast can be similarly mapped by other normalized anisotropy indices, such as relative anisotropy (RA), and 1-volume ratio (1-VR), as well as by the nonnormalized absolute maximal anisotropy index (λ 1 –λ 3 ). However, there is no consensus regarding which is the optimal parameter to best describe anisotropy for breast cancer diagnosis.

As will be reviewed in later sections, a consensus of studies have shown that MD, similarly to standard ADC, strongly discriminates malignant lesions from benign lesions and from FGT, because malignant invasive ductal carcinoma lesions tend to feature dense cellularity. Furthermore, measures of anisotropy conceptually should help discriminate between healthy structured FGT and the more typically disordered cancerous or precancerous lesions. This is indeed borne out in some DTI studies comparing FGT to lesions, but not all. Similarly, some studies find FA distinguishes benign from malignant lesions, whereas others do not. This clinical diagnostic performance will be reviewed later in this chapter.
Part of those discrepancies might relate to the influence of SNR on the output DTI metrics. Because anisotropy reflects directional variance of diffusion captured in the diffusion eigenvalues, it can be distorted or amplified by random signal variance introduced by signal noise. This effect is sometimes termed “eigenvalue repulsion,” because the eigenvalue spread is artificially enhanced by noise due to the nonlinear diagonalization process; primary eigenvalue λ 1 increases and tertiary eigenvalue λ 3 decreases. FA values, eigenvalue difference λ 1 –λ 3 eigenvalue ratio λ 1 /λ 3 , and RA all increase in the process. In some cases, this may have the effect of increasing sensitivity to disease, but this nonbiological “boost” in utility should be considered cautiously.
Fibroglandular Tissue (FGT) DTI
Dti Parameters of Normal Fibroglandular Tissue
DTI measurements of the normal breast have allowed characterization of the breast ductal/glandular structure. Table 9.1 shows the broad range of reported diffusion parameters that were measured in normal breast tissue of healthy volunteers. Because of the lack of standardization, different DTI protocols were applied in the various studies, making comparison between different scan protocols difficult and resulting in reported mean MD and FA values that span a large range (1.69–2.05 ×10− 3 mm 2 /s and 0.11–0.32, respectively). Water diffusion is independent of field strength, whereas differences in the DTI protocols ( b values, diffusion time, echo time [TE], number of sensitizing diffusion directions, spatial resolution) affect the intensity in the diffusion-weighted images and thus the calculated parameters. For example, selection of the b value affects the derived diffusion coefficients: higher b values lead to a reduction in the SNR and a reduction in the derived MD (or ADC in DWI studies) but not necessarily in FA. In addition to SNR-based artificial decreases, this decrease in MD/ADC can also be explained by the presence of several different diffusion compartments, or equivalently the presence of microstructural complexity gives rise to non-Gaussian diffusion kurtosis effects. Additional differences in the derived values emerge from the size and placement of the regions of interest (ROIs) for the analysis, from partial volume effects due to unsuppressed fat, or from biological effects due to age and/or hormonal status.
| Publication | Age (Years), Number of Participants ( n ) | TE ( t D ) (ms) | Field, Protocol #Directions/ b Value | Resolution (mm) | Parameter (Average ± SD) (10–3 mm 2 /s) | FA | ||||
|---|---|---|---|---|---|---|---|---|---|---|
| MD | λ 1 | λ 2 | λ 3 | λ 1 –λ 3 | ||||||
| Partridge et al. | 25–72, n = 12 | 71.5 (35) 71.5 (35) |
| 1.9 × 1.9 × 4–5 |
| 2.51 ± 0.28 | 1.89 ± 0.25 | 1.39 ± 0.26 | n/a | 0.29 ± 0.05 0.30 ± 0.05 |
| Tagliafico et al. | 28–85, n = 60 | minimum | 3 T, SE-EPI 32/1000 s/mm 2 | 2.7 × 2 × 2 | 1.92 ± 0.30 | n/a | n/a | n/a | n/a | 0.32 ± 0.09 |
| Plaza et al. |
| 80–120 |
| 2.2–2.7 × 2.2–2.7 × 4 |
|
|
|
|
|
|
| Wang et al. |
| minimum |
| 2.8 × 2.8 × 3 | n/a | n/a | n/a | n/a | n/a |
|
| 6/400, 600, 800 or 1000 s/mm 2 | 0.28–0.29 ± 0.1 | |||||||||
| Nissan et al. | 22–34, n = 15 | 120 (47) | 3 T, Bipolar SE-EPI30/ 700 s/mm 2 | 1.9 × 1.9 × 2.5 | 1.95 ± 0.18 | 2.44 ± 0.16 | 1.91 ± 0.19 | 1.49 ± 0.21 | 0.95 ± 0.13 | 0.25 ± 0.04 |
| Teruel et al. | 25–34, n = 6 | 45 (68.5) 45 (902.5) | 3 T, STEAM-DTI 6/500 s/mm 2 | 2.1 × 2.1 × 5 | 1.97 ± 0.26 1.77 ± 0.25 | 2.21 ± 0.27 2.17 ± 0.24 |
| n/a n/a |
| |
| Eyal et al. | 29–66, n = 21 | 120 (47) |
| 1.9 × 1.9 × 1.9 – 2.5 | 1.76 | 2.17 | 1.76 | 1.36 | 0.77 | 0.23 |
| Scaranelo et al. | 37–69, n = 6 | 86 (~43) |
| 1.9 × 1.9 × 4 | 1.69 | 2.20 | 1.64 | 1.10 | 0.99 | n/a |
| Furman-Haran et al. | 23–68, n = 6 |
|
| 1.9 × 1.9 × 1.9 – 2.5 | n/a | n/a | n/a | n/a |
|
|
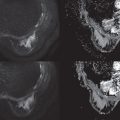
Additionally, selection of the diffusion time (which in spin-echo echo-planar imaging [SE-EPI] is about TE/2) is a compromise between SNR and sensitivity to restriction. Water diffusion in a complex microenvironment will depend on the time allotted (i.e., diffusion time), because at longer diffusion times, more water molecules encounter barriers to their transport. This reduces the average displacement per time of the ensemble and therefore the measured diffusion coefficient. Not only does this decrease of diffusivity increase the measured contrast in the tissue of interest, but with biophysical modeling it can provide quantitative microstructural estimates. Teruel and colleagues, using a stimulated-echo approach with variable diffusion times (69–903 ms), showed that the MD in healthy FGT decreased with increasing diffusion time. This decrease was attributed mainly to a decrease in the radial diffusivity (corresponding to diffusion in the direction perpendicular to the ductal walls), whereas the axial diffusivity (corresponding to free diffusion parallel to the ducts) remained at a similar value in the various diffusion times ( Fig. 9.2 ). Consequently, an increase of FA with the diffusion time was observed. A first-order modeling of the decline of radial diffusion using the Mitra theory to estimate surface-to-volume ratio provided size estimates of the order of magnitude (hundreds of microns) represented by duct diameters, consistent with histological quantification of human breast specimens. Similar results were obtained in a study that used bipolar SE-EPI and compared the derived anisotropy indices obtained with a TE of 90 ms versus 120 ms (corresponding to diffusion times of 33 ms and 47 ms, respectively), whereas all tested anisotropy indices (FA, RA, 1-VR, and λ 1 –λ 3 ) showed an increase in the derived values following an increase in the diffusion time. These findings are consistent with the higher sensitivity to microstructural features with the increased diffusion time, as more water molecules approach the structural barriers (see Fig. 9.2 ). According to the Einstein equation (in one dimension, x 2 = 2 Dt D , where x is the mean displacement of water molecules, D is the diffusion coefficient, and t D is the diffusion time; see also Chapter 1 ), for diffusion times in the range 30 to 50 ms (typical for most clinical DTI protocols), the mean displacement is about 7 to 10 μm (assuming D of free water at 37 degrees of ~3.0 × 10 –3 mm 2 /s). Because the mean diameter of most normal ducts is considerably larger (average of 90 μm, ranging from 40 μm to 314 reported in a postmortem specimens study ), only a fraction of molecules—those close to the ductal walls—experience restriction and to a different extent across the various clinical DTI protocols. Additionally, partial volume effects due to voxel sizes being significantly larger than the ductal diameters contribute to reduction in sensitivity to restricted water diffusion.

Several studies have investigated the distribution of the DTI parameters in the various regions of the normal breast tissue. In a study by Partridge and colleagues, image analysis comparing ROIs (~130 mm 2 in size) subjectively placed in anterior, central, and posterior regions in 12 healthy volunteers revealed that MD and FA are affected by location in the breast, with higher MD values in the central breast regions and higher FA in outer posterior regions. In contrast, in the study of Tagliafico and colleagues, small ROIs (30 mm 2 in size) placed in anterior, central, and posterior breast regions were compared, and no significant regional differences were observed in breast MD and FA. A possible explanation for this controversy is the use of minimal possible TE by Tagliafico and colleagues that reduced the sensitivity to restriction. Another explanation may be the small size of the ROIs and their subjective placement.
Weiderer and colleagues, in an attempt to avoid dependence on ROI positioning, applied 2D histogram analysis and mapped the diffusion parameters in a cohort of seven healthy premenopausal volunteers. In this study, in agreement with the work of Partridge and colleagues, the highest MD values were found in the central areas of the breast parenchyma, which are directed toward the breast papilla, whereas toward the periphery of the breast a decline was seen. The higher MD values in central areas may be due to larger areas of FGT in this region, resulting in less partial volume averaging with adipose tissue. Pixel-by-pixel statistical analysis further revealed that the central areas of high MD corresponded to areas of low FA, whereas the peripheral areas of low MD showed relatively high FA. Higher anisotropy in outer and posterior regions was also demonstrated by mapping the various anisotropy indices in a cohort of six healthy volunteers. The higher restriction in outer and posterior regions is presumably due to a higher concentration of small peripheral ducts and terminal ductal lobular units with low diameter in these regions and hence higher restriction of water diffusion in the directions orthogonal to the ductal walls. On the other hand, regions with low anisotropy values in the healthy FGT indicate the absence of water-restricting structures, presumably regions that are predominantly composed of fibrous connective tissue or regions with ducts near the nipple that—despite their directionality toward the nipple, the combination of their large diameter, and the relatively short diffusion time—reduced the sensitivity to restriction. An example for the spatial distribution of the DTI parameters is shown in Fig. 9.1 .
A similar but more pronounced distribution of the DTI parameters was reported by Nissan and colleagues in the lactating breast, wherein the distribution of all diffusion coefficients (λ 1 , λ 2 , λ 3 and MD) indicated faster diffusion in the anterior regions close to the nipple compared with posterior regions. The distribution of the anisotropy indices λ 1 –λ 3 and FA revealed low anisotropy in anterior regions close to the nipple that increased toward the posterior regions ( Fig. 9.3 ). The low anisotropy in regions close to the nipple can be explained by the presence of ducts with large diameter similar to the spatial resolution of the DTI protocol (about 2 mm). Indeed, in vivo ultrasound of the lactating breast showed that the mean diameter of the ducts in the base of the nipple was 2.0 ± 0.8 mm (range 1.1–4.4 mm). In these large ducts, only a small fraction of the molecules (those close to the walls) are restricted, and therefore the average anisotropy is relatively low.

Hormonal Regulation of Breast Dti Parameters During the Menstrual Cycle
Because of the increased interest in clinical usage of diffusion-weighted MRI, hormonal-induced changes on the diffusion MR imaging parameters were investigated. Nissan and colleagues have investigated the parameters obtained with DTI of the breast in premenopausal healthy volunteers throughout the menstrual cycle phases ( n = 15). It was shown that the diffusion coefficients (λ 1 , λ 2 , λ 3 and ADC) and the anisotropy indexes (FA and λ 1 –λ 3 ) were almost constant throughout the menstrual cycle, with a very small within-subject coefficient of variance of 1% to 2% for the diffusion coefficients and 5% to 6% for the anisotropy parameters. Additionally, comparing between a group of premenopausal nonlactating volunteers who used oral contraceptive (OC; n = 7) to OC-free volunteers ( n = 8) did not show significant differences for all DTI parameters. Wiederer and colleagues likewise reported no statistical significant changes in MD and FA derived from a breast DTI study of premenopausal OC free volunteers with regular menstrual cycle that were examined in four consecutive weeks ( n = 7).
These results are in general agreement with studies that investigated menstrual cycle effects on ADC derived from DWI studies of the breast, as described in Chapter 7 . Furthermore, even reported menstrual changes in diffusion metrics are relatively small in comparison to more than 30% reduction in ADC in breast tumors in comparison to ADC of normal tissue. Thus the diagnostic accuracy of DWI/DTI parameters of the normal breast FGT is likely minimally affected by the histological changes of the epithelial and stromal components and vascular changes that occur during the menstrual cycle, and thus the timing for performing breast DWI/DTI is not restricted throughout the menstrual cycle.
Dti of the Postmenopausal Breast
It has been suggested that falling serum estradiol and progesterone in postmenopausal women can cause a reduction in the water-containing glandular epithelium, collagenization of the interlobular stroma, and thickening of the lobular basement membranes, all of which reduce water diffusion (see also Chapter 7 ). Indeed, comparing breast ADC values of premenopausal to postmenopausal women who did not use hormonal replacement therapy (HRT) revealed that the diffusion coefficients (λ 1 , λ 2 , λ 3 and ADC) were significantly higher by 9% to 14% in premenopausal women, but there were no differences in anisotropy indices. Reduced average ADC of normal FGT in postmenopausal women without HRT versus premenopausal women was also observed in DWI studies of healthy volunteers and in the normal contralateral FGT of breast cancer patients ( Table 9.2 ).
Stay updated, free articles. Join our Telegram channel

Full access? Get Clinical Tree


