Conventional MR imaging provides low specificity in the differential diagnosis of musculoskeletal (MSK) tumors and is unable to offer information about the extent of tumoral necrosis and the presence of viable cells, information crucial to assess treatment response and prognosis. Therefore, diffusion-weighted imaging (DWI) is now used with conventional MR imaging to improve diagnostic accuracy and treatment evaluation. This article discusses the technical aspects of DWI, particularly the quantitative and qualitative interpretation of images in MSK tumors. The clinical application of DWI for tumor detection, characterization, differentiation of tumor tissue from others, and assessment of treatment response are emphasized.
MR imaging has become the diagnostic method of choice for preoperative and posttreatment staging of musculoskeletal (MSK) tumors because of the high resolution, tissue contrast, and multiplanar capability of this technique.
In addition, MR imaging offers several advantages when compared with other imaging methods in the evaluation and staging of soft tissue tumors. Several studies have demonstrated morphologic parameters such as size, margin demarcation, involvement of adjacent vital structures, homogeneity in signal intensity, and measurement of relaxation time as criteria to evaluate soft tissue tumors. In accordance with these criteria, malignancy can be predicted with the following parameters ( Fig. 1 ) :
- •
Heterogeneous signal intensity in a T1 scan
- •
Tumor necrosis
- •
Bone or neurovascular involvement
- •
Mean diameter of more than 66 mm.

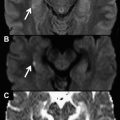
However, conventional MR imaging provides low specificity in the differential diagnosis of several MSK tumors because many of the lesions exhibit nonspecific characteristics. As a result, a correct histologic diagnosis is possible in only a quarter to one-third of cases. Conventional MR imaging is unable to offer information about the extent of tumoral necrosis and the presence of viable cells, information that is crucial for the assessment of treatment response and prognosis. Therefore, advanced MR imaging techniques, such as diffusion-weighted imaging (DWI), are now used in association with conventional MR imaging with the objective of improving diagnostic accuracy and treatment evaluation. DWI allows quantitative and qualitative analyses of tissue cellularity and cell membrane integrity and has been widely used for tumor detection and characterization and to monitor treatment response ( Fig. 2 ).

The tumor tissue is usually more cellular when compared with other tissues and tends to appear at high signal intensities (restricted diffusion) when DWI is used ( Fig. 3 ).

The tissue contrast obtained using DWI is different from that obtained using conventional MR imaging, which facilitates the detection of soft tissue and bone tumors, particularly bone metastasis. In fact, previous studies have concluded that DWI is an extremely sensitive method for identifying bone metastases and is superior to both positron emission tomography (PET) and scintigraphy in terms of detection capability. The detection of bone metastasis is important for cancer staging and in the determination of treatment strategy, and some reports have demonstrated whole body DWI to be highly sensitive and efficient for this purpose.
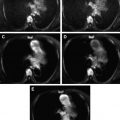
Tumors differ in cellularity characteristics, and this difference is useful in determining their histologic composition. It has been reported that DWI can differentiate benign from malignant soft tissue tumors ( Fig. 4 ).

The malignant tumors have more cellularity than benign tumors and tend to have a more restricted diffusion ( Fig. 5 ).

In accordance with this finding, perfusion-corrected DWI has demonstrated potential in differentiating benign from malignant soft tissue masses. In addition, DWI is also used for differentiating between chronic expanding hematomas (CEHs) and malignant soft tissue tumors. CEHs are frequently misdiagnosed as malignant soft tissue tumors because of their morphologic characteristics, which include large size, slow progressive enlargement, and heterogeneous signal intensity on conventional MR imaging. DWI has also been shown to be an additional tool for differentiating vertebral fracture caused by osteoporotic collapse with bone marrow edema as well as pathologic collapse caused by tumor infiltration or metastatic disease.
On the other hand, some investigators have reported overlapping apparent diffusion coefficient (ADC) values in benign and malignant soft tissue tumors, which consequently could not be used to differentiate them. This overlapping is likely because of the fact that ADC values can be affected by cellularity and the extracellular matrix. For example, myxoid matrix is widely seen in the interstitial spaces in many soft tissue tumors, and this presence can influence the ADC values ( Fig. 6 ).

As a result, myxoid tumors will have significantly higher ADC values than nonmyxoid tumors. It makes no difference if the tumor is benign or malignant.
DWI can also be used to monitor tumor response to treatment, most likely because effective anticancer therapy results in changes in the tumor microenvironment, resulting in an increase in the diffusion of water molecules and a consequent increase in the ADC value ( Fig. 7 ).

Furthermore, DWI has been used to provide information regarding cellular changes related to cytotoxic treatment in soft tissue sarcomas. Some investigators have suggested that it could be possible to evaluate the response of osteosarcoma to chemotherapy using DWI, considering that the ADC values of viable tumor tissue and tumor necrosis differ significantly. This information is a crucial prognostic factor for patients with osteosarcoma.
This article provides a short discussion of the technical aspects of DWI, particularly the quantitative and qualitative interpretation of diffusion-weighted (DW) images in MSK tumors. The clinical application of DWI for tumor detection, characterization, differentiation of tumor tissue from nontumor tissue, and assessment of treatment response are emphasized.
Technical aspects
Herein, the authors briefly discuss some important concepts regarding the specificity of DWI in the MSK system. However, for a detailed explanation of the physics of DWI see the article elsewhere in this issue. See the article by Figueiredo and colleagues elsewhere in this issues for further exploration of this topic.
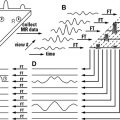
DWI exploits the random motion of water molecules in the body, which is classically called the Brownian motion. In biologic tissues, the movement of water molecules is restricted because their motion is modified and limited by their interactions with cellular membranes and macromolecules. The DWI signal in vivo is therefore derived from the motion of water protons in extracellular, intracellular, and intravascular spaces.
DWI yields qualitative and quantitative information that reflects tissue cellularity and cell membrane integrity, which complements the morphologic information obtained by conventional MR imaging. Thus, the data obtained from DWI must be interpreted using qualitative and quantitative approaches.
Qualitative analysis is achieved via visual assessment of the relative tissue signal attenuation of both the DW image and the ADC parametric map. The visual assessment of DW image enables tissue characterization based on differences in water diffusion and is performed by observing the relative attenuation of the signal intensity of images obtained at different b values. In a heterogeneous tumor, for instance, the more cystic or necrotic fraction of the tumor will show greater signal attenuation on high–b value images because water diffusion is less restricted, whereas the more cellular solid tumor areas will continue to show a relatively high signal intensity ( Fig. 8 ).

By contrast, on the ADC parametric map, visual assessment reveals a trend opposite to that of DW images: areas of restricted diffusion in highly cellular areas appear as low signal intensity areas compared with less cellular areas, which have a higher signal intensity (see Fig. 5 ). Quantitative analysis is performed by calculating the conventional ADC value and/or perfusion-insensitive diffusion coefficient (PIDC) value. The conventional ADC value is calculated using a biexponential function from DWI, which includes low b values (b = 0–600 s/mm 2 ), or can be obtained alternatively by drawing regions of interest (ROIs) on the ADC map. However, an exponential function fitted only through the high b values (b = 300, 450, and 600s/mm 2 ) can be used to describe the PIDC value. This measurement excludes the initial reduction of signal intensity that is probably caused by vascular capillary perfusion. Consequently, for large b values, perfusion effects tend to be canceled out. The PIDC map may provide more accurate information about tumor tissue cellularity by minimizing vascular contributions, which are higher in malignant tumors ( Fig. 9 ).

Related posts:
 Diffusion Magnetic Resonance Imaging in the Head and Neck
 Diffusion MR Imaging in Central Nervous System
 Basic Concepts of MR Imaging, Diffusion MR Imaging, and Diffusion Tensor Imaging
Diffusion-Weighted Magnetic Resonance Imaging in the Upper Abdomen: Technical Issues and Clinical Applications
Pelvic Applications of Diffusion Magnetic Resonance Images
Basic Concepts of MR Imaging, Diffusion MR Imaging, and Diffusion Tensor Imaging
Diffusion-Weighted Magnetic Resonance Imaging in the Upper Abdomen: Technical Issues and Clinical Applications
Pelvic Applications of Diffusion Magnetic Resonance Images
 Diffusion-Weighted Imaging of the Chest
Stay updated, free articles. Join our Telegram channel

Full access? Get Clinical Tree


