Recent technological achievements have enabled the transposition of diffusion-weighted imaging (DWI) with good diagnostic quality into other body regions, especially the abdomen and pelvis. Many emerging and established applications are now being evaluated on the upper abdomen, the liver being the most studied organ. This article discusses imaging strategies for DWI on the upper abdomen, describes the clinical protocol, and reviews the most common clinical applications of DWI on solid abdominal organs.
Diffusion-weighted imaging (DWI) is a modality that assesses the random movement of water molecules within different physical media through the use of magnetic resonance (MR) imaging. In a totally unrestricted environment, water movement is completely random, a phenomenon known as Brownian motion or free diffusion. In biologic tissues, this movement is impeded by interactions with molecules and cellular structures. The data generated with DWI allows for an indirect estimate of information concerning tissue composition, cell density, microperfusion, and even cell membrane viability.
Historically, the DWI sequence found its first clinical application in the early diagnosis of acute ischemic stroke. To date, it has been widely used in the neuroimaging setting. Application of the technique was until recently limited to brain studies because of its low signal/noise ratio (SNR) and high susceptibility to movement and paramagnetic artifacts.
DWI of the abdomen and pelvis in routine clinical practice is a recent achievement, owing to a new generation of scanners with higher magnetic fields (3.0 T vs 1.5 T), higher gradient amplitudes, echo planar and parallel image acquisition protocols, better movement-correction solutions, and new phased-array multichannel surface coils.
With growing interest from the scientific community, many centers have now integrated DWI into their abdominal MR protocols, owing to its potential to detect, characterize, and even provide follow-up parameters for neoplastic and inflammatory conditions. Nevertheless, although strong evidence has increasingly supported these assumptions, the technique still lacks measurement reproducibility and standardization across different scanners/vendors, sequence designs, acquisition parameters, and follow-up features.
This article reviews imaging strategies for DWI in the upper abdomen that are currently used, describes the routine clinical protocols and variants that have been reported, reviews the most common and established clinical applications, and lists possible avenues of investigation and future indications.
Rationale for abdominal DWI
Standard anatomic MR imaging is based solely on contrast differences between proton density, T1, and T2 among structures and tissues. Although these distinctions enable some tissue characterization (eg, water vs fat, white matter vs gray-matter), they give no information about tissue integrity and cellularity, and may not always reflect early alterations with sufficient contrast resolution for recognition with the naked eye.
DWI is deemed to be a functional modality because impedance of water molecule diffusion partially reflects tissue cellularity and the presence of intact cellular membranes. Therefore, tissues associated with restricted diffusion include tumors, inflamed tissues/abscesses, fibrotic tissues, hematomas, and cytotoxic edema. Conversely, unimpeded diffusion is found in tissues with low cellularity, disrupted cell membranes, and fluid cystic content. The basic physics involved and the measurement parameters are addressed elsewhere in this issue.
In the abdomen, the additional information provided by DWI examinations may be extremely useful because many neoplastic and inflammatory lesions have a low contrast in relation to background tissues/organs on conventional sequences, thus enabling better detection through DWI. Furthermore, the quantitative information provided by apparent diffusion coefficient (ADC) measurements is believed to correlate with tissue cellularity, potentially allowing for lesion characterization. Also, alterations in microscopic cytoarchitecture and vascularization may precede changes in macroscopic morphologic measurements, underscoring the potential for DWI in follow-up after chemoradiation therapy. Patients with impaired renal function or those who are allergic to gadolinium chelates may benefit from DWI, precluding the use of endovenous paramagnetic agents.
Fine-tuning DWI parameters for the upper abdomen
To achieve good diagnostic DWI sequences in the abdomen, one has to overcome the intrinsic limitations of the technique, as well as a series of known pitfalls and artifacts related to this region of interest.
Low SNR, which is inherent to the method, is the first limitation. It may be resolved by using high magnetic field imaging (1.5 vs 3.0 T), low echo time values (<100 ms), an increased number of excitations, low matrix resolution (eg, 128×128 at 1.5 T and 256×256 at 3.0 T), a thickening of the slices (of ≥6 mm), and a large field of view. Also, faster imaging techniques, such as parallel imaging, allow the acquisition of b-values in multiple directions, which enables signal averaging that further increases SNR.
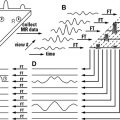
The choice of an adequate set of b-values is a topic of much debate among institutions and investigators, because each b-value adds a considerable fraction of acquisition time, but too few b-values compromise tissue characterization and accurate ADC measurement. There are ongoing studies to examine the balance of this relationship and determine the best set of b-values for most organs in the human body. In addition, some propose 2 different sequences in the same examination, one with 2 b-values (usually 0 and 10–100 s/mm 2 ) for lesion detection and another with multiple b-values (6–12 b-values, of 0–1600 s/mm 2 , depending on the institution) for accurate ADC calculation and lesion characterization.
Another major limitation of DWI is the increased susceptibility to motion and magnetic artifacts, which can be managed by respiratory and cardiac triggering, breath-hold acquisition, and fast imaging techniques. Although breath-hold sequences are less prone to motion artifacts, their quantitative ADC analyses are considered to be less accurate and have generally lower values than those provided by respiratory-triggered sequences. Another strategy, described by Takahara and colleagues, relies on free-breathing acquisition with multiple numbers of excitations and signal averaging, which claims to increase SNR and enable more accurate ADC measurement. Susceptibility to magnetic artifacts is intrinsic to the echo planar sequence and evidence shows that iron deposits or metal devices may lead to restricted diffusion. However, this same artifact may be useful because the use of superparamagnetic iron oxide (SPIO)–based contrast media on echo planar sequences can be used for the further detection and characterization of liver lesions.
Ghosting from respiratory movements and chemical-shift artifacts is resolved by the robust fat-suppression techniques that are now available. T1 effects can be minimized by using high repetition time values (usually >2500 ms, which is 3 times the T1 of a typical liver metastasis). And T2 shine-through effects are dealt with by applying high b-values (>1000 s/mm 2 ) or by interpreting the ADC map in conjunction with the raw diffusion-weighted images.
DWI, being a functional MR modality, is a technique that relies more on contrast than on resolution. Therefore, when fine-tuning an acquisition protocol, a high SNR and a low influence of artifacts or T1/T2 effects should be pursued rather than striving for in-plane resolution. Good spatial resolution can be more easily achieved through conventional anatomic sequences, which are then fused with DWI information through simple postprocessing applications.
Fine-tuning DWI parameters for the upper abdomen
To achieve good diagnostic DWI sequences in the abdomen, one has to overcome the intrinsic limitations of the technique, as well as a series of known pitfalls and artifacts related to this region of interest.
Low SNR, which is inherent to the method, is the first limitation. It may be resolved by using high magnetic field imaging (1.5 vs 3.0 T), low echo time values (<100 ms), an increased number of excitations, low matrix resolution (eg, 128×128 at 1.5 T and 256×256 at 3.0 T), a thickening of the slices (of ≥6 mm), and a large field of view. Also, faster imaging techniques, such as parallel imaging, allow the acquisition of b-values in multiple directions, which enables signal averaging that further increases SNR.
The choice of an adequate set of b-values is a topic of much debate among institutions and investigators, because each b-value adds a considerable fraction of acquisition time, but too few b-values compromise tissue characterization and accurate ADC measurement. There are ongoing studies to examine the balance of this relationship and determine the best set of b-values for most organs in the human body. In addition, some propose 2 different sequences in the same examination, one with 2 b-values (usually 0 and 10–100 s/mm 2 ) for lesion detection and another with multiple b-values (6–12 b-values, of 0–1600 s/mm 2 , depending on the institution) for accurate ADC calculation and lesion characterization.
Another major limitation of DWI is the increased susceptibility to motion and magnetic artifacts, which can be managed by respiratory and cardiac triggering, breath-hold acquisition, and fast imaging techniques. Although breath-hold sequences are less prone to motion artifacts, their quantitative ADC analyses are considered to be less accurate and have generally lower values than those provided by respiratory-triggered sequences. Another strategy, described by Takahara and colleagues, relies on free-breathing acquisition with multiple numbers of excitations and signal averaging, which claims to increase SNR and enable more accurate ADC measurement. Susceptibility to magnetic artifacts is intrinsic to the echo planar sequence and evidence shows that iron deposits or metal devices may lead to restricted diffusion. However, this same artifact may be useful because the use of superparamagnetic iron oxide (SPIO)–based contrast media on echo planar sequences can be used for the further detection and characterization of liver lesions.
Ghosting from respiratory movements and chemical-shift artifacts is resolved by the robust fat-suppression techniques that are now available. T1 effects can be minimized by using high repetition time values (usually >2500 ms, which is 3 times the T1 of a typical liver metastasis). And T2 shine-through effects are dealt with by applying high b-values (>1000 s/mm 2 ) or by interpreting the ADC map in conjunction with the raw diffusion-weighted images.
DWI, being a functional MR modality, is a technique that relies more on contrast than on resolution. Therefore, when fine-tuning an acquisition protocol, a high SNR and a low influence of artifacts or T1/T2 effects should be pursued rather than striving for in-plane resolution. Good spatial resolution can be more easily achieved through conventional anatomic sequences, which are then fused with DWI information through simple postprocessing applications.
DWI in the upper abdomen: how we do it?
DWI is routinely performed at our institution during abdominal MR examinations, regardless of the indication. Although previous studies have shown that performing DWI after the administration of gadopentetate dimeglumine does not seem to affect ADC calculations in the liver, there seems to be a slight decrease on the ADC at brain studies. Therefore, we try to perform the acquisition before contrast material administration.
The two imaging strategies used are summarized in Table 1 . The first strategy relies on a two b-value (0 and 1000 s/mm 2 ) breath-hold acquisition and is used either when there is no suspected focal lesion to characterize, or when the indication is unclear/nonspecific. The region of interest ranges from the liver to the lower renal poles and comprises widely-spaced thick slices. Once the acquisition time reaches approximately 29 seconds, the benefits gained from occasional unsuspected lesion detection or characterization by this sequence outweigh the extra time that is needed.
| Parameter | 1.5 T | 3 T | ||
|---|---|---|---|---|
| Breath-hold Acquisition | Respiratory-triggered Acquisition | Breath-hold Acquisition | Respiratory-triggered Acquisition | |
| Field of view (right–left × anteroposterior in mm) | 400×400 | 360×347 | 400×400 | 360×360 |
| Matrix size (phase × frequency encoding) | 128×128 | 164×164 | 130×130 | 164×164 |
| Repetition time (ms) | 2600 | 2800 | 2100 | 1500 |
| Echo time (ms) | 80 | 81 | 70 | 74 |
| Echo planar imaging factor | 128 | 158 | 130 | 164 |
| Phase-encoding direction | Anteroposterior | Anteroposterior | Anteroposterior | Anteroposterior |
| Parallel imaging acceleration factor | 2 | 2 | 2 | 2 |
| Number of averages/excitations/signals acquired | 2 | 5 | 1 | 2 |
| Slice thickness (mm) | 6.5 | 5.0 | 7.0 | 5.0 |
| Slice spacing (mm) | 2.27 | 0.50 | 2.80 | 0.75 |
| Number of slices | 20 | 20 | 20 | 20 |
| Direction of motion probing gradients | Phase, frequency, and slice (3-scan trace) | Phase, frequency, and slice (3-scan trace) | Phase, frequency, and slice (3-scan trace) | Phase, frequency, and slice (3-scan trace) |
| Fat suppression | Yes | Yes | Yes | Yes |
| b-values (s/mm 2 ) | 0, 1000 | 0, 100, 500, 1000 | 0, 1000 | 0, 100, 500, 1000 |
| Acquisition time (min:s) | 00:29 | 03:28 | 00:29 | 03:52 |
The second strategy is used for known or evident lesion characterization and involves a respiration-triggered sequence with 4 b-values (0, 100, 500, and 1000 s/mm 2 ) and narrowly-spaced thin slices, which are optimized for the region of interest. This approach benefits from the detection capabilities of bright- and dark-blood low b-values and enables an acceptable routine ADC calculation without compromising the overall examination time. These strategies are also roughly in accordance with the protocols suggested by other groups. Images can then be postprocessed on general workstation applications to generate fusion maps with anatomic and postcontrast images that resemble those obtained in positron emission tomography (PET) and computed tomography (CT) examinations.
Clinical applications of upper abdominal DWI
Liver
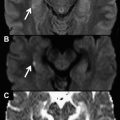
No organ in the abdomen has received more attention in the DWI literature than the liver. Many different applications and clinical settings have been investigated for both focal and diffuse liver lesions. Several publications have reported the usefulness of DWI for liver lesion detection. Most of these focused on the value of low b-value images (50–100 s/mm 2 ) compared with T2-weighted (T2w), fat-suppressed T2w, and postgadolinium T1-weighted (T1w) images. This distinction is because of the black-blood effect inherent in low b-values, which suppresses the background signal of vessels in the liver parenchyma while maintaining the signal intensity of focal lesions ( Fig. 1 ). Moreover, there is reduced blurring with spin echo (SE) echo planar DWI compared with T2w turbo SE or half-Fourier turbo SE (HASTE). Coenegrachts and colleagues showed a higher conspicuity of hemangiomas and metastases with respiratory-triggered low b-value DWI compared with conventional unenhanced MR imaging. Zech and colleagues compared DWI (b-value = 50 s/mm 2 ) with fat-suppressed T2w images, and observed better image quality and a better sensitivity for lesion detection with DWI (83% vs 61%). When Bruegel and colleagues compared respiratory-triggered DWI with 5 different either fat-suppressed T2w or short tau inversion recovery (STIR) sequences for the diagnosis of hepatic metastases at 1.5 T, they found that DWI showed greater accuracy (0.91–0.92 vs 0.47–0.67, respectively), and an even more pronounced advantage compared with T2w images in the examination of metastatic lesions smaller than 1 cm in diameter. The combination of these results, especially when combined with other similar studies already published, has led to the claim that low b-value DWI outperforms both fat-suppressed T2w and STIR in the detection of focal liver lesions ( Figs. 2 and 3 ). Consequently, many centers, including ours, have removed fat-suppressed T2w sequences from their routine protocols to invest extra time in enhancing DWI parameters. However, the left liver lobe is a notoriously weak spot for DWI in the detection of focal lesions because of cardiac motion artifacts ( Fig. 4 ).
Regarding contrast media and DWI, there is evidence to suggest that DWI has a better diagnostic accuracy in the detection of colorectal metastases in conjunction with mangafodipir trisodium (MnDPDP), better performance in association with SPIO in the detection of hepatocellular carcinoma (HCC) compared with SPIO-enhanced MR imaging, and no significant difference in performance on a per lesion basis compared with gadolinium-enhanced T1w. These data support the use of DWI as an alternative to gadolinium chelates, or other contrast media, in patients with severe renal dysfunction or in those at risk for nephrogenic systemic fibrosis.
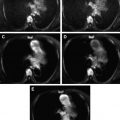
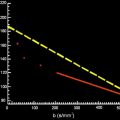
The most straightforward approach for characterizing focal liver lesions relies on visual assessment of high b-value (≥500 s/mm 2 ) images, that may help distinguish between cystic and solid lesions, the latter usually retaining high signal intensity compared with the background liver on increases in the b-values ( Fig. 5 ). A more sophisticated and less subjective approach based on quantitative ADC measurements may also be used to differentiate between benign and malignant lesions, owing to the generally lower ADC values in the latter, probably resulting from greater cellularity ( Fig. 6 ). Although an average ADC cutoff of between 1.4×10 −3 and 1.6×10 −3 mm/s 2 may provide sensitivity as high as 74% to 100% and specificity in the range of 77% to 100% in the distinction between benign and malignant liver lesions, other published ADC values show much wider variation, in the range of 0.94×10 −3 to 2.85×10 −3 mm/s 2 for metastases and 0.69×10 −3 to 2.28×10 −3 mm/s 2 for normal liver parenchyma. Detailed tables that compare the ADC values of different focal liver lesions can be found in the cited references. As noted, there is considerable overlap between the ADC values of solid benign hepatic lesions, such as focal nodular hyperplasia or adenoma, and those of malignant lesions, such as metastases and HCC ( Fig. 7 ). Also, cystic, necrotic, or mucinous components in a malignant lesion may increase ADC values, which can generate false-negatives when DWI data alone are considered ( Fig. 8 ). In contrast, abscesses or inflammatory lesions show low ADC values, because of their inflammatory and viscous contents, potentially generating false-positives. Furthermore, every study group uses their own scanning protocols, with different manufacturers, different field strength scanners, different b-value sets, breath-hold or respiratory-triggered techniques, different ADC calculation algorithms, and different measurement techniques, making it difficult to integrate results across studies and propose a standardized ADC evaluation. Therefore, DWI alone is currently not suitable for stand-alone characterization of focal liver lesions, but it may show better accuracy when used in conjunction with contrast-enhanced and conventional MR imaging sequences.
Related posts:
 Diffusion Magnetic Resonance Imaging in the Head and Neck
 Diffusion MR Imaging in Central Nervous System
 Basic Concepts of MR Imaging, Diffusion MR Imaging, and Diffusion Tensor Imaging
Pelvic Applications of Diffusion Magnetic Resonance Images
Basic Concepts of MR Imaging, Diffusion MR Imaging, and Diffusion Tensor Imaging
Pelvic Applications of Diffusion Magnetic Resonance Images
 Diffusion-Weighted Imaging of the Chest
 Diffusion-Weighted Magnetic Resonance Imaging for the Evaluation of Musculoskeletal Tumors
Stay updated, free articles. Join our Telegram channel

Full access? Get Clinical Tree


