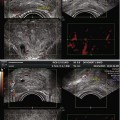
Fig. 6.1
Spectral waveform analysis with pulsed wave Doppler
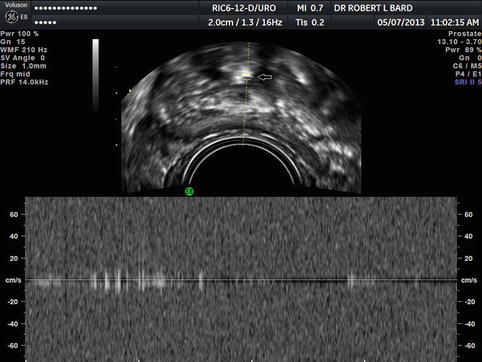
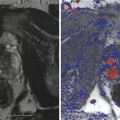
Fig. 6.2
Calculi creating color artifact-absent arterial or venous waveforms
A sweeping angle of 195° (commercial units have sweep angles from 120 to 195°) allows for the greatest visual display permitting pathology not well imaged in one plane to be better depicted in other simultaneous planes.
6.2 Technique of Volume Analysis
The acquisition box of the 3D volume is placed over the power Doppler window. With the patient asked to remain as still as possible, volume acquisition is made during an interval varying from 5 to 20 s. Volume acquisition may be repeated if flash-type artifacts due to patient motion, respiratory, or intestinal movements appear on the screen. VOCAL can be computed on the ultrasound unit touch screen or the volumes stored and evaluated later in a personal computer or dedicated workstation to manipulate the data after the patient has left. With the VOCAL program, the abnormal area is evaluated manually in the transverse or coronal plane. By a rotational technique with a 6°, 9°, 15°, or 30° step, 12–30 slices are obtained to outline a volume. A 9° rotation is commonly used because it has previously been shown to have the best reproducibility for the 3D power Doppler indices (Bard 2013).
An initial volume is obtained, and the sonographer is queried if the data is accurate. If the region of interest is correct, the VOCAL program automatically calculates the three 3D power Doppler indices: Vascular index (VI), flow index (FI), and vascular flow index (VFI). The VI measures the number of color voxels in the volume, representing the vessels in the tissue, and is expressed as a percentage. The FI is the mean color value in the color voxels, indicating the average intensity of blood flow, and is expressed as a number from 0 to 100. The VFI is the mean color value in all the voxels in the volume; therefore, it represents a composite of both the vascularization and the blood flow. It is also expressed as a number from 0 to 100 (Figs. 6.3 and 6.4).
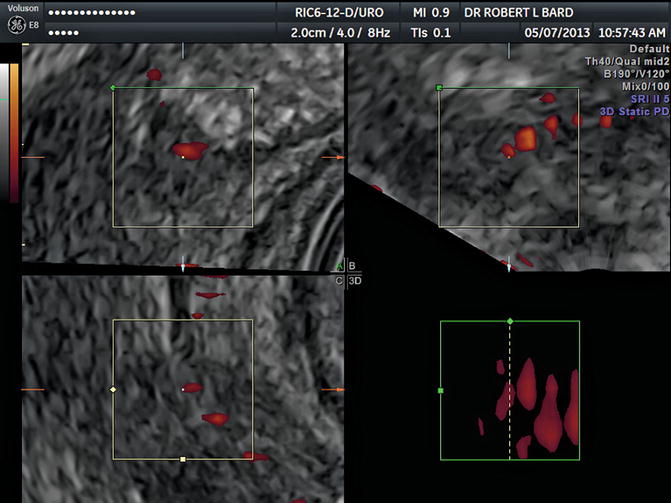
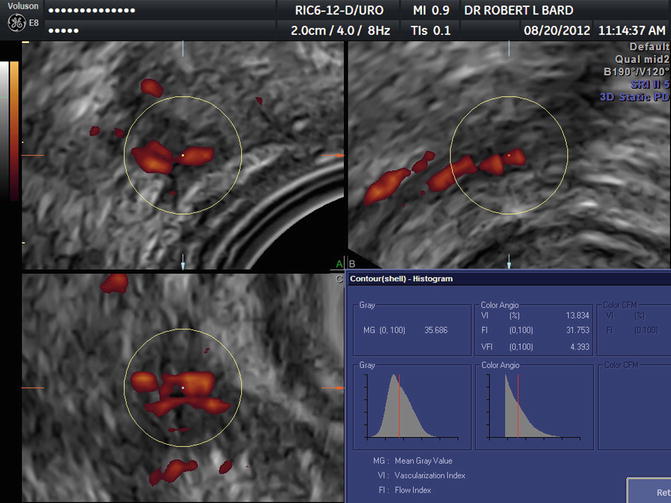
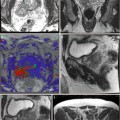
Fig. 6.3
Review of tumor flow region before VOCAL analysis
Fig. 6.4
VOCAL histogram showing VI = 13.8 % indicating high-grade tumor
6.3 Interpretation of Histogram Analysis
Differences between 3D power Doppler indices and the RI according to the tumor stage, the histologic grade, capsular disruption, and lymph node metastases are also evaluated. Histologic grade has been studied with this technology, and the following approximation has proven useful: low-grade tumor (Gleason 3 + 2, 3 + 3) has VI <5 %, medium-grade cancer (Gleason 3 + 4) has VI 5–9 %, and high-grade malignancies (Gleason 4 + 4, 4 + 5, 5 + 5) have VI >9 %. This does not exactly correlate with histologic Gleason grading since this is a current functional measure, while the microscopy is purely anatomical and may not represent current aggressive potential (Figs. 6.5 and 6.6).
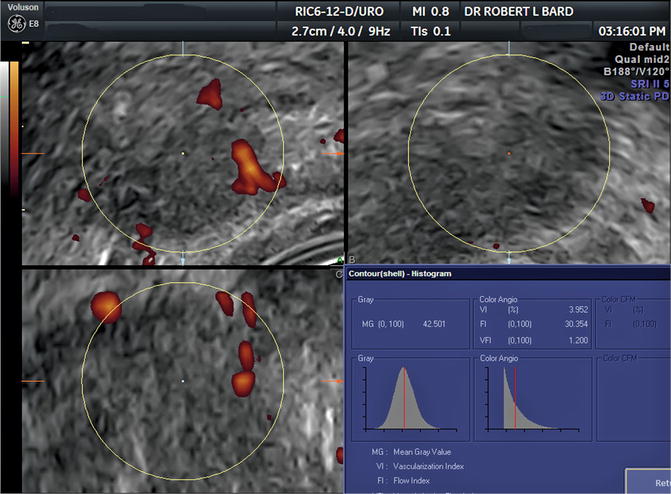
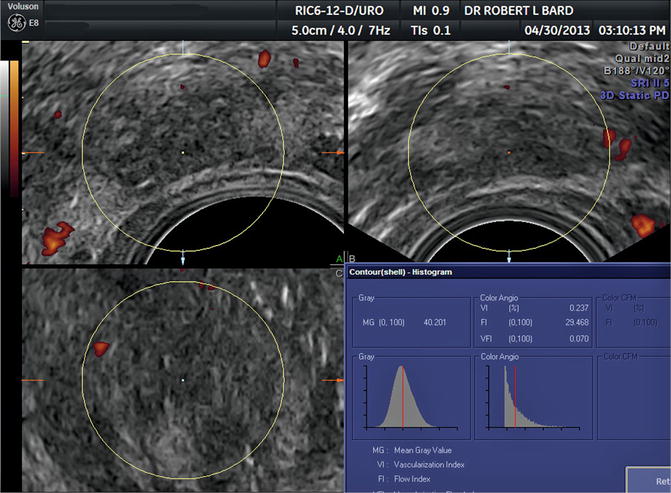
Fig. 6.5
Prostate cancer Gleason 3 + 4 VI = 3.9 %
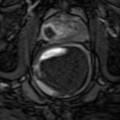
Fig. 6.6
Prostate cancer post-ablation VI = 0.2 %
Studies of the other indices are underway. Increased color Doppler mapping is also significantly associated with cancer. Nevertheless, color Doppler mapping shows some technique limitations that decrease its reliability. The power Doppler technique is based on the Doppler signal amplitude instead of the Doppler frequency. For this reason, it has high sensitivity for depicting blood flow with very low velocities. Moreover, a power Doppler image is independent of the insonation angle and does not show aliasing.
Related posts:

Stay updated, free articles. Join our Telegram channel

Full access? Get Clinical Tree


