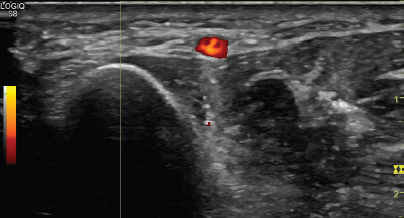
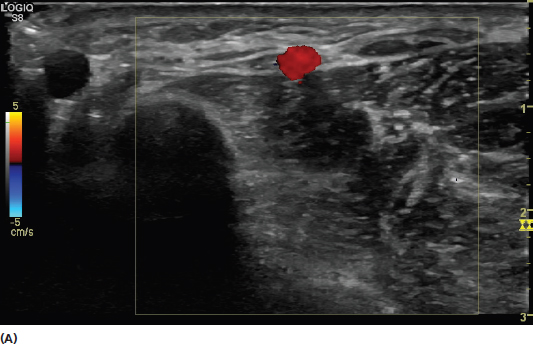
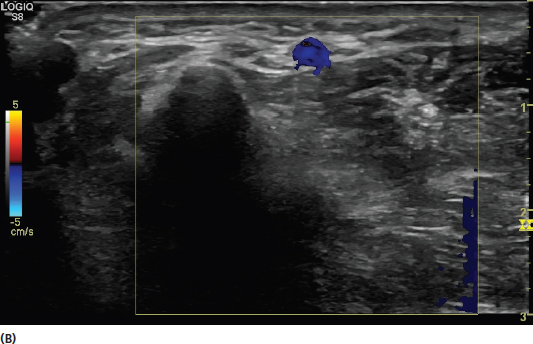
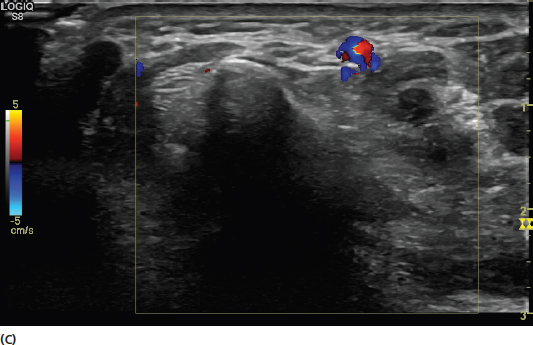
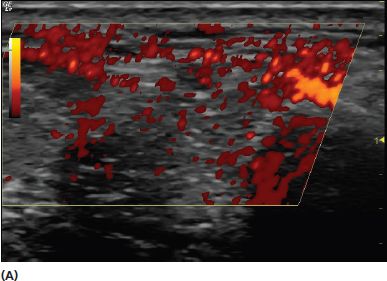
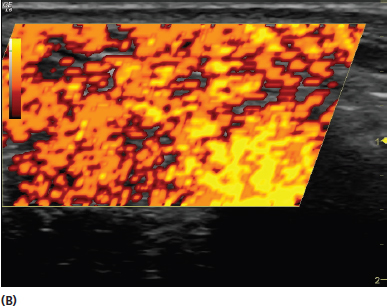
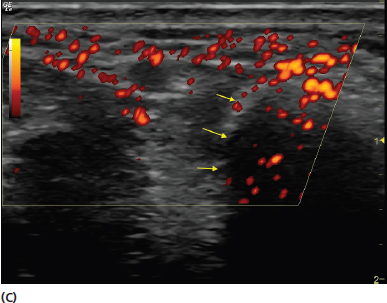
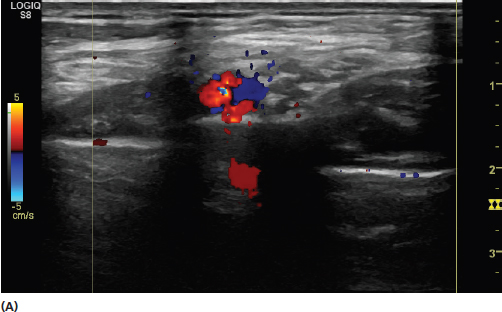
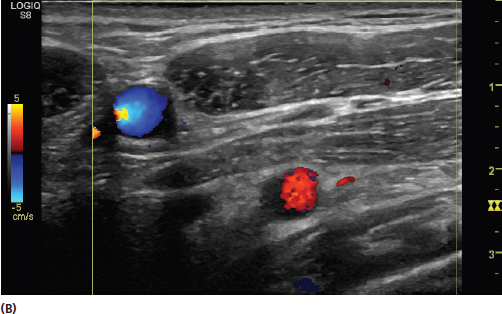
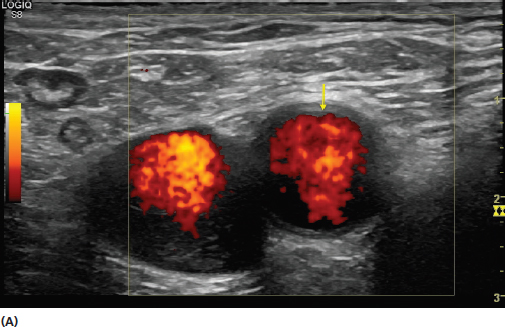
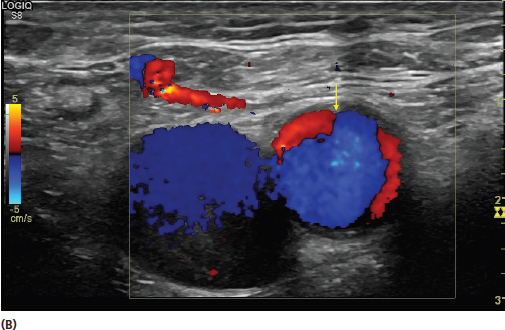
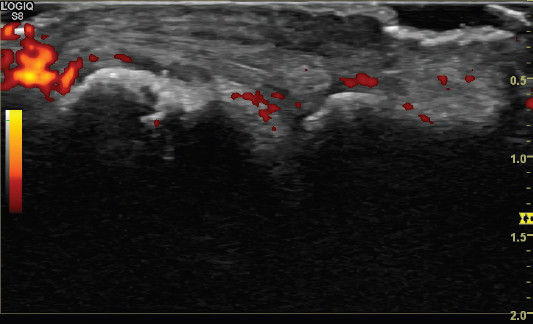
Doppler imaging provides an important complement to the gray scale image in routine B-mode ultrasound. It provides color signal with movement, making it particularly useful for assessing vascular flow. Doppler imaging has a number of applications in musculoskeletal evaluations. It helps to identify certain vascular structures, gives an indication of vascular flow, and can also be used to assess for increased vascularity in pathologic conditions, as well as synovitis in rheumatologic diseases and other inflammatory conditions. It can be additionally used to assess for vascular clots, aneurysms, and anatomic variations. There are two conventional types used in musculoskeletal medicine, power and color Doppler. Power Doppler encodes the power of the ultrasound signal rather than velocity and direction. It is sensitive for movement in any direction. It is a single color and appears red or red-orange (Figure 6.1). FIGURE 6.1 Sonogram demonstrating flow through the radial artery with power Doppler. The power Doppler signal reflects the power of the signal rather than the velocity or direction and is displayed in a single color (red). Color Doppler has both red and blue characteristics and provides information about directional movement. This is useful for determining the direction of vascular flow and is not to be confused with denoting venous or arterial blood. When the movement of the flow is toward the transducer, the Doppler is denoted in red. Blue is seen when the direction is away from the transducer (Figure 6.2). FIGURE 6.2 Sonograms demonstrating flow through the radial artery with color Doppler. The color Doppler signal is displayed in two colors (red and blue). The signal is more dependent on angle of the transducer with color Doppler. The different appearance of the same tissue in images (A)–(C) is related to changes in transducer position. The image in (A) appears similar to the power Doppler image in Figure 6.1. The transducer is oriented so that the flow is toward the transducer creating a red color. The image in (B) appears blue because the transducer is oriented so that the flow is away from the transducer. The image in (C) shows that the flow can have both colors when the transducer is oriented between the positions of (A) and (B). A weakness of color Doppler is that it can potentially miss flow that is perpendicular to the transducer. For this reason, it is useful to toggle the transducer to minimize that potential. Power Doppler signal is not dependent on direction, and it is more sensitive to movement than color Doppler, but its image can also be improved with toggling in some circumstances. A disadvantage of the sensitivity of power Doppler to movement is that it is more likely to create flash artifact when the transducer or patient is moving (Figure 6.3). By contrast, color Doppler is more likely than power Doppler to create artifact when the transducer is stationary. Both power and color Doppler have gain settings that affect their relative sensitivity. When the gain is set excessively high, there is an increase in artifact, even with the transducer and tissue at rest. If the gain is set too low, there is a loss of sensitivity. There remains a lack of standardization regarding appropriate gain settings for Doppler imaging, however, the gain should generally be set on the highest sensitivity that does not create significant artifact (Figure 6.4). One method used to establish the appropriate gain is to raise it initially, then gradually lower it to the point that no flow is seen beneath the cortex of bone. Sound waves do not readily penetrate bone, therefore Doppler flow seen below the cortex of bone should be considered artifact. FIGURE 6.3 Sonograms demonstrating flash artifact with power Doppler due to transducer movement. The Doppler signal in images (A) and (B) is relatively easy to distinguish as artifact in light of the relatively massive extent. A clue that the signal is also artifact in (C) is the Doppler signal that is deep to the radial bony cortex (designated by the yellow arrows). True Doppler changes from vascularity cannot be seen through bone. FIGURE 6.4 Sonograms demonstrating flash artifact with color Doppler. In (A), the gain is set somewhat high with an excessive amount of artifact seen extraneous to the vessel. The gain is set more appropriately in (B). With nonvascular settings, color Doppler is preferable to power Doppler for assessment of high-flow vascular structures such as large arteries (Figure 6.5). Power Doppler is designed for low flow states and is therefore often preferable for smaller or deeper vessels and investigation for inflammation or neovascularization (Figure 6.6). FIGURE 6.5 Sonograms demonstrating the appearance of both power (A) and color (B) Doppler of the femoral artery (yellow arrow). Note that the power Doppler signal does not completely fill the lumen of the artery, whereas the color Doppler signal does. Color Doppler is generally preferred for higher velocity flow states. FIGURE 6.6 Sonogram demonstrating the use of power Doppler to show the effect of synovitis in the area of the metacarpal phalangeal joint in a patient with rheumatoid arthritis. 1) Power Doppler is generally preferable for low flow states and color Doppler is used for higher flow states and assessment of direction. 2) Color Doppler has a two-color scale (red and blue) and assesses flow and direction. Red represents flow toward the transducer and blue represents flow away from the transducer.
Doppler Imaging
POWER DOPPLER
COLOR DOPPLER
COLOR VERSUS POWER DOPPLER
REMEMBER
![]()
Related posts:
Stay updated, free articles. Join our Telegram channel

Full access? Get Clinical Tree


