Introduction
Duplex and color Doppler ultrasound are utilized to evaluate a number of vascular diseases of the kidneys. The location of the renal vessels and the wide variation in the anatomy and physiology of the renal vessels can make the examination challenging and difficult to master. This chapter will provide a thorough review of all aspects of Doppler ultrasound in the assessment of the renal arteries and veins. The anatomy and principles of sonographic examination of the native renal vessels are considered first, followed by a discussion of renal vascular disorders, with special emphasis on renal artery stenosis and occlusion, and the renal vasculature assessment postintervention. Key features in the diagnosis of renal arterial aneurysms, arteriovenous fistulas (AVF), arteriovenous malformations (AVMs), renal vein thrombosis, and renal masses with tumor invasion of the renal veins will also be reviewed.
Anatomy
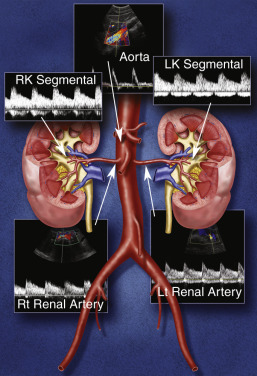
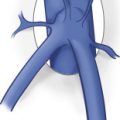
Each kidney receives its arterial supply from one or more renal arteries. The renal arteries arise from the proximal abdominal aorta just below the origin of the superior mesenteric artery, which serves as a reference point ( Fig. 28.1 ). The right renal artery arises anterolaterally from the aorta and passes posterior to the inferior vena cava (IVC). It is the only major vessel that courses posteriorly to the IVC. The left renal artery generally arises from the lateral or posterolateral aspect of the aorta. Anterior to each renal artery runs a corresponding renal vein, and both vessels course anterior to the renal pelvis before entering the medial aspect of the renal hilum ( Fig. 28.2 ). The left renal vein lies between the superior mesenteric artery and the aorta (as opposed to the splenic vein, which lies anterior to the superior mesenteric artery). The most common and most significant anatomic variants of the renal venous system are a circumaortic left renal vein, when one of the limbs of the left renal vein courses anterior to the aorta and another runs posterior to it; and a retroaortic left renal vein, when the left main renal vein lies posterior to the aorta. No other vessels course behind the aorta, and when a vascular structure is seen behind the aorta, a renal vein anomaly should be considered ( Fig. 28.3 ).


The right kidney is relatively inferior to the left kidney, which explains the downward course of the right renal artery, traversing posterior to the IVC and right renal vein. The left renal artery arises below the level of the right renal artery origin and is more horizontally oriented. It has a direct upward course to the more superiorly positioned left kidney ( Fig. 28.4 ). Each kidney is supplied by a single renal artery in only 70% of the population, with the remaining 30% supplied by multiple vessels. The three most common anatomic variations of the renal arterial circulation are: duplicated main renal arteries, accessory renal arteries, and polar renal arteries. On average, the main renal arteries measure approximately 4.6 mm in anteroposterior (AP) diameter. When more than one renal artery is present, the diameter of the renal arteries is variable, although they are generally smaller than when there is a single main renal artery. Duplicated renal arteries are defined as arteries that arise from the aorta, course toward the renal hilum, and supply similar proportions of the renal parenchyma ( Fig. 28.5 ). Accessory renal arteries also travel to the renal hilum but may arise from the aorta or the iliac arteries and supply smaller distinct segments of the renal parenchyma. Polar renal arteries do not enter the renal hilum but rather course directly to the cortex of one of the renal poles, and similar to accessory renal arteries, they may originate either from the aorta or iliac arteries. Both accessory and polar renal arteries commonly go unrecognized on ultrasound, but even duplicated main renal arteries may be overlooked sonographically. Rarely, renal arteries may arise from the superior mesenteric, inferior mesenteric, celiac, middle colic, or sacral arteries.


The main renal artery usually divides into five segmental arterial branches at the level of the renal hilum: the posterior, apical, upper, middle, and lower segmental renal arteries that feed the corresponding segments. The segmental arteries then course through the renal sinus and divide into the interlobar arteries, which are within the renal parenchyma and in close proximity to the collecting system. The interlobar arteries divide into the arcuate arteries, which course around the medullary pyramids and lead to the interlobular arteries ( Fig. 28.6 ). The interlobular arteries give rise to the afferent arterioles, which feed each glomerulus. Blood flows from the glomerulus to the efferent arterioles followed by the vasa recta, which provides the network for venous drainage of the kidney.

Venous drainage follows the same branching pattern as the arteries. However, unlike the arterial system, multiple communications exist between the renal segments within the venous system.
The normal peak systolic velocity (PSV) in the renal arteries ranges from 74 to 127 cm/s in both adults and children. Children tend to have slightly higher velocities than adults. The kidneys are end organs that require continuous forward flow throughout both systole and diastole, therefore the renal arteries demonstrate a low-resistance waveform pattern with a rapid systolic upstroke and persistent forward flow in diastole ( Fig. 28.7 ). An early systolic compliance peak or notch may be seen in some patients.

Principles of Examination
Doppler ultrasound evaluation of the renal arteries is one of the more challenging examinations to perform, given the small size of the renal vessels, their depth, and variable anatomy. The examiner is required to have an understanding of the renal anatomy, normal waveform physiology, and image optimization techniques. With time and experience, however, sonographers become adept at this study and are able to perform the examination in a reasonable period of time. Literature reports indicate that as many as 95% of main renal arteries can be adequately examined in adult patients. The key to the renal Doppler examination is accurate demonstration of the vascular anatomy.
There are a number of other imaging modalities that evaluate the renal vessels, each of which has strengths and weaknesses. Catheter angiography is considered the gold standard examination for this type of evaluation but is limited by its invasive nature and the fact that it exposes patients to iodinated contrast material and radiation. Pressure measurements between different segments of the renal arteries may be obtained only with catheter arteriography. Multidetector computed tomographic angiography (CTA) and contrast-enhanced magnetic resonance angiography (MRA) are less invasive alternatives to angiography, and both techniques have proven valuable in the demonstration of renal vascular disease . CTA offers higher resolution than MRA but also requires iodinated contrast material and is contraindicated in patients with low glomerular filtration rate (GFR) and residual renal function. CTA also exposes patients to ionizing radiation. MRA usually requires intravenous contrast material (gadolinium-based agents), which may be contraindicated in patients with renal failure, and is an expensive and time-consuming examination. MRA cannot be performed on claustrophobic patients or on patients with certain types of metallic implants. Generally, CTA and MRA provide superb anatomic information, but are limited in their ability to assess overall renal function. They also have limited utility in those patients who have undergone revascularization with stent placement.
Doppler sonography has significant benefits when compared with these other imaging modalities; it is an inexpensive and noninvasive method for evaluation of the renal vasculature and does not require contrast material. The Doppler examination is superior to other modalities because it not only provides anatomic information but also allows evaluation of physiologic factors. These physiologic changes can determine the hemodynamic significance of a renal vascular lesion and can assess the need for intervention. Doppler examination is often able to clarify uncertain or indeterminate CT or MR imaging (MRI) diagnoses.
There are several key elements to a successful abdominal Doppler examination. Adequate patient preparation is important to reduce the amount of bowel gas, which produces scatter and attenuates the ultrasound beam. We recommend a 12-hour fast before the examination. We prefer to schedule our renal Doppler studies first thing in the morning, before patients have breakfast, to improve visualization of vascular structures. We do not give any medication prior to performing the study. The examination is performed on a modern ultrasound unit, offering high-resolution gray-scale imaging, and sensitive color, power, and pulsed Doppler imaging. We routinely utilize harmonic imaging during our investigations to improve resolution and decrease artifacts . The technical success of each study is also influenced by the degree of operator experience, and we have had tremendous success by training sonographers in the techniques required to perform complete renal Doppler studies in a timely manner. The best examiners share several characteristics: motivation, patience, and a commitment to success. The learning curve is variable and often requires between several months and a year of experience, depending on the volume of cases performed.
Technique
The study is performed using 2- to 5-MHz curved array transducers, which provide the depth of penetration needed to visualize the abdominal aorta and its major branches: celiac, mesenteric, and renal arteries. Color Doppler flow imaging is an integral component of renal artery ultrasound examination and is useful for demonstrating patency of renal arteries and detecting flow disturbances that indicate stenosis. However, when used alone, this modality may give a false impression of renal artery stenosis because atherosclerotic plaques can cause flow disturbances in vessels that are not significantly stenotic. A low pulse repetition frequency (PRF) setting may also produce an aliased color flow signal in an area of normal velocity. Pulsed (spectral) Doppler analysis must be used in conjunction with color flow imaging, as it provides quantitative information through the measurement of blood flow velocities in the renal vessels.
There are a number of technical shortcuts that increase the likelihood of identifying the renal arteries in their entirety and decreasing the time of the examination. The first step is to optimize the gray-scale and color Doppler parameters to improve renal artery visualization as well as the conspicuity of flow-reducing lesions. Adjustment of the color Doppler parameters, including color gain, PRF (color velocity scale), and wall filter, is performed in areas of laminar flow within either the aorta or a normal segment of a renal artery. These adjustments in areas of normal blood flow allow the examiner to “screen” a vessel quickly for stenosis because elevated velocities in stenotic regions produce a color aliasing artifact that is readily apparent. The examiner can then place the Doppler sample volume at the site of blood flow disturbance to determine the highest PSV.
In addition to optimizing the color Doppler parameters, the experienced sonographer utilizes all available acoustic windows to obtain velocity information from the renal arteries. The renal arteries can be visualized from an anterior abdominal approach in the supine position through the abdominal wall ( Fig. 28.8A ), in a decubitus position through the liver, spleen, and either kidney, and prone position with a posterior (translumbar) approach through the patient’s back (see Fig. 28.8B ). The anterior abdominal approach is useful for evaluating the renal ostia, providing optimal orientation of the renal vessels to facilitate accurate sampling with spectral Doppler (see Fig. 28.8C and D ). A common limitation of this approach is the presence of overlying bowel gas that limits visualization of the renal arteries. This may be overcome by continuous gradual application of transducer pressure that displaces the gas-containing bowel loops away from the vessels of interest. When the anterior abdominal approach is not feasible because of persistent artifacts and attenuation from bowel gas or obesity, other alternative acoustic windows are utilized. In particular, the deep abdominal vessels are frequently seen in the decubitus and prone positions, using the liver and kidneys as acoustic windows to visualize the renal arteries. These windows allow sonographers to obtain all the necessary color flow views and spectral Doppler samples from the renal arteries in a timely manner. Another method of identifying the main renal arteries, particularly their ostia, has been termed the “banana peel” view. This view is obtained by turning the patient to the opposite decubitus position from the vessel being examined, maintaining longitudinal orientation of the transducer. Once the aorta is located, visualization of the origins of the main renal arteries is achieved by moving the transducer in an anterior-to-posterior direction ( Fig. 28.9 ).


The spectral Doppler examination is performed with a small sample volume so as to obtain flow information from only the vessel of interest and minimize contamination from adjacent vessels. Doppler sampling is performed with angles of 60 degrees or less, as angles of greater than 60 degrees will spuriously increase PSV measurements. As with all Doppler studies requiring angle correction, interrogation at a constant angle allows for reproducibility of PSVs between follow-up studies and maintains a similar range of error in PSV measurements. The spectral Doppler PRF is adjusted so that the waveforms are large and easy to interpret without producing aliasing.
- •
The normal PSV in the renal arteries ranges from 74 to 127 cm/s in both adults and children.
- •
Doppler examination demonstrates physiologic changes that can determine the hemodynamic significance of vascular lesions and clarify indeterminate CTA and MRA findings.
- •
Key technical shortcuts to improve visualization of renal arteries include:
- •
normalizing the color gain, PRF (color velocity scale), and wall filter to areas of laminar flow
- •
utilizing all available acoustic windows, including the anterior abdominal approach, decubitus position through the liver, spleen, and kidneys, and prone position with a posterior (translumbar) approach through the patient’s back
- •
performing spectral Doppler examination with a small sample volume, obtaining flow information from only the vessel of interest at 60 degrees or less
- •
Protocol
Our protocol for the renal artery Doppler examination includes not only the evaluation of the renal vasculature but also an examination of the kidneys. Generally, kidney size is an important factor in the decision-making process for consideration of revascularization. The normal adult kidney usually measures greater than 8 cm in longitudinal size, with an average length of 10 to 12 cm. The kidneys are generally symmetric in size with a normal allowable variation in size of 2 cm between the contralateral sides. The kidneys are best examined with the patient in a decubitus position, with the left decubitus utilized for assessment of the right kidney and the right decubitus position used for assessment of the left kidney. In addition to kidney length, we note renal parenchymal echogenicity and thickness. The kidneys are assessed for atrophy, scarring, hydronephrosis, calculi, and masses. Incidental discovery of occult renal cell carcinomas is not uncommon in our practice, with several cases diagnosed each year during routine renal Doppler examinations.
Once the renal examination is complete, we perform a survey of the abdominal aorta from the celiac artery to the iliac bifurcation and evaluate for atherosclerotic plaque. This is done with both gray-scale and color flow Doppler examination of the abdominal aorta in a longitudinal plane. Gray-scale evaluation is important to assess for irregular plaque and ostial lesions (i.e., at the origin of the aortic branches), which may be obscured by color flow blooming. ( Color flow blooming artifact refers to the tendency of the color flow Doppler signal to extend beyond the vascular lumen, obscuring adjacent structures, including atherosclerotic plaque and the vessel wall.)
The presence of significant aortic plaque should increase suspicion for ostial renal artery disease, particularly in older adults and diabetic patients. Conversely, the absence of plaque in the aorta decreases the likelihood of atherosclerotic renal artery stenosis. We also look for flow abnormalities at the origins of the celiac and superior mesenteric arteries, findings that may correlate with significant stenosis. The size and location of abdominal aortic aneurysms are noted, and their relationship to the renal arteries is reported. Finally, angle-corrected PSV measurements are obtained in the abdominal aorta at the level of the renal arteries. These aortic velocity measurements are used to determine the renal artery to aorta velocity ratio (RAR), which will be discussed later.
After the survey of the abdominal aorta, we direct our attention to the renal arteries. Our protocol includes the direct examination of both main renal arteries and sampling of the segmental branches in both renal hila. When possible, we locate the origins of the renal arteries on transverse images of the aorta using an anterior transducer approach. The celiac and superior mesenteric arteries serve as landmarks for localization of the renal artery ostia. Once the mesenteric arteries are located, the transducer is moved inferiorly along the aorta until the origin of each renal artery is seen. The right renal artery is often easier to identify than the left with this approach and is relatively easy to follow to the renal hilum (see Fig. 28.2A ). The left renal artery is harder to follow all the way to the kidney from an anterior approach, and may be better seen by positioning the patient in a right lateral decubitus position and scanning from a left posterolateral transducer approach. The left kidney can be used as an acoustic window (see Fig. 28.4 ). An analogous approach can be utilized to visualize the distal right renal artery and its branches, with the patient in a left lateral decubitus position and using the liver as an acoustic window. In children, both renal arteries can sometimes be viewed simultaneously from a coronal approach through the left kidney. Transverse and sagittal sweeps of the abdominal aorta and kidneys are performed to identify variants in renal artery anatomy. As mentioned earlier, these variants may arise from the inferior aorta or iliac arteries and can be followed to the renal hilum or either pole of the kidney (see Fig. 28.5 ).
Each renal artery should be examined with color flow imaging from its point of origin to the hilum of the kidney, with the main hilar branches included in the assessment. Look for areas of high-velocity flow, indicated by color shifts or aliasing and turbulence-related flow disturbances, as these may be related to underlying stenosis ( Fig. 28.10 ). If areas of abnormal flow are identified, they should be interrogated with spectral Doppler, and corresponding PSVs should be recorded. Our renal Doppler protocol includes PSV measurements obtained from the origin, proximal, mid, and distal segments of each renal artery. Please note that this is similar to the Native Renal Artery Duplex Practice Parameter developed in conjunction with the American Institute of Ultrasound in Medicine, American College of Radiology, Society of Radiologists in Ultrasound, and Society of Pediatric Radiology that recommends Doppler insonation of the origin/proximal, mid, and distal/hilum segments. We obtain at least four PSV measurements from each renal artery to maximize detection of renal artery stenosis and improve visualization of blood flow changes that infer the presence of flow-limiting lesions. To minimize errors when measuring PSVs, a small sample volume (1.5 to 2.0 mm) should be placed in the center of the arterial lumen and at an angle insonation of 60 degrees or less. Finally, Doppler waveforms are also obtained from the segmental arteries in the upper, mid, and lower poles of each kidney. Thus at least seven waveforms are captured from each side.

It is important to obtain clean, crisp waveforms with well-defined borders for analysis, which can be accomplished by adjusting the spectral display so that the waveforms are large and easily measured. This allows the examiner to readily determine the PSVs throughout the renal arteries and their branches, and accurately determine acceleration time, acceleration index, and the resistivity index (RI) in the segmental renal arteries. Fast sweep speed and velocity scale optimization are helpful to improve waveform interpretation. Angle correction is required for segmental artery duplex evaluation when acceleration index measurements are used for assessment of stenosis. The RI can be calculated by subtracting the end-diastolic velocity from the PSV and dividing that number by the PSV. We have not found RI analysis to be valuable in the evaluation for renal artery stenosis as the RI may be elevated in numerous conditions, including parenchymal renal disease, acute tubular necrosis, pyelonephritis, renal vein thrombosis, and urinary tract obstruction.
Our philosophy when performing a renal artery duplex ultrasound examination is quite pragmatic. We limit the amount of time allotted for our renal Doppler studies. In our experience, a complete renal artery Doppler examination can be performed in as little as 20 minutes, and we never exceed 60 minutes. Experienced examiners can assess a patient quickly and determine if the study can be completed in a timely manner. Studies on difficult patients who cannot cooperate or who are not “sonogenic” are aborted promptly, and an alternative study is recommended for further evaluation. Although considered an “off-label” application by the Food and Drug Administration at this time, ultrasound contrast agents may facilitate visualization of the renal arteries and “rescue” difficult examinations (see Chapter 35 ). It is also important to recognize that atherosclerotic renal artery disease is far and away the most common etiology of significant renal artery stenosis, and these lesions occur at the origin and proximal segments of the renal artery. We pay close attention to these segments in our older adult patients who are apt to have atherosclerotic obstructive lesions. It is more important to visualize the entire renal artery in younger adults as these patients are more likely to have fibromuscular dysplasia (FMD), which can affect the mid and distal renal artery or the segmental branches.
As mentioned earlier, ultrasound contrast (echo-enhancing) agents allow for increased visibility of blood vessels and improved visualization of renal arterial blood flow patterns. Ultrasound contrast may be particularly helpful in visualizing the renal arteries in obese patients. In addition to reducing examination time, the use of these agents may enhance ultrasound visualization of multiple renal arteries and hilar branches.
- •
The renal artery Doppler protocol includes:
- •
evaluation for renal size, scarring, atrophy, stones, hydronephrosis and masses
- •
examination of the abdominal aorta for plaque, aneurysm or dissection
- •
direct examination of the renal arteries, including PSV measurements at the origin, proximal, mid, and distal segments of each artery, including duplicated arteries
- •
indirect examination of the segmental arteries, including assessment of waveforms obtained from the upper, mid, and lower poles of each kidney
- •
- •
The presence of significant aortic plaque should increase suspicion for proximal renal artery disease, particularly in older adults and diabetic patients.
- •
Look for areas of high-velocity blood flow, indicated by color shifts or aliasing, and turbulence-related flow disturbances, to identify underlying stenosis.
- •
Atherosclerotic renal artery disease is the most common etiology of significant renal artery stenosis, and these lesions occur at the origin and proximal segments of the renal artery.
- •
Fibromuscular dysplasia is more common in younger adults and involves the mid and distal renal artery or the segmental branches.
- •
Ultrasound contrast (echo-enhancing) agents allow for increased visibility of blood vessels and improved visualization of renal arterial flow and is currently used “off-label” in the United States for renal Doppler studies.
Vascular Disorders
There are a variety of disorders that affect the renal vasculature. These conditions may result in damage to the renal parenchyma, renal failure, and/or hypertension. The most common vascular conditions affecting the renal arteries are renal artery stenosis (due to atherosclerosis or FMD), renal artery occlusion, and renal artery aneurysm. Renal vein thrombosis can be seen with hypercoagulable states, malignancy (tumor thrombus), or with propagation of clot from the IVC. Other renal vascular pathologies include AVF, dissection, vasculitis, and pseudoaneurysm formation.
Renal artery stenosis
Renal artery stenosis may result from a diverse group of conditions, including atherosclerosis, FMD, vasculitis, neurofibromatosis, congenital bands, extrinsic compression, and radiation. Atherosclerosis accounts for approximately 90% of lesions that obstruct blood flow to the renal arteries. Atherosclerotic renal artery stenosis typically involves the ostium and/or proximal segment of the main renal artery and the adjacent aorta. FMD accounts for less than 10% of renal vascular lesions, representing a noninflammatory and nonatherosclerotic vascular disease that affects renal, carotid, vertebral, iliac, and, less commonly, mesenteric arteries. FMD is usually found in patients younger than 40 years of age and affects the mid and distal segments of the renal arteries. Both atherosclerotic and FMD-related lesions gradually progress over time. These progressive stenotic lesions eventually lead to renal hypoperfusion, which in turn leads to impairment of renal function, renal atrophy, and ischemic nephropathy. Renovascular disease caused by renal artery stenosis is a leading cause of renal failure and end-stage renal disease in the elderly, accounting for approximately 15% of patients entering hemodialysis programs. Studies suggest that ischemic nephropathy may be responsible for 5% to 22% of advanced renal disease in all patients older than 50 years of age. In addition to development of end-stage renal disease, patients with renovascular disease also develop hypertension, which is triggered by a complex set of pressor signals, including activation of the renin-angiotensin system, recruitment of oxidative stress pathways, and sympathoadrenergic activation.
The threshold level of renal artery stenosis that produces hypertension or ischemic damage is uncertain, and likely varies among patients. It is estimated that 10% to 30% of the US adult population has hypertension, and 3% to 5% of this group has renal arterial disease. In the last decade, clinical interest has focused on the role of renal ischemia in the etiology of chronic renal insufficiency and renovascular hypertension, and the search for a potential cure or a way to prevent the development of chronic renal dysfunction. Although renal artery disease represents the most common correctable cause of hypertension, the topic of renovascularization (restoration of renal perfusion via either vascular stenting or angioplasty) for treatment of atherosclerotic renovascular disease has become increasingly controversial. The CORAL (Cardiovascular Outcomes in Renal Atherosclerotic Lesions) study found that renal artery stenting did not confer a significant benefit for patients with renal artery stenosis and hypertension, or chronic kidney disease. Despite this controversy, renovascularization is still performed by many institutions, and the number of requests to perform renal duplex examination is increasing. Does this mean, however, that we should seek to diagnose renal artery disease in every patient with hypertension or renal insufficiency? To do so could be expensive and not cost-effective. Furthermore, intervention for renal artery disease may be risky (e.g., arterial occlusion or rupture) and is not always successful. Considering these points, we believe that evaluation for renal artery stenosis and possible revascularization should be performed in the following groups of patients: (1) young patients with severe hypertension; (2) patients with abrupt onset of hypertension, rapidly accelerating hypertension, or malignant hypertension; (3) patients with refractory hypertension that is difficult to control despite a suitable treatment program; (4) patients with concomitant hypertension and deteriorating renal function; (5) patients with renal insufficiency and discrepant kidney size (implying renal artery stenosis); (6) patients with recurrent flash pulmonary edema; or (7) patients with diagnosed FMD.
| Candidates for Renal Artery Evaluation |
|---|
| Young patients with severe hypertension |
| Patients with abrupt onset of hypertension, rapidly accelerating hypertension, or malignant hypertension |
| Patients with refractory hypertension that is difficult to control despite a suitable treatment program |
| Patients with concomitant hypertension and deteriorating renal function |
| Patients with renal insufficiency and discrepant kidney size (implying renal artery stenosis) |
| Patients with recurrent flash pulmonary edema |
| Patients with diagnosed fibromuscular dysplasia |
Doppler evaluation of the renal arteries
As noted previously, color flow imaging is used to identify blood flow abnormalities that may be stenosis-related, but spectral Doppler measurements provide quantitative data that are essential for determining the severity of stenosis. The following general comments about the Doppler-based diagnosis of renal artery stenosis are noteworthy:
- 1.
The principal Doppler ultrasound criterion for renal artery stenosis is elevated blood flow velocity within a stenotic segment of the vessel. a
a References .
Flow velocity is increased proportional to the degree of luminal narrowing; therefore spectral Doppler measurements can be used to approximate the severity of a stenosis. Narrowed vascular segments detected with color flow imaging must be carefully surveyed with the Doppler sample volume to ensure that the site of maximum blood flow velocity is identified ( Fig. 28.11 ).

FIG. 28.11
Renal artery stenosis. (A) Color Doppler image shows segmental narrowing of the right renal artery with color aliasing in the stenotic region ( arrow ). (B) Elevated peak systolic velocities ( PS ) measuring 305 cm/s are present in the stenosis. (C) Spectral Doppler sample through the mid abdominal aorta demonstrates a peak systolic velocity of 71 cm/s. (D). Magnetic resonance angiography confirms high-grade stenosis of the proximal right renal artery ( arrow ). AO , Aorta; RRA PR , right renal artery proximal; RRV , right renal vein.


- 2.
Proper assignment of the Doppler angle is essential for reliable measurement of stenosis-related velocity elevation. A Doppler-to-vessel angle of 60 degrees or less is mandatory to ensure that velocity information is accurate.
- 3.
A significant stenosis is accompanied by poststenotic flow disturbance (turbulence) ( Fig. 28.12 ). Although disturbed flow is a useful beacon for the presence of stenosis, it is neither quantitative nor specific. Disturbed flow may occur without significant stenosis and may be related to lesser degrees of narrowing or vessel tortuosity. The presence of color bruit artifacts, on the other hand, usually indicates a significant flow abnormality. Identification of ragged or “picket fence” waveforms with spectral broadening and bidirectional flow just distal to the stenotic area is also indicative of significant stenosis ( Fig. 28.13 ).

FIG. 28.12
Poststenotic turbulence with “shaggy waveforms.” Spectral Doppler waveforms have a ragged or “picket fence” appearance with spectral broadening. Aliasing and color bruit artifact are also noted at the site of stenosis on color Doppler ( arrow ). Note elevated peak systolic velocities greater than 300 cm/s. RRA PR , Right renal artery proximal.

FIG. 28.13
Signs of renal artery stenosis. (A) Color Doppler image shows aliasing at the origins of the right and left main renal arteries ( arrows in A). (B) Spectral Doppler reveals peak systolic velocity greater than 300 cm/s in the stenosis. Note the spectral bruit artifact near the baseline in systole ( arrows in B). (C) Waveforms obtained downstream to the stenosis reveal bidirectional, irregular flow consistent with poststenotic turbulence. PR , Proximal; RRA , right renal artery.


- 4.
Arterial waveforms within the segmental or interlobar arteries of the kidney may be scrutinized for evidence of damping, which is a downstream manifestation of significant renal artery stenosis. The most important downstream findings are the absence of an early systolic peak (ESP), a prolonged systolic acceleration time, and a reduced acceleration index (tardus-parvus waveform).
- •
Color flow and pulsed Doppler are both required to optimize detection of significant renal artery stenosis.
- •
Color flow identifies the flow disturbance for pulsed Doppler interrogation.
- •
Spectral analysis of the PSV in the stenosis allows determination of the severity of the stenosis.
- •
A significant stenosis is accompanied by poststenotic flow turbulence, typically seen as ragged or “picket fence” waveforms with a bidirectional pattern.
Diagnostic criteria
As mentioned earlier, normal blood flow in the renal artery and its branches demonstrates a low-resistance pattern with a rapid peak to systole and forward flow throughout diastole. The PSV in normal renal arteries ranges from 74 to 127 cm/s in adults and is slightly higher in children and young adults. Numerous Doppler velocity criteria have been proposed to diagnose hemodynamically significant renal artery stenosis. From a hemodynamic perspective, renal artery obstruction is considered hemodynamically significant (or flow reducing) when the luminal diameter is narrowed by 50% to 60%. a
a References .
The most universally accepted Doppler criteria are (1) PSV in the stenotic segment of 180 to 200 cm/s or greater and (2) a renal artery to aortic ratio (RAR) exceeding 3.3 or 3.5 ( Table 28.1 ). The latter is the ratio of PSV in the stenotic portion of the renal artery divided by PSV in the aorta at the renal artery level ( Fig. 28.14A and B ). Some authors have found PSV measurements, used alone, to be more accurate than the RAR. In theory, the RAR compensates for hemodynamic variability between patients. Younger patients may have PSV in the aorta and renal arteries that exceeds 180 cm/s without stenosis. Older adult patients, particularly patients with severe cardiac disease and poor cardiac output, may demonstrate low PSVs even in regions of stenosis.
| Direct examination of the main renal artery |
|
| Indirect examination of the segmental branches |
|

Damping of the intrarenal arterial waveform (tardus-parvus waveform) is another valuable criterion for the diagnosis of renal artery stenosis (see Fig. 28.14C ). Damping is defined numerically with the acceleration index or the acceleration time. Both of these measures reflect the rate of systolic acceleration, which is slower than normal downstream from a hemodynamically significant stenosis. An acceleration index less than 300 cm/s 2 or an acceleration time exceeding 0.07 s is considered abnormal and suggests a 60% or greater renal artery stenosis. Some authors use an acceleration time of 0.10 or 0.12 seconds as the cutoff for significant stenosis, which increases specificity.
Intrarenal waveform assessment
An ideal survey method for renal artery stenosis would be one that is accurate, quick, and easy to perform. This is the appeal of the indirect diagnosis of renal artery stenosis through the detection of damped Doppler waveforms in segmental or interlobar arteries within the kidney. For an experienced sonographer, the acquisition of intrarenal arterial Doppler signals is relatively easy, and therefore the examination is brief and successful in most individuals.
It has long been recognized that renal artery stenosis can cause pulsus tardus and parvus (tardus-parvus) changes in intrarenal arterial flow signals (see Fig. 28.14C ). It would be very convenient to simply look for these flow changes in the kidneys and thereby diagnose renal artery stenosis without the arduous task of finding and directly evaluating the renal arteries. Unfortunately, the accuracy of this diagnostic method is questionable. Several literature reports (on the basis of acceleration time, acceleration index, and waveform shape changes) were promising, with sensitivities ranging from 89% to 95% and specificities ranging from 83% to 97% for main renal artery stenoses exceeding 60% or 70% diameter reduction. But other literature, on the basis of the same Doppler parameters, indicated poor results ranging from moderate accuracy to complete absence of correlation between Doppler and angiographic findings.
So, what is the role of intrarenal Doppler assessment? To begin with, it appears that intrarenal waveform findings are more accurate for high-grade renal artery stenoses exceeding 70% diameter reduction, but even at high levels of stenosis, some patients do not have appreciable waveform damping. This is because the shape of intrarenal arterial waveforms is affected by multiple factors, including the stiffness (compliance) of the arteries, the resistance of the microcirculation, and inflow phenomena such as renal artery stenosis. In a patient with generalized arterial stiffness and/or high resistance in the microvasculature from parenchymal renal disease (e.g., diabetes-related nephropathy), the damping effects of a main renal artery stenosis may be obliterated ( Fig. 28.15 ). To make matters worse, damped intrarenal waveforms can occasionally be seen in the absence of significant renal artery stenosis in patients with aortic stenosis or aortic occlusion.


Accurate waveform analysis requires adequate placement of the sample volume in the segmental artery branch. Sample volume size should be 3 mm or less and located in the center of the lumen of the vessel. Waveforms obtained with sample volumes that are too large or not adequately located may appear abnormal and suggest proximal disease. We recommend that multiple tracings be obtained from a vessel with suspected tardus-parvus waveforms to confirm the abnormality. A normal waveform can appear abnormal because of poor technique, but an abnormal waveform cannot be normalized.
Because intrarenal Doppler waveform analysis has not been consistently accurate, we do not recommend the exclusive use of hilar waveform analysis for the diagnosis of renal artery stenosis. However, this is not meant to suggest that intra-arterial waveform findings should be ignored. We always evaluate acceleration and waveform shape in the intrarenal arteries in conjunction with direct renal artery interrogation. The detection of abnormal waveforms confirms the hemodynamic significance of a main renal artery stenosis. Furthermore, damped intrarenal arterial signals may indicate occult stenosis of the main renal artery, a duplicated renal artery, or a segmental artery. This is a particularly important finding when the direct examination of the main renal arteries is technically limited.
It has been suggested that the downstream effects of renal artery stenosis can be diagnosed merely by visual inspection of the shape of the segmental or interlobar Doppler waveforms. The initial systolic peak is either absent or grossly rounded in patients with severe ipsilateral stenosis, as illustrated in Fig. 28.14 . We recommend comparing intrarenal waveforms from both kidneys to assess the difference in systolic upstroke. Subtle changes may be noted, indicating underlying stenosis.
Loss of the early systolic peak (ESP) is associated with significant renal artery stenosis. The ESP is recognized as the initial acceleration phase in systole that is followed by a short acceleration phase and a second systolic peak. Unfortunately, the ESP is not seen consistently in all patients. In our practice, some of the interpreting physicians choose visual inspection rather than measurement of the acceleration index or acceleration time for intrarenal waveform analysis.
Doppler assessment of the renal arteries is also valuable following revascularization with angioplasty, bypass, or stent placement. Measurement of renal artery PSV is used to assess residual or recurrent stenosis after therapy. There is a reduction in PSV in the stenotic region following successful angioplasty and stent placement. Hilar waveforms will also return to normal appearance after successful treatment in many cases ( Fig. 28.16 ).

Related posts:
 Doppler Flow Imaging and Spectral Analysis
 Ultrasound Diagnosis of Lower Extremity Venous Thrombosis
 Evaluating Carotid Plaque and Carotid Intima-Media Thickness
 Risk Factors and the Role of Ultrasound in the Management of Extremity Venous Disease
 Ultrasound in the Assessment and Management of Arterial Emergencies
 Evaluation of Organ Transplants
Stay updated, free articles. Join our Telegram channel

Full access? Get Clinical Tree


