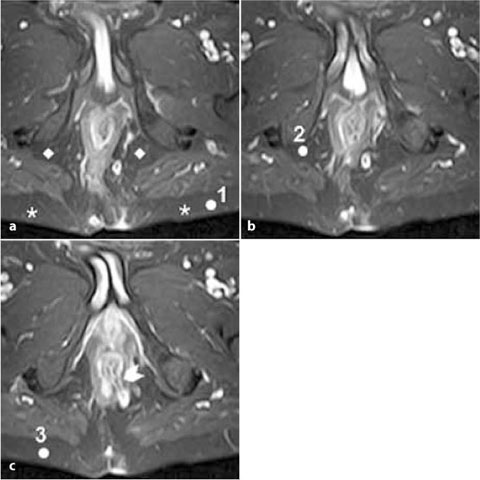
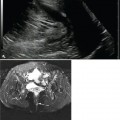
Fig. 19.1
Voluminous extrasphincteric fistula (arrowheads) best depicted on SPIR T1 coronal sequences after contrast administration. The signal intensity of the fistula was quantified by placing the ROI on the most enhancing middle tract of the fistula, within the fistula’s walls, as shown by 1, 2 and 3
three 2-mm2 elliptical, manually drawn ROIs (regions of interest) are placed within the walls of the fistula (Fig. 19.1). For each ROI, the mean value is recorded; the average of these measurements, i.e., the quantified signal intensity of the fistula (Sf) after contrast administration, is then calculated. On the same sequences, three elliptical manually drawn ROI of 5 mm2 are placed on different regions of the locoregional healthy fat, either of the ischioanal fossa or of the gluteus. The average of their mean values, i.e., the quantified signal intensity of the healthy fat (Shf) after contrast administration, is similarly calculated (Fig. 19.2). The percentage increase (PI) in the signal intensity of the fistula compared to that of healthy fat is determined as: PI = (Sf – Shf) ×100 / Shf. This value expresses the degree of contrast enhancement of the fistula relative to that of normal perianal tissue.
A significant association between the increase in the signal intensity of the fistula after contrast administration and the severity of perianal disease,
assessed by the PDAI and fistula drainage assessment (FDA), was reported. The PI thus appears to be of satisfactory diagnostic ability, offering a practical and immediate tool to quantify the degree of contrast enhancement of the fistula [10].
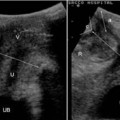
Fig. 19.2
Transsphincteric fistula at 5 o’clock (arrowhead) best depicted on SPIR T1 axial sequences after contrast administration. The signal intensity of healthy fat was quantified by placing the ROI on homogeneously hypointense fat, either within the gluteus (*) or the ischioanal fossa (◊), as shown by 1, 2 and 3
19.2 Assessment of Activity
Correct management in the follow-up of patients with fistula-related complications, which commonly include relapse, consists of contrast-enhanced MRI to assess the activity of perianal fistulas. As already demonstrated in previous studies [9,14–18], MRI yields useful information regarding changes in the internal aspects of the fistula tract during long-term medical therapy and can demonstrate persistent disease activity despite healing of the external orifices and cessation of the fistula’s drainage. It is therefore mandatory to quantify disease activity within the walls of the fistula in order to monitor the healing process and prevent recurrences.
At our institute, for each fistula tract detected, a PI score, which offers a quantitative assessment of the degree of contrast enhancement of the fistula relative to that of normal perianal tissue, is calculated. This score provides a reliable indicator of the disease activity of the fistula [13]. As noted above, the diagnostic ability of the PI in discriminating between the presence of active inflammation and fibrosis within the fistula tract has been investigated with respect to the PDAI and FDA. A significant association between the PI and the severity of perianal disease as assessed by these clinical indices was determined.
Considering a PDAI score > 4 as the reference cut-off value in depicting clinically active perianal disease [19], a fair ability of PI as a diagnostic tool was demonstrated (ROC curve analysis, AUC = 0.876). The diagnostic ability of PI in estimating disease activity according to the FDA score of active or inactive disease is also satisfactory (ROC curve analysis, AUC = 0.784). Moreover, a PI threshold of 200 has been proposed to discriminate between active and inactive fistulas, showing a fair sensitivity and specificity (for PDAI and FDA, respectively, 93.8% and 71.4% and 97.7% and 58.3%), based on preliminary data. Examples of cases in which perianal fistulas were evaluated with the PI score are described in the following figures.
Figure 19.3 shows a voluminous intersphincteric horseshoe fistula (arrowhead) detected on axial T2-weighted sequences (Fig. 19.3a), seen as a diffuse hyperintense alteration within the posterior intersphincteric space on both sides and more evident on SPIR T2 sequences (Fig. 19.3b). On axial SPIR T1 sequences acquired after contrast administration (Fig. 19.3d), the fistula tract is well-delineated and shows vivid hyperintense signal compared to the same sequences before contrast (Fig. 19.3c), suggesting strong contrast enhancement. The mean ROI values measured within the walls of the fistula and within healthy local gluteal fat were, respectively, 1924 and 370. The PI score was
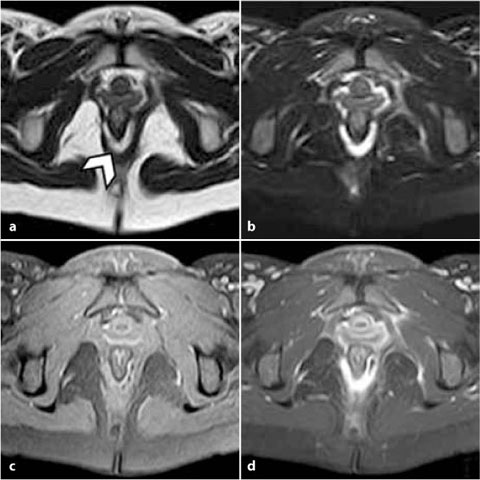
Fig. 19.3
Horseshoe intersphincteric fistula. a T2 axial sequence; b T2 SPIR axial sequence; c T1 SPIR axial sequence; d T1 SPIR axial sequence after contrast administration
420, indicating disease activity with respect to the PI threshold considered. These data were in agreement with the patient’s PDAI score of 8 and an active FDA score.
The patient was started on anti-tumor-necrosis-factor (TNF)-a therapy maintenance and 1 year later underwent a further MRI examination (Fig. 19.4). At the time of the second examination, the patient did not have perianal discharge but reported mild pain and restriction in the usual daily activities. No external orifice was detected at clinical examination. The PDAI score was 5.
Related posts:

Stay updated, free articles. Join our Telegram channel

Full access? Get Clinical Tree


