Key Points
- ▪
Cardiac CT is an excellent means of depicting pulmonary venous anatomy to plan pulmonary venous isolation procedures and of anticipating several potential complications of pulmonary venous isolation procedures.
- ▪
CCT is an excellent means of depicting coronary venous anatomy to plan cardiac resynchronization procedures.
- ▪
CCT yields superb detail of the atrial appendages in sinus rhythm; in atrial fibrillation, however, because of higher heart rates, irregular cardiac cycle length, and slow filling of the appendage, depiction of thrombi is poor.
Cardiac CT Imaging in Patients with Atrial Fibrillation
Cardiac CT (CCT) scanning remains problematic in atrial fibrillation (AF) in several ways because of inadequate temporal resolution:
- □
The heart rate tends to be higher in patients with AF ( Table 22-1 ).
TABLE 22-1
CTA Characteristics of Patients in Sinus Rhythm and in Atrial Fibrillation
ATRIAL FIBRILLATION ( n = 24)
SINUS RHYTHM ( n = 119)
P
Pre-scan heart rate
54 ±14 bpm
62 ±112 bpm
<.01
Postinjection heart rate
103 ± 30 bpm
71±17 bpm
<.01
Nondiagnostic CTA studies
8%
10%
ns
Good or excellent CTA image quality
54%
79%
.01
Radiation exposure
26 ± 8 mSv
8 ± 4 mSv
<.01
Data from Wolak A, Gutstein A, Cheng VY, et al. Dual-source coronary computed tomography angiography in patients with atrial fibrillation: initial experience. J Cardiovasc Comput Tomogr . 2008;2(3):172-180.
- □
The cardiac cycle length is always irregular.
- □
The increment in heart rate is greater during contrast injection and during image acquisition.
- □
Opacification of the left atrial appendage (LAA), which usually is dilated and nearly effectively stagnant, is delayed well beyond that of the left heart cavities and coronary arteries, potentially resulting in pseudothrombus in the left atrium, the result of incomplete opacification of the LAA due to enlargement of the LAA and altered flow characteristics in the left atrium due to AF ( Table 22-2 ).
TABLE 22-2
Left Atrial Appendage Volume and the Incidence of Pseudothrombus
ATRIAL FIBRILLATION
SINUS RHYTHM
Left atrial appendage volume
15 ± 7 mL
7 ± 3 mL
0.02
(Proven) pseudothrombus in the left atrial appendage during CTA without delayed imaging
71%
0
Data from Saremi F, Channual S, Gurudevan SV, Narula J, Abolhoda A. Prevalence of left atrial appendage pseudothrombus filling defects in patients with atrial fibrillation undergoing coronary computed tomography angiography. J Cardiovasc Comput Tomogr . 2008;2(3):164-171.
With different cardiac cycle lengths, multicycle/segmented acquisition image quality is seriously compromised. Using 64-slice CCT, overall only half (54%) of coronary CT angiography (CTA) image studies of AF are of adequate or good quality. Use of retrospective imaging at full tube output increases radiation exposure. Although feasible, cardiac/coronary imaging during AF with CT scanning requires further development to obtain increased yield and to lessen radiation exposure.
Structural noncoronary studies such as pulmonary venous and coronary venous anatomy studies are more likely than coronary CTA studies to be adequate.
However, using 320-slice CCT, the large majority of cases can be adequately imaged despite the presence of AF ( Table 22-3 ).
| AUTHOR | SENSITIVITY (%) | SPECIFICITY (%) | PPV (%) | NPV (%) | EVALUABLE SEGMENTS (No.) | DOSE (mSv) |
|---|---|---|---|---|---|---|
| Xu et al. | 90 | 99 | 86 | 99 | 97 | 13 ± 5 |
| Pasricha et al. | 99 | 19 |
The distal left circumflex artery appears to pose the most problems in evaluating for the presence and severity of coronary artery disease (CAD).
Identification of Left Atrial or Left Atrial Appendage Thrombus
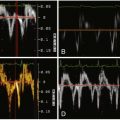
The presence of underlying AF challenges the accurate detection of atrial appendage thrombi. In contrast to patients in sinus rhythm, the variable cardiac cycle length and greater and more variable heart rate increase in response to the stimuli of scanner acceleration and contrast injection of patients in AF excessively tax the ability of 64-slice CT scanners to accurately assess the LAA. The left atrium, whose imaging is less affected by AF than is that of the appendage, is more readily assessed for the presence or absence of thrombus. The stagnation of flow within the LAA necessitates a delayed scan at 2 or more minutes post-injection, with additional radiation exposure.
Stagnation of flow within the LAA is a major confounder of assessment of the LAA for thrombosis. The delayed clearance of non–contrast-enhanced blood within the LAA has established the high incidence of false positive studies without delayed images. For example, Martinez et al. found that in 402 consecutive patients undergoing non–ECG-gated CCT and transesophageal echocardiographic (TEE) pre-pulmonary venous isolation, CCT identified 40 LAA filling defects, of which only 9 were confirmed by TEE. False negatives also are common; for example in Tang et al.’s study, only 4 of 10 thrombi seen on TEE were seen on CCT. Some false-positive defects persist even after delay.
There are few data to this point, but small early studies have shown correlation between TEE and contrast cardiovascular CT (CVCT) measurements of LAA size and correlation of findings of thrombi larger than 7 mm. Higher heart rates and irregular rhythm (the norm in AF) challenge feasibility at this point. ECG gating is important. CVCT is unable to show left atrial or appendage spontaneous contrast.
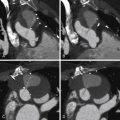
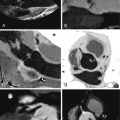
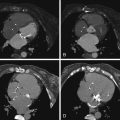
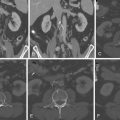
Small accessory LAAs are recognized by 64-slice CCT, but these, due to their novel recognition, are still of unknown significance. Accessory LAAs have been reported in 10% to 15% of the adult population undergoing cardiac CT ( Figs. 22-1 through 22-4 ).


Pre-Procedure Cardiac Mapping: Assessment of Pulmonary Vein Anatomy for Planning of Pulmonary Vein Ablation for Atrial Fibrillation
Atrial fibrillation usually is initiated by ectopic activity within the proximal pulmonary veins. Catheter-based techniques, in which access to the left atrium occurs via a transseptal puncture of the interatrial septum, are able to deliver radiofrequency current (or cryotherapy) to the sites that have been identified by mapping techniques as responsible for AF, electrically isolating them from the remainder of the atria. The usual success rate in achieving sinus rhythm at 1 year with two or three attempts is 75% to 85%—a marked improvement compared to medical therapy, which affords about 20% success.
Anatomic features are not adequate to identify the site responsible for AF.
Conventionally, real-time retrograde injection of contrast dye into the left atrium has been used during the procedure to visually guide catheter placement. However, opacification of the right inferior pulmonary vein is difficult to achieve by reflux venography. Other modalities such as intracardiac echocardiography and TEE are less robust than reflux venography, which is less robust than CCT in detecting normal and variant anatomy (e.g., supernumerary and common ostia and branch variation) ( Table 22-4 ).
| IMAGING MODALITY | PERCENTAGE DETECTION OF ALL FOUR PULMONARY VENOUS OSTIA ( n = 24) |
|---|---|
| Cardiac CT | 98 |
| ICE | 93 |
| TEE | 81 |
| Reflux venography | 71 |
Variations in pulmonary venous anatomy are fairly common. The most common variant is a separate right middle pulmonary vein. Pulmonary venous variants include:
- □
Three to five right-sided ostia (28%)
- □
One or two separate middle lobe pulmonary venous ostia (26%)
- □
A single right ostium on the right side (2%)
- □
A single left-sided ostium (14%)
- □
A right superior supranumerary pulmonary vein (2.2%), which passes behind the bronchus intermedius and drains mainly the posterior segment of the right upper lobe, but also receives a few subsegmental branches from the superior segment of the right lower lobe (mean diameter: 5.1 mm)
Anomalous Variants
- □
Right pulmonary vein to the superior vena cava
- □
Right pulmonary vein to the right atrium
- □
Right pulmonary vein to the inferior vena cava or a hepatic vein (i.e., scimitar syndrome)
- □
Left pulmonary vein to the innominate vein (i.e., vertical vein)
Factors Affecting Pulmonary Venous Size
The size (diameter) of pulmonary veins depends on:
- □
Volume status
- □
Respiratory phase (inspiration decreases pulmonary venous return and size). Expiratory phase images provide a better match to MRI depiction of pulmonary veins.
- □
The phase of the cardiac cycle (by 25%–45%):
- •
Maximal size of pulmonary veins: 35%
- •
Minimal size of pulmonary veins: 85%
- •
The use of image guidance during pulmonary venous isolation/ablation procedures reduces fluoroscopy times and increases success.
CCT has become the principal noninvasive diagnostic test to depict venous anatomy of the heart for the following reasons:
- □
Especially when compared with TEE, intracardiac echocardiography, and reflex venography, it is less operator dependent.
- □
Unlike cardiac MR (CMR), it can be performed on patients with pacemakers and implantable cardioverter defibrillators.
- □
Its results are reproducible.
- □
It can depict the thickness of the wall of the pulmonary veins.
- □
It can characterize the lung parenchyma for complications such as pulmonary edema and infarction.
- □
It can image the mediastinum both before and after ablation. This can assist in visualizing the relation of the esophagus to the left atrium and in detecting the presence of large intrathoracic hiatus hernias.
CCT can offer several forms of depiction of pulmonary venous and left atrial anatomy that may be useful to interventional electrophysiologists before they undertake catheter-based ablation procedures and to interventional cardiologists:
- □
Three-dimensional (3D) reconstruction of surface views depicting the coronary venous structures on the myocardium
- □
“Endoscopic” views to depict pulmonary veins from a perspective within the left atrium
- □
3D views of pulmonary veins and the left atrium, with or without the remainder of the heart
- □
Diagnostic imaging of pulmonary vein stenosis, achieved with multiplanar reconstructions, maximal intensity projections, and volume-rendered images
Examples of normal pulmonary veins are shown in Figures 22-5 and 22-6 .


The size of pulmonary veins is variable and is influenced by several factors ( Table 22-5 ).
| LARGER | SMALLER |
|---|---|
| Chronic long-term atrial fibrillation | Chronic short-term atrial fibrillation |
| Chronic atrial fibrillation | Paroxysmal atrial fibrillation |
| Larger LA | Smaller LA |
| Mitral disease | No mitral disease |
| LV disease | No LV disease |
| Volume loaded | Volume depleted |
| Male | Female |
There is a wide range of variant pulmonary venous anatomy, and image examples of variant pulmonary venous anatomy are seen in Figures 22-7 through 22-12 .


Related posts:
 Overview of the Process, Exclusions and Risks, and Preparation
 CTA Assessment of Saphenous Vein Grafts and Internal Thoracic (Mammary) Arteries
 Determination of Coronary Calcium
 Assessment of Infective Endocarditis and Valvular Tumors
 Assessment of Left Ventricular Structural Abnormalities
 Caval Anatomy: Variants and Lesions
Stay updated, free articles. Join our Telegram channel

Full access? Get Clinical Tree


