Clinical Presentation
The patient is a 66-year-old male with a 7-year history of low back and bilateral hip pain. The pain is most evident when he is walking. His pain has been progressive over the last several years and now he can only walk 20 yards before he has to stop because of bilateral buttock and hip pain. The patient has been significantly obese since he was 35 years old and presently weighs 298 pounds with a height of 6′1″.
Imaging Presentation
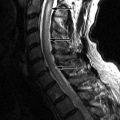
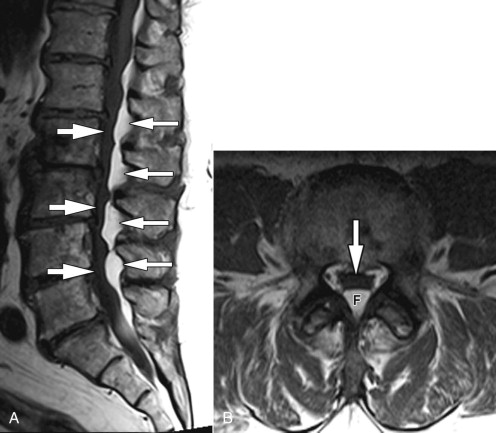
Sagittal and axial T1-weighted magnetic resonance (MR) images demonstrate lobulated increased signal intensity in the posterior epidural space throughout the lumbar spine, which is most prominent at the disc levels and causes ventral displacement and narrowing of the thecal sac compatible with epidural lipomatosis ( Fig. 30-1 ) .
Discussion
Spinal epidural lipomatosis (SEL) is characterized by unencapsulated fat in the epidural space of the spinal canal. The vast majority of cases of SEL are in patients that are either morbidly obese, on chronic steroid therapy, or suffering from Cushing’s syndrome or other endocrinopathy. SEL occurs more commonly in men than women (3:1), with a mean age of approximately 43 years. The youngest reported case was in a 6-year-old boy receiving high-dose steroids. Approximately 75% of the cases of SEL are associated with exogenous steroid use. The quantity of exogenous steroid necessary to cause SEL ranges from 30 to 100 mg daily with a duration of use from 5 to 11 years. However, there have been reported cases of SEL developing in patients using steroids for only a few months at low dosages. There have been varying reports as to the location of SEL. There have been reports that SEL occurs most commonly in the thoracic spine with between 58% and 61% of cases, followed by lumbar involvement in 39% to 42%. Cervical epidural lipomatosis has not been reported. Others have reported that there is no difference in the incidence between thoracic and lumbar SEL.
In general, epidural fat that has a thickness greater than 7 mm has been reported to be diagnostic of SEL. A more specific classification was observed by Borre and colleagues as it pertained to lumbar spinal epidural lipomatosis ( Table 30-1 ).
| MRI Grade | AP Diameter (thecal sac/epidural fat) | AP Diameter (epidural fat/spinal canal) |
|---|---|---|
| Normal | ≥1.5 | ≤0.40 |
| LEL I (mild) | 1.49 | 0.41-0.50 |
| LEL II (moderate) | 0.99-0.34 | 0.51-0.74 |
| LEL III (severe) | ≤0.33 | ≥0.75 |
The most common symptom with SEL is back pain, which often manifests long before other symptoms. Other common symptoms include slowly progressive lower extremity weakness and sensory changes with numbness, paresthesias, or radicular symptoms. Although bowel and bladder complications have been reported, these tend to be rare. The location of symptoms is, of course, related to the level of the SEL.
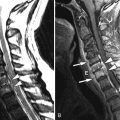
Imaging Features
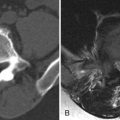
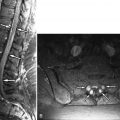
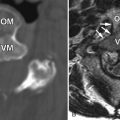
SEL cannot be diagnosed by plain film radiography. Prior to MR imaging, the diagnosis of SEL was based on myelography and computed tomography (CT) imaging. Myelography may reveal obstruction to the normal flow of contrast if the spinal canal is blocked or may demonstrate the typical extradural defects on the thecal sac if there is partial obstruction. Myelography, alone, does not lead to the diagnosis of SEL because this will only reveal the level and space of the narrowing or obstruction, not the cause. Plain CT, or post-myelogram CT, has the advantage of being able to measure the density of the cause of the obstruction. Fatty tissue has a density ranging between −80 and −120 Hounsfield units on CT scan, which differentiates it from other tissues ( Fig. 30-2 ) . MRI has replaced CT as the study of choice for the evaluation of SEL. MRI readily demonstrates the level and degree of obstruction caused by a mass lesion—in this particular case, an abnormal quantity of epidural fat. Secondly, fat has specific T1- and T2-weighting, being of increased signal intensity on T1-weighting and intermediate to increased signal intensity on T2-weighting ( Figs. 30-1 and 30-3 ). Blood, extracellular methemoglobin, in the epidural space can have a similar T1- and T2-weighted appearance; however, through the use of fat-saturation or fat-suppression MR techniques, these two entities can be easily distinguished. As its name implies, if a fat-saturated or fat-suppressed technique is used, the fat becomes dark or gray with T1- or T2-weighting, whereas the signal of blood remains the same ( Fig. 30-4 ) .