Fig. 7.1
Schematic diagram of modelling the image of a fluorescent edge and the definition of transverse resolution
The signal level η is defined as the number of fluorescence photons generated from a fluorescent sheet and collected by a detector. Usually, the signal level is normalized by the fluorescence signal strength when no scattering exists. This normalization process eliminates the difference of the strength of the excitation process, and thus allows a unique comparison of the relative decay rate of the fluorescence strength along the depth of a turbid medium. According to the definition of the signal level, the signal level represents the total contribution of fluorescence photons collected by the detector which contains the fluorescence photons excited by ballistic photons, snake photons, and scattered photons.
This definition of the signal level does not provide the direct information of the image resolution; however, it is important to determine the achievable resolution of the reconstructed image in imaging processing through a turbid medium. In this process, the object information is extracted through a deconvolution operation based on the concept of the effective point spread function (EPSF) introduced in Chap. 4 (see Chap. 9); the more the object information is extracted, the higher the image resolution. Though ballistic and snake photons carry the object information of high resolution, scattered photons also carry the object information but just in a complicated way. To achieve a stable deconvolution operation, an input image with strong strength is necessary. Otherwise, the noise signal from sources other than a turbid sample can lead to pronounced artifacts in a deconvolved image. Therefore, these parameters, the image resolution Γ and the signal level η, provide the complemental information of the image performance in a turbid medium.
The microscope considered in this chapter is a reflection system (see Fig. 3.3b) in which L1 and L2 are two identical objectives used for illumination and detection, respectively, and a finite-sized pinhole of diameter v d is placed in front of the detector. The detail of the Monte Carlo simulation is given in Sect. 3.9. The imaging modeling is based on the convolution of the EPSF and a fluorescent object, as introduced in Chap. 4. Totally, 10,000,000 illumination photons are used in the Monte Carlo simulation to ensure the accuracy of an EPSF for a reflection-mode scanning optical microscope. It is assumed that under single photon excitation, the wavelength of the excitation beam and fluorescence beam is 400 nm.
7.2 Image Performance Through Single-Layer Homogeneous Turbid Media
One way to improve the image quality in imaging through a turbid medium is to suppress the contribution of highly scattered photons by using optical gating elements. As discussed in Chaps. 5 and 6, one of the most efficient optical gating devices used in microscopic imaging is the pinhole gating method. However, before a pinhole mask starts to play its role, photons emerging from a turbid medium go through a preselection process determined by the aperture of objectives. In this section, we will demonstrate the influence of the numerical aperture (NA) of objectives, pinhole and scatter size on 1p fluorescence image quality in a single homogeneous turbid layer [3].
The scattering medium consists of either spherical particles of diameter (ρ) 0.48 μm or spherical particles of diameter 0.202 μm, suspended in water. We assume that the particle concentration in the turbid medium consisting of 0.48 μm particles is 0.87 × 10⁹/mm3. According to Mie Scattering theory (Chap. 2), the corresponding scattering mean free path length (SMFPL) is 3.68 and 15 μm for wavelengths 400 and 800 nm, respectively. The optical thickness n is defined as the sample thickness d divided by the SMFPL. For example, if a sample is embedded at a depth of 30 μm, the corresponding optical thickness is 8.14 for wavelength 400 nm. In order to demonstrate the effect of particle size, the SMFPL in a turbid medium consisting of 0.202 μm particles is also assumed to be 3.68 and 15 μm, respectively, for wavelength 400 and 800 nm. The parameters associated with the two turbid media are summarized in Table 7.1.
Table 7.1
Parameters associated with scattering media
 | ||
|---|---|---|
ρ (μm) | g | SMFPL (μm) |
0.48 (L) | 0.89 | 3.68 |
0.202 (S) | 0.69 | 3.68 |
7.2.1 Effect of the Numerical Aperture of an Objective
The EPSF at a depth of 30 μm for 1p fluorescence imaging in a turbid medium consisting of 0.48 μm scatterers is shown in Fig. 7.2a for different values of the numerical aperture of an objective. It is found that a small central peak becomes visible at the focal center for high NA objectives (NA = 1.25). The central peak is mainly contributed by ballistic photons which suffer no scattering effect on their way propagating to the focal center. These ballistic photons form a diffraction-limited spot. For high numerical aperture objectives, the focal spot is small which leads to a high intensity at the focal center. However, the other components in the EPSF, contributed by scattered photons, form a broad distribution for high NA objectives. This is because a high NA objective collects scattered photons travels at high angles and these scattered photons statistically experience more scattering events and contribute to a broader distribution in the EPSF.
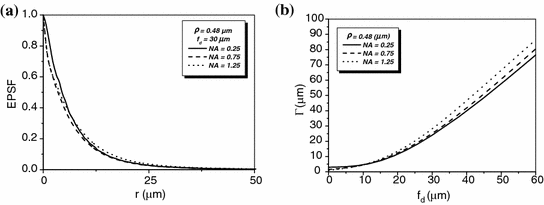

Fig. 7.2
EPSF at a depth of 30 μm (a) and the transverse resolution as a function of the focal depth (b) for different values of the numerical aperture of an objective in 1p fluorescence imaging ( )
)
 )
)In Fig. 7.2b, the corresponding transverse resolution as a function of the focal depths is illustrated for different values of the numerical aperture of an objective. It is shown that for a higher NA objective, the transverse resolution is slight poorer after a given focal depth if ![$$f_{\text{d}} > 5\,\upmu{\text{m}}$$” src=”/wp-content/uploads/2016/09/A71851_1_En_7_Chapter_IEq1.gif”></SPAN>. This is because the scattered components in the EPSF are dominant in forming an image. In this case, more scattered photons are collected by the objective, and the corresponding distribution in the EPSF is broad (see Fig. <SPAN class=InternalRef><A href=]() 7.2a) which leads to a poorer transverse resolution. However, a higher NA objective also gives a sharper distribution in the EPSF for ballistic component (see Fig. 7.2a), which gives a better resolution, when
7.2a) which leads to a poorer transverse resolution. However, a higher NA objective also gives a sharper distribution in the EPSF for ballistic component (see Fig. 7.2a), which gives a better resolution, when ![$$f_{\text{d}} > 5\,\upmu {\text{m}}$$” src=”/wp-content/uploads/2016/09/A71851_1_En_7_Chapter_IEq2.gif”></SPAN>. But the strength of such component is weaker compared with scattered component for a thicker turbid medium. As the result, using a higher NA objective without other gating methods, such as pinhole gating in 1p fluorescence imaging gives a poorer transverse resolution. However, the effect is not significant.</DIV><br />
<DIV class=Para>The normalized signal level as a function of the focal depth is demonstrated in Fig. <SPAN class=InternalRef><A href=]() 7.3a. It is noticed that a high NA objective results in a relatively quick degradation in the signal level as the focal depth increases. However, the relative signal level, which is the collected fluorescence photons out of the incident photons, at a given focal depth is high when a high NA objective is used (Fig. 7.3b). This is because that a high NA objective has a high collected angle thus more scattered photons away from the paths of ballistic photons are collected.
7.3a. It is noticed that a high NA objective results in a relatively quick degradation in the signal level as the focal depth increases. However, the relative signal level, which is the collected fluorescence photons out of the incident photons, at a given focal depth is high when a high NA objective is used (Fig. 7.3b). This is because that a high NA objective has a high collected angle thus more scattered photons away from the paths of ballistic photons are collected.
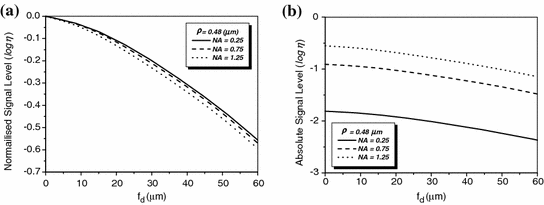

Fig. 7.3
Normalised signal level (a) and relative signal level (b) as a function of the focal depth for different values of the numerical aperture of an objective in 1p fluorescence imaging ( )
)
 )
)7.2.2 Effect of Pinhole
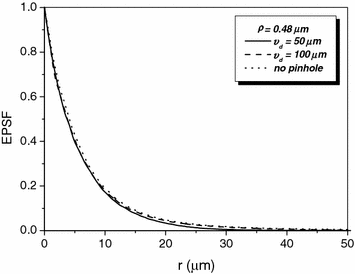
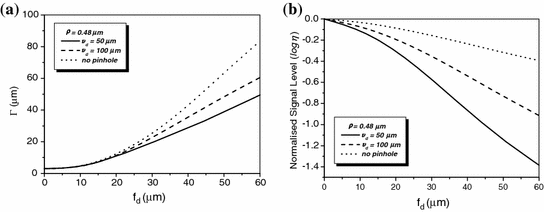
To demonstrate the effect of pinhole gating on fluorescence microscopic imaging, we show the EPSF at a depth of 30 μm for different sizes of pinhole in Fig. 7.4. It is noted that with the utilization of a confocal pinhole , the EPSF becomes slightly narrower; the smaller the size of the pinhole, the narrower the EPSF. It is also noticed that the tail of the EPSF drops quickly when a pinhole is used. This feature shows that pinhole gating is particularly efficient in suppressing highly scattered photons which deviate further from the path of ballistic photons. The elimination of the long tail may significantly reduce the blurring of an image caused by the scattering effect. In Fig. 7.5a, the transverse resolution as a function of the focal depth is illustrated for different sizes of pinhole. As expected, the transverse resolution improves when a pinhole is used. For example, at a depth of 45 μm, the transverse resolution is 62 μm when no confocal pinhole is used, but becomes 42.8 and 27.1 μm, respectively, for a pinhole of diameters  and
and  . The ratio of improvement is 31 and 56 % in these two cases, respectively. The degradation of the signal level as the function of the focal depths is demonstrated in Fig. 7.5b. The smaller the pinhole size, the quick drop the signal level as the focal depth increases. This phenomenon can be well explained by the fact that for deeper focal depths, fluorescence phones suffer more scattering and deviate further, and consequently are suppressed by the pinhole.
 and
and  . The ratio of improvement is 31 and 56 % in these two cases, respectively. The degradation of the signal level as the function of the focal depths is demonstrated in Fig. 7.5b. The smaller the pinhole size, the quick drop the signal level as the focal depth increases. This phenomenon can be well explained by the fact that for deeper focal depths, fluorescence phones suffer more scattering and deviate further, and consequently are suppressed by the pinhole.
Fig. 7.4
EPSF for 1p fluorescence imaging at a depth of 30 μm for different sizes of a pinhole (NA = 0.25, ρ = 0.48 μm)

Fig. 7.5
Transverse resolution (a) and normalised signal level (b) as a function of the focal depth for different sizes of a pinhole in 1p fluorescence imaging (NA = 0.25, ρ = 0.48 μm)
7.2.3 Effect of Scatterer Size
Now let us turn to the effect of scatter size . The scattering medium consists of either spherical particles of diameter (ρ) 0.48 μm or spherical particles of diameter 0.202 μm, suspended in water. A comparison of the EPSFs for 1p fluorescence imaging of the turbid medium consisting of either 0.48 or 0.202 μm particles at depths of 10 and 30 μm is shown in Fig. 7.6. It is demonstrated that the EPSF is broader for a turbid medium consisting of small scattering particles. This feature is due to the fact that the anisotropy value g is smaller for smaller scatterers (see Table 7.1). Therefore, a scattered photon statistically deviates further from the paths of ballistic photons after each scattering event which leads to a broader EPSF. The difference of the EPSFs between large particle and small particle turbid media becomes larger as the focal depth becomes deeper.
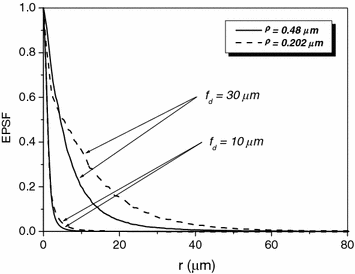

Fig. 7.6
EPSF for 1p fluorescence imaging at different depths for a turbid medium consisting of either scatterers of diameters 0.48 μm or scatterer of diameter 0.202 μm, respectively ( )
)
 )
)Transverse image resolution and signal level of an edge object embedded in a turbid medium consisting of either particles of diameter 0.48 μm or particles of diameter 0.202 μm is illustrated in Fig. 7.12a, b, respectively. It is shown that the transverse resolution degrades when a turbid medium becomes thick and that the resolution becomes worse if a turbid medium consists of smaller scatterers as the result of a broader EPSF shown in Fig. 7.7a.
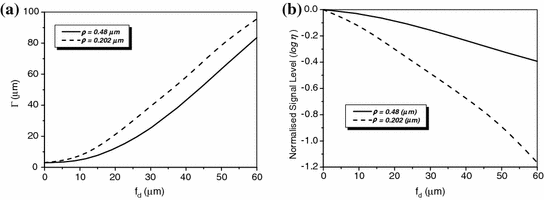

Fig. 7.7
Transverse resolution and signal level as a function of the focal depth for different sizes of scattering particles in 1p fluorescence imaging ( )
)
 )
)As the imaging depth becomes thicker, the signal level also decreases (Fig. 7.7b). It is also noticed that the degradation of the signal level is much quicker as the function of the focal depths in the turbid medium consisting of the smaller scatterers due to the smaller anisotropic value g, which results in further deviation from the collection paths.
7.3 Image Performance Through Single-Layer Inhomogeneous Turbid Media
In this section, 1p fluorescence microscopy through turbid media that consist of multisized scattering particles is investigated. It is known that the scattering features of a medium can be described by two parameters, the anisotropy value (g) and scattering cross-section (σ) of the scattering particles. In fact, the concentration of the particles of a given size in a turbid medium also plays an important role in the determination of the scattering features of the medium. Combined with the cross-section, it determines the total cross-section of the turbid medium through an effective mean free path length as introduced in Sect. 3.7. Therefore, the investigation into the size effect actually includes the effect of the size distribution and the effect of the concentration distribution [4].
7.3.1 Scattering Property of a Multi-sized Turbid Layer
According to the size distribution of small organelles and nuclei in a cell [5], three groups of inhomogeneous turbid media are considered for understanding image formation. Groups S and L, which attempt to investigate the scattering features from small organelles and large nuclei in cells, contain nine types of scattering particles. Their diameter (ρ) covers from 0.1 to 0.9 μm and from 2.6 to 3.4 μm, respectively, with a diameter interval of 0.1 μm. The mean size of these two groups is 0.5 and 3.0 μm, respectively. The third group of the turbid media (M) is a mixture of groups S and L, which can be used to simulate the situation where small scattering organelles and large nuclei both exist. Based on Mie theory, the corresponding anisotropy value (g i) and scattering cross-section ( ) of each type of particles are shown in Table 7.2.
 ) of each type of particles are shown in Table 7.2.
Table 7.2
Scattering parameters ( , g) of the small (S) and large (L) groups of scattering particles (Reprinted with permission from [4], 2003, SPIE)
 , g) of the small (S) and large (L) groups of scattering particles (Reprinted with permission from [4], 2003, SPIE)
ρ (μm) (S) | 0.1 | 0.2 | 0.3 | 0.4 | 0.5 | 0.6 | 0.7 | 0.8 | 0.9 | |
|---|---|---|---|---|---|---|---|---|---|---|
400 nm (1p excitation) (fluorescence) | σ si (μm2) | 0.000296 | 0.0081 | 0.0483 | 0.155 | 0.36 | 0.686 | 1.132 | 1.678 | 2.28 |
g i | 0.193 | 0.685 | 0.804 | 0.864 | 0.894 | 0.916 | 0.924 | 0.928 | 0.929 | |
ρ (μm) (L) | 2.6 | 2.7 | 2.8 | 2.9 | 3.0 | 3.1 | 3.2 | 3.3 | 3.4 | |
|---|---|---|---|---|---|---|---|---|---|---|
400 nm (1p excitation) (fluorescence) | σ si (μm2) | 14.28 | 15.1 | 15.65 | 16.16 | 16.62 | 16.56 | 16.23 | 15.98 | 16.44 |
g i | 0.889 | 0.896 | 0.892 | 0.877 | 0.863 | 0.863 | 0.870 | 0.877 | 0.872 | |
Two types of the concentration distributions, the uniform and Gaussian distribution , are also to be investigated, which are, respectively, represented by U or G. All concentration distributions discussed in this section are centrally symmetrical through the mean size particle. Each turbid medium is labeled by two letters followed by two digitals. The first letter represents the type of particle group, while the second letter denotes the type of the concentration distribution. The two digitals correspond to a width parameter δ. The width parameter δ in the medium with a uniform distribution is  where
where  and
and  are the maximum and minimum particle sizes included in the medium, respectively. In the medium with a Gaussian distribution, the width parameter δ is defined as the full width at half maximum of the concentration distribution. For example, the SG01 medium contains a small group of particles with a Gaussian distribution and δ = 0.1 μm.
 where
where  and
and  are the maximum and minimum particle sizes included in the medium, respectively. In the medium with a Gaussian distribution, the width parameter δ is defined as the full width at half maximum of the concentration distribution. For example, the SG01 medium contains a small group of particles with a Gaussian distribution and δ = 0.1 μm.
The parameters used in the Monte Carlo simulation are as follows. 107 illumination photons are used to ensure the accuracy of simulation results. The numerical aperture of the objective is chosen to be 0.25. It is assumed that the wavelength of the excitation and fluorescence beams, λ ex and λ fluo under 1p excitation is both 400 nm. To keep the consistent simulation conditions, we assume that the averaged total geometrical cross-section (σ) is constant in all media, which can be mathematically expressed as


