There is growing interest in exploring and using functional imaging techniques to provide additional information on structural alterations in the liver, which often occur late in the disease process. This article presents a summary of the different functional MR imaging techniques currently in use, focusing on dynamic contrast-enhanced MR imaging, diffusion-weighted MR imaging, MR spectroscopy, in- and oppose-phase MR imaging, and T2*-weighted imaging. For each technique, the biologic underpinning for the technique is explained, the clinical applications surveyed, and the challenges for their application enumerated. Developing and less frequently used techniques such as MR elastography, blood oxygenation level dependent imaging, dynamic susceptibility contrast-enhanced MR imaging, and diffusion-tensor imaging are reviewed. The challenges widespread adoption of functional MR imaging and the translation of such techniques to high field strengths are also discussed.
Functional magnetic resonance imaging of the liver
Magnetic resonance (MR) assessment of the liver has largely relied on visual assessment of unenhanced T1- and T2-weighted, as well as contrast-enhanced, images. These conventional imaging sequences form the backbone for the detection and characterization of liver diseases. However, structural alterations in the liver often occur late in the disease process, and the degree to which conventional imaging can assess earlier phases of disease evolution is limited. Thus, despite the success of conventional liver MR imaging techniques in daily clinical practice, there is growing interest in exploring and using functional imaging techniques to provide additional information.
Functional MR imaging techniques are designed to acquire information that reflects specific aspects of the disease pathophysiology. A key feature of these techniques is that they are quantitative, resulting in the derivation or calculation of quantitative parameters that can be used to describe and measure pathophysiologic derangements associated with diseases. The development of these techniques in the liver has been borne out of unmet clinical needs for the assessment of common conditions for which early diagnosis of disease state or treatment response would have a major effect on patient management.
This article provides a summary of the different functional MR imaging techniques currently in use in the clinic or for research applications. We discuss the more frequently used functional imaging techniques: dynamic contrast-enhanced (DCE) MR imaging, diffusion-weighted (DW) MR imaging, MR spectroscopy (MRS), in- and opposed-phase MR imaging, and T2*-weighted imaging. For each technique, the biologic underpinning for the technique is explained, its clinical application surveyed, and the challenges for its application enumerated. Developing and less frequently used techniques, such as MR elastography (MRE), blood oxygenation level dependent (BOLD) imaging, dynamic susceptibility contrast-enhanced (DSC) MR imaging, and diffusion-tensor (DT) imaging are reviewed. DCE MR imaging and MRE are covered in more depth elsewhere in this issue. The potential for combining information from different MR functional techniques is highlighted in the context of future developments. Challenges to widespread adoption of functional MR imaging and obstacles to the translation of such techniques to high field strengths are also discussed.
Functional MR imaging techniques
Several functional MR imaging techniques can now be used for the evaluation of both malignant and nonmalignant conditions of the liver. These techniques are summarized in Table 1 ; each technique provides information on different aspects of the disease pathophysiology via quantitative measures. These techniques can be applied on most modern-day MR imaging systems, and combinations of them can be realistically incorporated into a study protocol of approximately 30 to 45 minutes’ duration. As these imaging techniques are increasingly used, there is a valuable opportunity to compare and correlate such biologically relevant information, acquired in a spatially and temporarily resolved way, to improve understanding of the biologic aberrations caused by diseases.
| Functional MR Imaging Technique | Principles of MR Measurement | Typical Measurement Time | Biologic Property on Which Measurement is Based | Commonly Derived Quantitative Imaging Parameter | Pathophysiologic Correlates |
|---|---|---|---|---|---|
| More widely used | |||||
| DCE MR imaging | Gadolinium contrast-enhanced T1-weighted imaging at high temporal resolution (<4 s). | Less than 10 min (including precontrast and postcontrast T1 measurements) | Rate of contrast uptake in tissues, which is influenced by blood flow, contrast transfer rates, extracellular volume, and plasma volume fraction | Initial area under the gadolinium curve, transfer and rate constants (K trans , k ep ), leakage space fraction (v e ), fractional plasma volume (V p ) | Vessel density, vascular permeability, perfusion, extravascular space, plasma volume |
| Mathematical modeling of data | |||||
| DW MR imaging | Single-shot spin-echo echo-planar imaging | 20 s to a few minutes | Differences in water diffusivity between tissues | Apparent diffusion coefficient. Use of biexponential data fitting can be used to estimate fast diffusion component, which may represent microcapillary perfusion | Tissue architecture (cell density, extracellular space tortuosity, cell membrane integrity), fluid viscosity, microcapillary perfusion |
| Contrast medium not required | |||||
| 1 H MRS | Single-voxel or three-dimensional chemical-shift imaging. | 15–20 min | Cell membrane turnover/energetics, chemical composition of tissues | Quantified ratios of metabolites including choline, creatine, lipids, lactate, and others depending on echo time | Tumor grade, tumor proliferation, metabolic derangements |
| Metabolite assignment based on chemical shift effects | |||||
| In- and opposed-phase MR imaging | 2-point or 3-point Dixon technique T1-weighted imaging | Few minutes | Chemical shift resulting from presence of fat or iron within each image voxel | Quantified estimates of fat within image voxels | Hepatic steatosis |
| T2*-weighted imaging | Gradient-echo imaging | Few minutes | Iron in tissues results in shortening of the T2-relaxation time | Quantified estimates of iron within image voxels | Hepatic iron deposition |
| Less widely used | |||||
| MRE | Modified phase-contrast gradient-echo sequence with cyclic motion-encoding gradients synchronized to the passive pneumatic driver | <1 min | Differences in the wavelengths of shear waves propagated through tissue depending on the stiffness or elasticity of tissue | Mean liver stiffness (in kPa) | Liver fibrosis Liver cirrhosis |
| DSC MR imaging | T2*-weighted MR imaging at high temporal resolution to measure first pass of gadolinium contrast passage through the liver | 1–2 min | Blood volume and blood flow | Relative blood volume (rBV/rBF), Mean transit time (MTT) | Vessels density, Blood flow, Tumor grade |
| BOLD or intrinsic susceptibility weighted MR imaging | T2*-weighted imaging performed using different echo times to detect and quantify susceptibility effects | <5 min | Deoxyhemoglobin shows higher relaxivity than oxyhemoglobin. | Intrinsic tissue relation rates (R2* = 1/T2*) | Ferromagnetic property of tissues, Level of tissue oxygenation |
| Measurements also reflect blood volume, perfusion and intrinsic tissue composition | |||||
| DT imaging | Single-short echo-planar imaging in 6 or more diffusion gradient encoding directions | 5–15 min | Degree of directionality of water diffusion | Apparent diffusion coefficient, relative anisotropy, fractional anisotropy, volume ratio | Tissue organization and structure |
Among the various functional MR imaging techniques currently in use, DCE MR imaging and DW MR imaging are now widely applied clinically and in research. Although these 2 techniques have different biologic underpinnings, DW MR imaging has the advantages of being a quick examination (1–5 minutes) and there is no need for administration of an exogenous contrast medium. By contrast, DCE MR imaging requires meticulous technique for its implementation, and can require image registration and more complex data processing, which may not be widely available. 1 HMRS has been used to evaluate hepatic steatosis but the Dixon MR technique and its variants, based on phase shifts between water and fat protons, is now increasingly used for fat quantification because of its relative ease of application. T2*-weighted imaging has been shown as an accurate method for estimating hepatic iron content. MRE is a relatively new functional imaging technique that requires specific hardware (a pneumatic driver) for its deployment. However, the technique is already showing substantial promise for the evaluation of liver fibrosis. Other functional imaging techniques, such as DSC MR imaging, DT imaging, and BOLD imaging have been investigated in the liver, but their roles for liver assessment are not fully defined.
Perfusion MR imaging of the liver
Perfusion MR imaging refers to functional measurement of the microcirculation of the liver by applying the DCE MR imaging technique.
Biologic Basis for MR Measurements
Perfusion MR imaging of the liver tracks the passage of contrast medium through the liver tissue following intravenous injection. The temporal evolution of signal intensity change in the liver parenchyma or tumor is used to extract quantitative kinetic parameters that reflect the vascular compartment within each imaging voxel. Because of the limited spatial resolution of MR imaging, it is not possible to directly image microvessel blood flow. Instead, the signal measured at DCE MR imaging represents changes that occur on a global level as a consequence of microcirculatory changes within the liver.
Technical Considerations
Following intravenous contrast administration, repeated T1-weighted imaging is performed in the liver at a high temporal resolution (typically every 4 seconds or less) to track the passage of contrast through the liver, which is observed as change in the tissue signal intensity. Typically, a T1-weighted three-dimensional (3D) spoiled gradient-echo technique is used, to which parallel imaging may be applied to reduce the scan time and improve temporal sampling. Motion correction can be performed prospectively using navigator techniques that track the diaphragm, and/or retrospectively by registration software; coronal data acquisition facilitates these procedures. A typical imaging sequence protocol is presented in Table 2 .
| MR Imaging Platform | 1.5 T Avanto (Siemens, Erlangen, Germany) |
|---|---|
| Type of pulse sequence | 3D FLASH |
| Image acquisition plane | Coronal |
| Repetition time | 3.28 ms |
| Echo time | 0.89 ms |
| Partition thickness | 5 mm |
| Slices per slab | 12 |
| Matrix | 128×128 interpolated |
| Phase encode direction | Right to left |
| Number of averages | 1 |
| Sensitivity encoding factor | 2 |
| Flip angle before contrast | 2° and 18° |
| Flip angle after contrast | 18° |
| Bandwidth | 650 Hz/pixel |
| Radiofrequency spoiling | Yes |
| Temporal resolution | 5 s per slab of 12 image sections |
| Precontrast scans | 4 measurements of each flip angle averaged for calculation of native T1 |
| Gadolinium injection | 0.2 mmol/kg at 3 mL/s followed by 20 mL flush |
| Patient respiration | Sequential breath hold or quiet respiration |
| Postcontrast scans | A total of 80 consecutive measurements. Inject contrast only when the sixth measurement has completed |
| Scan sections to use for processing | Center 6–8 image sections only |
By making assumptions about the vascular supply to the liver (eg, dual input, in keeping with the dual vascular supply of the liver from the hepatic artery [25%] and portal vein [75%] depending on the postprandial state) and the way contrast leaks from the intravascular compartment into the extracellular interstitial compartment (eg, a 2-compartment system), mathematical models can be used to derive quantitative indices that describe the behavior of hepatic vasculature. Examples of such indices include the inflow transfer constant (K trans ), leakage space (v e ), and outflow rate constant (k ep ) ( Fig. 1 provides an explanation of these terms). However, depending on the mathematical model applied, the quantitative parameters obtained may differ between kinetic models. More simplistic non–model-based approaches have also been successfully used in several studies and are further explained elsewhere in this issue. The non–model-based analysis techniques rely on comparing signal intensity before and after contrast to derive semiquantitative parametric estimates. For example, the hepatic perfusion index (HPI) can be calculated from the slope of the arterial perfusion divided by the sum of the slope of the arterial and portal perfusion. This value is typically about 0.30 in the normal liver, but is increased in metastases. The initial area under the gadolinium concentration curve (IAUGC) represents the integrated area under the gadolinium tissue enhancement curve usually in the first 60 or 120 seconds of contrast enhancement, which represents the leakage of contrast into the extracellular space, therefore indirectly reflecting tissue vasculature.

∗ K trans is the rate constant that describes contrast leakage into tissue, v e is the extravascular extracellular space which the contrast medium distributes and k ep is the rate constant of contrast wash out from tissue.
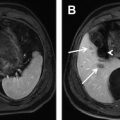
The color scale is as shown on images with low values in blue, intermediate values in yellow and red, and high values in white. Note reduction in all parameters within tumor after treatment but no significant change in tumor size. Posttreatment maps show absence of color within center of tumor in keeping with central devascularization and presumed necrosis.Clinical Applications of Perfusion MR Imaging in the Liver
Alterations in the vascular kinetics of the liver have been used as the basis for characterization of liver tumors, assessment of therapeutic response, and evaluation of cirrhosis.
Liver metastases
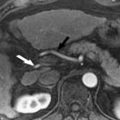
Several studies have demonstrated that perfusion imaging is able to detect changes in the liver at risk of developing liver metastases. Totman and colleagues showed that the non–model-based parameter HPI was increased in patients with overt metastases compared with patients without metastases ( Fig. 2 ). It was also found that the increased HPI could help to identify patients with micrometastases. In addition, perfusion maps could increase the sensitivity of metastatic detection in the liver because of better visualization of the enhanced tumor rim.

Hepatocellular carcinoma
In a study by Abdullah and colleagues, no significant difference was found in the HPI between colorectal metastases and hepatocellular carcinoma (HCC) (n = 50). In another study (n = 30) using computed tomography (CT) perfusion, the blood flow, blood volume, and permeability surface area product (an index of vascular permeability) were found to be significantly higher in well-differentiated HCC compared with moderately or poorly differentiated variants, suggesting that the perfusion imaging may help to determine tumor grade.
Assessment of treatment response
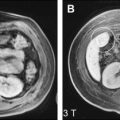
Quantitative and semiquantitative perfusion indices have been used to evaluate tumor response to treatment. Miyazaki and colleagues applied HPI for assessing the efficacy of antiangiogenic therapy ( Fig. 3 ). They found that HPI was measurably decreased by 15% at 28 days after antiangiogenic treatment in patients who responded to treatment using standard Response Evaluation Criteria in Solid Tumors (RECIST) size criteria. By model fitting, Chen and colleagues found using the perfusion CT technique that the hepatic arterial fraction, hepatic artery perfusion, and hepatic blood volume all significantly decreased following chemoembolization of hepatic malignancy. Thus, the potential of using model-based approaches for assessing the effects of antiangiogenic or antivascular treatment is being evaluated. In a study of patients receiving an antiangiogenic drug in a phase I clinical trial, Morgan and colleagues found a significant negative correlation between the percentage change in the inflow rate constant (K i ) and the dose of the drug administered.

Liver cirrhosis
Increase in hepatic artery perfusion and decrease in portal venous perfusion have been shown in various CT and MR perfusion studies. The HPI has been shown to increase in cirrhotic liver.
Thus, MR liver perfusion imaging provides unique functional information about the microcirculation of the liver parenchyma and focal liver lesions. However, most published studies are from single institutions with small study cohorts. Hence, there is a cogent need for further validation by conducting such studies in larger populations across multicenter sites.
DW MR imaging of the liver
DW MR imaging is emerging as a powerful technique for the evaluation of hepatic diseases. DW MR imaging is a robust imaging technique that can be implemented on most modern MR imaging platforms. Widely available vendor software applications make it possible to obtain quantitative data with relative ease.
Biologic Basis for MR Measurements
The mechanism of contrast of DW MR imaging is based on differences in the mobility of water protons between tissues. Water diffusion is a thermally driven process characterized by random motion of water molecules. However, in biologic tissues, the motion of such molecules is modified by their interaction with cell membranes and macromolecules. Hence, water diffusion in tissues reflects the tortuosity of the extracellular space, tissue cellularity, integrity of cell membranes, and fluid viscosity.
Cellular tissues show lesser degrees of signal attenuation with increasing diffusion weighting (b-values), and hence are conspicuous on DW MR imaging, thus facilitating their detection. By quantitative evaluation, cellular tissues usually return lower apparent diffusion coefficients (ADC), indicating impeded water diffusivity. However, because DW MR imaging discriminates tissues by water diffusion, the technique is not specific for malignancy.
Technical and Imaging Considerations
A detailed discussion of the technical aspects of DW MR imaging is beyond the scope of this article. The reader is referred to published works related to the topic. A typical imaging sequence protocol is presented in Table 3 .
Related posts:
 MR Imaging of Benign Focal Liver Lesions
MR Imaging of Hepatocellular Carcinoma
Diffusion-Weighted MRI and Liver Metastases
MR Imaging of Benign Focal Liver Lesions
MR Imaging of Hepatocellular Carcinoma
Diffusion-Weighted MRI and Liver Metastases
 MR Imaging Evaluation of the Hepatic Vasculature
 Imaging at Higher Magnetic Fields: 3 T Versus 1.5 T
 Magnetic Resonance Imaging of the Liver: Sequence Optimization and Artifacts
Stay updated, free articles. Join our Telegram channel

Full access? Get Clinical Tree


