Fig. 2.1
a A Zeiss AxioVision setup with a mounted camera and robotic stage. b A 3DHistech high-volume slide scanner (courtesy of HistoGeneX)
Technology has by now become sufficiently specialized so that some companies only sell complete integrated systems (scanners). However, others sell individual components as well. Examples of the latter are Hamamatsu, which sells its own nanozoomer slide scanner as an integrated system, but also sells its components to TissueGnostics for their automated solutions.
2.2 How Do Slide Scanners Work?
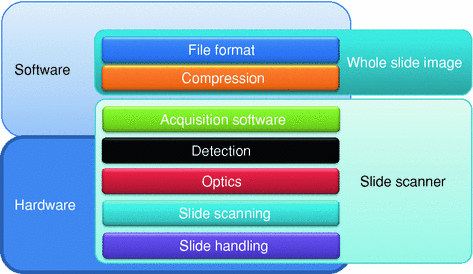
Slide scanners are the highest level of abstraction for digital microscopy. They have both a hardware and software components. We distinguish five levels, from lowest to highest: slide handling, slide scanning, optics, detection, and, finally, acquisition software. These five levels are depicted in Fig. 2.2.


Fig. 2.2
Different layers of processing in digital pathology
The first slide scanner was designed by James Bacus in 1994, during a period of rapid Internet expansion worldwide. The corresponding BLISS system, which is now recognized as having been the first virtual microscopy system ever developed, was designed to generate virtual microscope slides. Meanwhile, a WebSlide Server, Browser, and ActiveX Viewer were developed to allow for viewing virtual microscope slides over the Internet. Over the next several years, the Bacus group developed and patented the methods and apparati to perform automated assays of biological specimens, immunoploidy analysis, measurements of tissue thickness, and tests of neoplasm progression, as well as devices to allow for the remote control of microscopes, the creation of virtual microscopy slides, the magnification of specimen images, and the Internet, intranet, and local viewing of such slides [1–19]. Moreover, Bacus Laboratories not only created the first virtual slide system, they also created the first market for it. They did this by framing their system as an educational tool. Their plan was to ultimately replace standard microscopes with virtual microscopy in medical education. They achieved this by combining their virtual microscopy system with a collection of educational “slides,” for which institutions could lease access licenses annually. Because of its successful business model, Bacus Laboratories was purchased by Olympus America Inc. in 2006.
In terms of features, the capacities of slide scanners today vary widely. For example, some can do bright-field images only, some can do fluorescence images only, and some can do both. The price of a model generally correlates with its slide-loading capacity, which can range from one to 400 slides per batch. Slides can be handled as a single slide/stage, as standalone autoloaders (“hotels”), as slide trays, or as slide magazines. The type of slide can vary as well: While most scanners today still handle basic 1” × 3” slides only, others—like Aperio and Huron Technologies—also support 2” × 3” and even larger (whole mount) slides. The more variability that is allowed for physical slide media, the harder it is to batch process large numbers of slides.
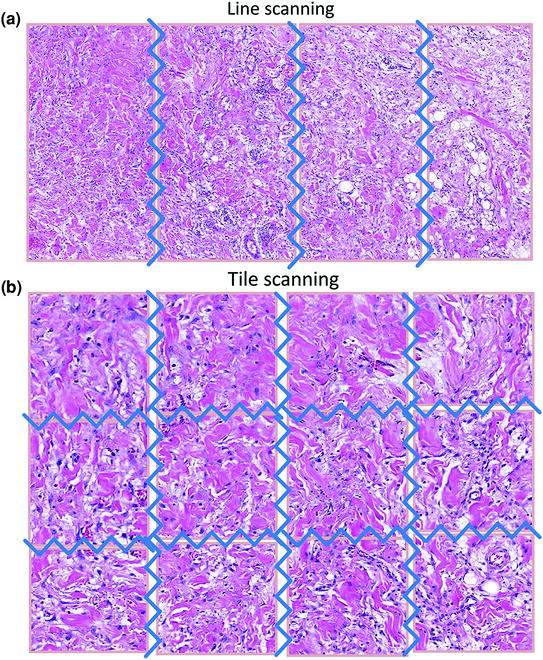
Two approaches exist to scanning a slide: tile scanning (Bacus patents) [20] and line scanning (Aperio patents) [21]. In both cases, the resulting images (tiles or strips) are fitted together into a single large image (i.e., the WSI). With a tile scanner, the slide is scanned as a series of rectangular tiles. For each tile, the highest physical magnification desired is used (e.g., 40× or 20×). The tiles are then stacked into a WSI, like bricks forming a wall. This is done either concurrently with or after the scanning process, via the acquisition software. Conversely, with line scanning, after magnification, strips are combined side by side into a single image. Proponents of the latter approach claim that it generates fewer seams and, hence, fewer optical aberrations (Fig. 2.3).


Fig. 2.3
a/b Line versus tile scanning: note the huge decrease in the number of seams with line scanning
One particular problem related to scanning is focusing. A pathologist looking through a microscope automatically adjusts the focus depending upon the area of the slide he or she is looking at, the thickness of the specimen, the type of glass slide used, etc. With a scanner, this process must be automated. With both tile and line scanners, it is possible to autofocus each field after moving the stage, but this can be very time-consuming, especially with tile scanners. A better approach is to focus on every nth field being scanned. This is both faster and simpler; but the placement of focus points lacks context, and it is still possible to waste time on larger areas that, by chance, do not require refocusing. A focus map is another solution. With this approach, focus points are distributed over the tissue forming a surface. Focus is only recalculated for intervening tissue. The number of selected focus points can be controlled via the scanner software. A trade-off is usually made between more focus points (less speed) and greater accuracy. The settings can be tissue dependent, and a technician can maintain a preset list of “profiles” that can be referred to, depending upon the type of specimen that needs to be scanned.
Z-stacking is becoming increasingly commonplace, but this poses its own unique challenges to file format organization (see later in this chapter). The new frontier is now spectral imaging.
2.3 Virtual Slide Formats
2.3.1 How Are WSI Data Organized?
After the acquisition software in the scanner obtains a digital image representation of a slide, it needs to store this information somewhere. This again can be seen as a two-step process, whereby first data compression takes place, and subsequently data are stored, usually in a vendor-specific file format.
Digital slide image formats typically consist of one or more files that contain high-resolution scanned areas as well as image information in the form of metadata. The resolution of such images varies, but usually ranges from ten to hundreds of thousands of pixels per dimension (width, height). Various techniques are currently employed to make it easier and quicker to process such images using computer software.
2.3.2 The Pyramidal Format
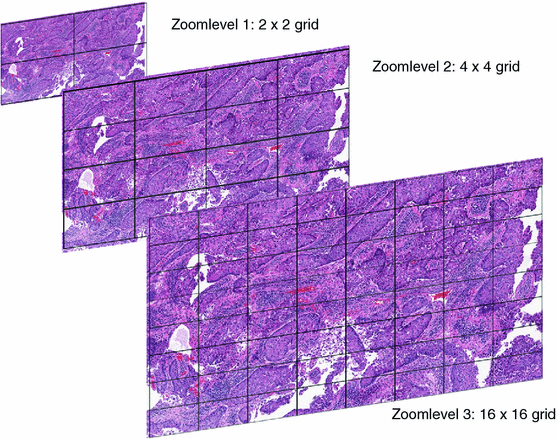
Scaled versions of the original image (called “zoom levels”) are often created and stored in a single-“container” format. This is usually called a “pyramidal format,” since every scaled-down image is smaller than its previous level, just like a pyramid gets smaller and smaller the higher up you go. By storing pre-computed scaled-down versions of the high-resolution image, a computer program can quickly render a smaller version of the image by reading pixel data from the zoom level closest to the scale currently being displayed (Fig. 2.4).


Fig. 2.4
A pyramidal stack represented symbolically on a sample whole slide image
The pyramidal format increases display performance at the cost of storage efficiency. For this reason, many vendors try to minimize the actual scan area that is being stored. This is done by spotting the significant areas while scanning the slide and only storing these in high resolution. This leads to a digital slide image with many sparse high-resolution areas, which may follow the pyramidal format independently. For different tissue types, the tissue detection parameters (called “profiles” by some vendors) often must be fine-tuned.
2.3.3 Tiles
To further optimize random access and minimize disk read operations (input/output or I/O), digital slides split the image into smaller rectangular areas (tiles). Every zoom level is therefore a grid of tiles of the same size. When a computer program needs to display a small part of a high-resolution image, it is able to reduce the data being read by selecting only those tiles that intersect with the current viewport.
Slide scanning is performed in steps. The scanner’s camera moves along the slide and takes pictures which are then stitched together by the scanner’s software. Some vendors decide to store overlapping images of the slide and let the viewing software do the stitching. This is done because selecting stitching offsets that depend on the visible parts of the image every time may reduce stitching artifacts. This, in turn, would have otherwise been introduced if stitching had happened during scanning. In this case, stitching hints are stored as metadata along with the image.
Regardless of when the stitching process takes place (during scanning or while the image is viewed), images acquired by the scanner require adjustments. Overlapping regions might have differences in brightness and contrast, known as shading, due to the different positions of the camera each time a photograph is taken. Various techniques are employed to address this issue, such as blending and histogram equalization.
2.3.4 Color Spaces
The most common illumination techniques found in digital slides are bright-field and fluorescence. Bright-field microscopy images typically store pixels in the red, green, and blue (RGB) model (color space) or YCBCR


Stay updated, free articles. Join our Telegram channel

Full access? Get Clinical Tree


