1 Hemodynamic Considerations in Peripheral Vascular and Cerebrovascular Disease
Physiologic Factors Governing Blood Flow and Its Characteristics
Energy and Pressure
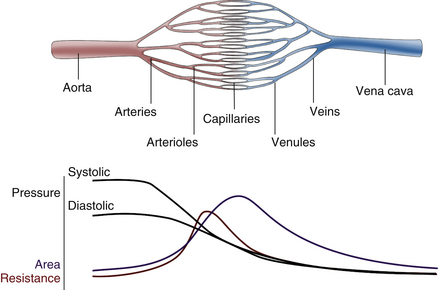
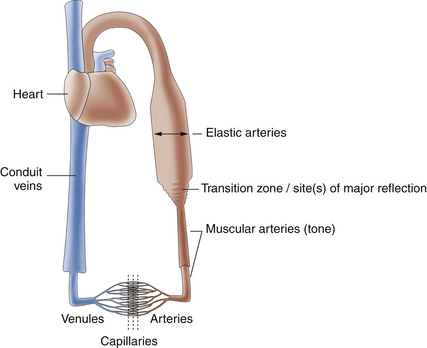
For blood flow to occur between any two points in the circulatory system, there must be a difference in the energy level between these two points. Usually, the difference in energy level is reflected by a difference in blood pressure, and the circulatory system generally consists of a high-pressure, high-energy arterial reservoir and a venous pool of low pressure and energy. These reservoirs are connected by a system of distributing vessels (smaller arteries) and by the resistance vessels of the microcirculation, which consist of arterioles and to a lesser extent the capillaries (Figure 1-1).
Forms of Energy in the Blood and its Dissipation During Flow
This section considers the forms in which energy exists in the circulation and the important factors that govern the dissipation of energy during flow, including friction, resistance, and the influence of laminar and turbulent flow. In addition to reviewing Bernoulli’s equation and Poiseuille’s law, an equation that summarizes the basic relationships between flow, pressure, and resistance, this chapter also reviews the effects of connecting vascular resistances in parallel and in series.
Forms of Energy
Potential and Kinetic Energy
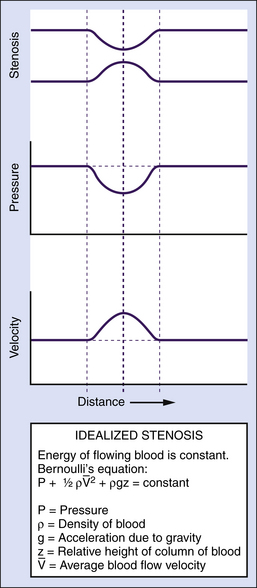
The main form of energy present in flowing blood is the pressure distending the vessels (a form of potential energy), which is created by the pumping action of the heart. However, some of the energy of the blood is kinetic; namely, the ability of flowing blood to do work as a result of its velocity. Usually, the kinetic energy component is small compared with the pressure energy, and under normal resting conditions, it is equivalent to only a few millimeters of mercury or less. The kinetic energy of blood is proportional to its density (which is stable in normal circumstances) and to the square of its velocity. In essence, over relatively straight arterial segments, this balance of kinetic (blood flow) and potential (blood pressure) energy is maintained. The equation that summarizes this relationship is Bernoulli’s equation (Figure 1-2). If the artery lumen increases, kinetic energy is converted back into pressure (potential energy) when velocity is decreased. Conversely, if the artery lumen narrows, the potential energy is converted into kinetic energy. Therefore, within certain limits, important increases in kinetic energy occur in the systemic circulation when blood flow is high (e.g., during exercise) and in mildly stenotic lesions where luminal narrowing leads to increases in blood flow velocities. The effects of gravity due to differences in height of the blood vessel are normally neglected over short arterial segments.
Dissipation of Energy
During Laminar Flow
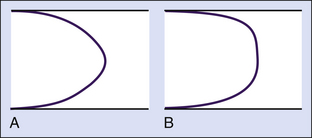
In most vessels, blood moves in concentric layers, or laminae; hence the flow is said to be laminar. Each infinitesimal layer flows with a different velocity. In theory, a thin layer of blood is held stationary next to the vessel wall at zero velocity because of an adhesive force between the blood and the inner surface of the vessel. The next layer flows with a certain velocity, but its movement is delayed by the stationary layer because of friction between the layers, generated by the viscous properties of the fluid. The second layer, in turn, delays the next layer, which flows at a greater velocity. The layers in the middle of the vessel flow with the highest velocity, and the basic physics underlying this effect are such that the mean velocity averaged across the vessel is half of the maximal velocity measured in the center. Because the rate of change of velocity is greatest near the walls and decreases toward the center of the vessel, a velocity profile in the shape of a parabola exists along the vessel diameter, and this type of blood flow is typically referred to as laminar flow (Figure 1-3).
Poiseuille’s Law and Equation
 (1-1)
(1-1)where Q is the volume flow; P1 and P2 are the pressures at the proximal and distal ends of the tube, respectively; r and L are the radius and length of the tube, respectively; and η is the viscosity of the fluid.
Poiseuille’s equation can be rewritten, therefore, as follows:
 (1-2)
(1-2) (1-3)
(1-3) (1-4)
(1-4)The resistance term (R) depends on the viscous properties of the blood and on the dimensions of the vessels. Although these parameters cannot be measured in a complex system, the pressure difference (P1 − P2) and the volume flow (Q) can be measured, and the resistance can thus be calculated. Because resistance is equal to the pressure difference divided by the volume flow (the pressure difference per unit flow), it can be thought of as the pressure difference needed to produce one unit of flow and, therefore, can be considered as an index of the difficulty in forcing blood through the vessels.
During Nonlaminar Flow
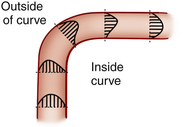
Various degrees of deviation from orderly laminar flow occur in the circulation under both normal and abnormal conditions. Minor factors responsible for these deviations include changes in blood flow velocity during the cardiac cycle as a result of acceleration during systole and deceleration in diastole and alterations of the lines of flow due to small changes in the diameter of the vessel. Alterations in the blood flow profiles occur at curves (Figure 1-4), at bifurcations, in branches that take off at various angles, and at stenotic lesions. Once altered, the laminar (parabolic) velocity profile is often not reestablished for a considerable distance. Instead, the velocity distributions can remain skewed after curves and branches or flattened within and just distal to stenotic lesions (plug flow) (see Figure 1-3, B).
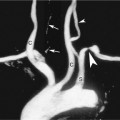
In certain circumstance, laminar flow can evolve into a blood flow pattern that is mixed: a flow profile that has both forward and backward flow velocity components across the diameter of the artery. The transition zone where the lamina reach zero velocity is then referred to as the site of boundary layer separation. This phenomenon can occur at branch points and is classically described at the carotid artery bifurcation (Figure 1-5). Another situation is distal to stenotic lesions.
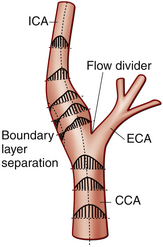
At the carotid bifurcation, the blood flow profile in the distal common carotid artery tends to diverge toward the internal carotid artery and then to evolve a zone of boundary layer separation in the proximal internal carotid artery (see Figure 1-5).
 (1-5)
(1-5)where v is the velocity, ρ is the density of the fluid, r is the radius of the tube, and η is the viscosity of the fluid. Because the density (ρ) and viscosity (η) of the blood are relatively constant at 1.04 to 1.05 g/cm3 and 0.03 to 0.05 poise (g/[cm sec]), respectively, the development of turbulence depends mainly on the size of the vessel and on the velocity of blood flow. In a tube model, laminar flow tends to be present if the Reynolds number is less than 2000, is considered in transition between 2000 and 4000, and is absent as turbulence is established at values above 4000. However, in the circulatory system, disturbances and various degrees of turbulence are likely to occur at lower values because of body movements, the pulsatile nature of blood flow, changes in vessel dimensions, roughness of the endothelial surface, and other factors. Turbulence develops more readily in large vessels under conditions of high flow and can be detected clinically by the finding of bruits or thrills. This would typically be seen in dialysis access fistulas. Bruits may sometimes be heard over the ascending aorta during systolic acceleration in normal individuals at rest and are frequently heard in states of high cardiac output and blood flow, even in more distal arteries, such as the femoral artery.1 Distortion of laminar flow velocity profiles can be assessed using Doppler ultrasound, and such assessments can be applied for diagnostic purposes. For example, in arteries with severe stenosis, pronounced turbulence is a diagnostic feature observed in the poststenotic zone. This is typically associated with soft tissue vibrations in the range of 100 to 300 Hz.2
Turbulence occurs because a jet of blood with high velocity and high kinetic energy suddenly encounters a normal-diameter lumen or a lumen of increased diameter (because of poststenotic dilatation), where both the velocity and energy level are lower than in the stenotic region. During turbulent flow, the loss of pressure energy between two points in a vessel is greater than that which would be expected from the factors in Poiseuille’s equation and Bernoulli’s equation (see Figure 1-2), and the parabolic velocity profile is flattened (see Figure 1-3, B).
Pulsatile Pressure and Flow Changes in the Arterial System
Correct interpretation of noninvasive tests based on recordings of arterial pressure and velocity, as well as pressure and velocity waveforms, requires knowledge of the factors that influence these variables. This section considers these factors as they occur in various portions of the circulatory system.
Pressure Changes From Cardiac Activity
As indicated previously, the pumping action of the heart maintains a high volume of blood in the arterial end of the circulation and thus provides the high pressure difference between the arterial and venous ends necessary to maintain blood flow. Because of the intermittent pumping action of the heart, pressure and flow vary in a pulsatile manner. During the rapid phase of ventricular ejection, the volume of blood at the arterial end increases, raising the pressure to a systolic peak. During the latter part of systole, when cardiac ejection decreases, the outflow through the peripheral resistance vessels exceeds the volume being ejected by the heart, and the pressure begins to decline. This decline continues throughout diastole as blood continues to flow from the arteries into the microcirculation. Part of the work of the heart leads directly to forward flow, but a large portion of the energy of each cardiac contraction results in distention of the arteries that serve as reservoirs for storing the blood volume and the energy supplied to the system (Figure 1-6). This storage of energy and blood volume helps maintain blood flow to the tissues during diastole.
Arterial Pressure Wave
The arterial pressure wave is propagated from the heart distally along the arterial tree. The speed of propagation, or pulse wave velocity, increases with stiffness of the arterial walls (the elastic modulus of the material of which the walls are composed) and with the ratio of the wall thickness to diameter. In the mammalian circulation, arteries become progressively stiffer from the aorta toward the periphery. Therefore, the speed of propagation of the wave increases as it moves peripherally. Also, the gradual increase in stiffness tends to increase wave reflection (discussed later) and in young people has a protective effect by decreasing central aortic pressures. With aging, the degree of stiffening increases to such a degree that the reflected waves return earlier and have a detrimental effect by increasing the pulse and systolic pressures in the aorta.3–5
Related posts:
 Normal Cerebrovascular Anatomy and Collateral Pathways
 Ultrasound Assessment of Lower Extremity Arteries
 Ultrasound Assessment of the Vertebral Arteries
 Arterial Anatomy of the Extremities
 Duplex Ultrasound Evaluation of the Uterus and Ovaries
 Extremity Venous Anatomy and Technique for Ultrasound Examination
Stay updated, free articles. Join our Telegram channel

Full access? Get Clinical Tree


