Chapter 12
Hepatic fat and iron deposition
Ersan Altun1, Mohamed El-Azzazi1,2,3,4, and Richard C. Semelka1
1The University of North Carolina at Chapel Hill, Department of Radiology, Chapel Hill, NC, USA
2University of Dammam, Department of Radiology, Dammam, Saudi Arabia
3King Fahd Hospital of the University, Department of Radiology, Khobar, Saudi Arabia
4University of Al Azhar, Department of Radiology, Cairo, Egypt
Fatty liver disease
- Fatty liver disease is the most common chronic liver disease in North America and its prevalence is about 15% in the general population.
- It results from the accumulation of triglycerides within the cytoplasm of hepatocytes.
- The two most common conditions associated with fatty liver are alcoholic liver disease and nonalcoholic fatty liver disease.
- Alcoholic liver disease is caused by excess alcohol consumption.
- Nonalcoholic fatty liver disease is associated with insulin resistance and metabolic syndrome. Therefore, diabetes mellitus and obesity are risk factors for nonalcoholic fatty liver disease. Additionally, viral hepatitis, some toxins, drugs including steroids, rapid weight loss, malnutrition, and some congenital disorders including glycogen storage disorders also cause fatty liver.
- Clinical presentation:
- Usually asymptomatic
- May be associated with hepatomegaly, right upper quadrant abdominal pain, or elevated liver function tests
- Forms:
- Diffuse fatty deposition
- Focal deposition with focal sparing
- Multifocal deposition
- Subcapsular deposition
- On CT:
- Fatty deposition in the liver causes lower attenuation in the liver, which is lower than that of the spleen. Quantitatively, absolute liver density measuring less than 40 HU or more than 10 HU relative density decrease of the liver compared to the spleen suggests fat deposition in the liver on precontrast images. Additionally, more than 25 HU density decrease of the liver compared to the spleen suggests fat deposition in the liver on postcontrast images on the hepatic venous phase.
- It results from the accumulation of triglycerides within the cytoplasm of hepatocytes.
- On MRI:
- Three different techniques are used for fat detection and quantification.
- Chemical shift imaging
- Fat suppression
- MR spectroscopy
- Chemical shift imaging
- Chemical shift imaging including in-phase and out-of-phase gradient echo imaging is the most commonly used fat detection method in the liver. Chemical shift imaging is based on the detection of signal loss on out-of-phase T1-gradient echo sequence compared to in-phase T1-gradient echo sequence due to the presence of microscopic fat. This arises from the different precessional frequencies of fat and water protons; the opposite phase of fat and water protons located in the same voxel leads to signal loss of fat-and-water containing structures, compared to in-phase T1-gradient echo sequence, in which fat and water protons are in-phase with one another. The relative signal loss on out-of-phase image, which is approximately 16%, suggests the presence of fat with high accuracy. The presence of macroscopic/abundant fat does not cause signal loss on out-of-phase images, but creates a signal void (also termed as India ink) artifact at water-fat interfaces. To minimize T2* signal decay effects, chemical shift imaging should be performed with the shortest possible TE times and at 1.5 T. The out-of-phase gradient echo sequence should be acquired with a shorter TE than the in-phase sequence.
- Fat suppression techniques include either fat saturation or water excitation. With the use of these techniques, tissues containing macroscopic fat show maximal fat signal loss when fat represents near 100% of the tissue on T1- and T2-weighted sequences. This is in contrast to chemical shift imaging where signal loss is maximal when fat and water are approximately 50% each in the volume of tissue.
- These three methods are also used for fat quantification. Chemical shift imaging is a successful method for fat quantification. The accuracy of chemical shift imaging for fat quantification is increased with the use of techniques minimizing T1-weighting and correcting T2* signal decay. MR spectroscopy is the most specific technique for fat quantification, although it is not practical due to its small volume sampling (single voxel technique) and long acquisition times (multivoxel technique). The accuracy of fat quantification with MR spectroscopy can be improved by obtaining spectra at multiple echo times and correcting for the T2* decay.
- Fat quantification is performed with the calculation of fat signal fraction with the following formula: Fat Signal Fraction = Fat Signal/Water Signal + Fat Signal.
- Chemical shift imaging may quantify fat content in the liver with the calculation of fat signal fraction based on the following formulae:
- Signal (In-phase) = Water signal + Fat signal
- Signal (Out-of-phase) = Water signal − Fat signal
- Fat Signal Fraction = Signal (In-phase) − Signal (Out-of-phase)/2 Signal (In-phase)
- Diffuse Fat Deposition
- Diffuse fat deposition may be uniform or heterogeneous.
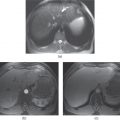
- The liver shows prominent decreased density on CT and the portal/hepatic vessels appear hyperdense compared to steatotic liver parenchyma (Figure 12.1).
- The liver shows decreased signal on out-of-phase images compared to in-phase images (Figures 12.1–12.5).
- FNH and metastases are the most common focal lesions associated with diffuse fatty liver.
- Nonfat-suppressed T1-WIs and fat-suppressed T2-WIs maximize the contrast between the background liver and focal lesions.
- On nonfat-suppressed T1-WIs, the fatty liver may be higher in signal intensity than normal liver, maximizing the contrast with low signal intensity masses.
- On fat-suppressed T2-WIs, fatty liver is lower in signal intensity than normal liver, maximizing the contrast with moderately high signal intensity masses.
- On postgadolinum fat-suppressed T1-weighted images, simple fat deposition shows comparable enhancement to background liver, which is a critical observation. Many fatty lesions (e.g., hepatic adenomas, HCC) show greater enhancement than background liver on the hepatic arterial dominant phase images.
- Focal Fat Deposition
- Commonly occurs adjacent to the falciform ligament, central tip of segment IV, gallbladder, and portal/hepatic veins (Figures 12.6 and 12.7).
- Characterized by:
- Lack of mass effect; as shown by no displacement of adjacent or internal vessels and no focal bulging of the liver contour.
- The presence of traversing internal vessels.
- The morphology of focal fat usually has angular, wedge-shaped margins, and the region may or may not be well demarcated.
- Variations in blood supply and anomalous vessels may often account for focal fat or sparing. The common occurrence of anomalous vessels in the tip of segment IV and along the ligamentum teres explains the frequent observation of differing fat content in these regions.
- The morphology of focal fat usually has angular, wedge-shaped margins, and the region may or may not be well demarcated.
- On in-phase: Isointense or hyperintense to surrounding background parenchyma.
- On out-of-phase: Shows loss of signal.
- On postgadolinium images:
- Shows similar enhancement compared to background liver.
- Minimally lesser enhancement most often reflects a fat suppression effect rather than a contrast wash-out, but careful distinction between these two is warranted.
- Focal Fat Sparing
- An area of normal liver in the setting of diffuse fatty infiltration.
- Commonly occurs adjacent to the falciform ligament, central tip of segment IV, gallbladder and portal/hepatic veins (Figure 12.8).
- Appears as an area of high signal intensity on out-of-phase images compared to the darker diffusely fatty background liver.
- Focal fat sparing may be due to arterioportal shunting, decreased portal perfusion, focal inflammation/biliary ductal dilatation (Figure 12.9), and compression of liver parenchyma by focal liver lesions (Figure 12.10).
- Focal fat sparing may mimic an enhancing lesion; however, the identification of high signal on precontrast out-of-phase T1-weighted images and the absence of increased enhancement relative to background liver, which may be determined with the help of region of interest measurements or subtraction images, are helpful for the differentiation.
- Multifocal Fat Deposition
- An uncommon pattern, which is characterized by multiple foci of fat scattered throughout the liver (Figures 12.11–12.14).
- Heterogeneous and multifocal deposition may be seen in patients with NAFLD and NASH, and may be associated with inflammatory and fibrotic changes (Figures 12.11–12.13).
- The foci may be round or oval and may mimic nodules (Figure 12.14).
- These foci show signal loss on out-of-phase images compared to in-phase images.
- On postgadolinium images, these lesions demonstrate similar enhancement compared to background liver parenchyma.
- Differential diagnosis of multifocal fat deposition:
- Multifocal hepatic adenomatosis
- Fat containing regenerative nodules
- Subcapsular Deposition
- Observed in patients with renal failure and insulin-dependent diabetes.
- The insulin added to the peritoneal dialysate in these patients results in peripheral and subcapsular deposition in the liver.
- These three methods are also used for fat quantification. Chemical shift imaging is a successful method for fat quantification. The accuracy of chemical shift imaging for fat quantification is increased with the use of techniques minimizing T1-weighting and correcting T2* signal decay. MR spectroscopy is the most specific technique for fat quantification, although it is not practical due to its small volume sampling (single voxel technique) and long acquisition times (multivoxel technique). The accuracy of fat quantification with MR spectroscopy can be improved by obtaining spectra at multiple echo times and correcting for the T2* decay.
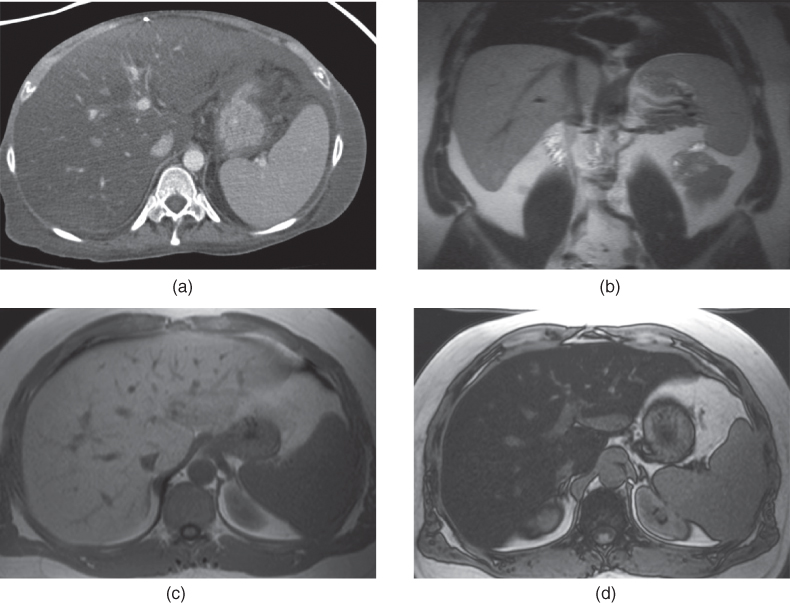
Figure 12.1 Transverse postcontrast CT (a), coronal T2-weighted SS-ETSE (b), transverse T1-weighted in-phase (c) and out-of-phase (d) 2D-GE images demonstrate diffuse fatty liver.
Related posts:
Stay updated, free articles. Join our Telegram channel

Full access? Get Clinical Tree


