Technical Aspects
Diagnostic imaging of the hepatobiliary system, with multidetector computed tomography (MDCT) and magnetic resonance imaging (MRI), plays a major role in hepatobiliary surgery, helping to choose the best therapeutic approach, reduce complications, and identify the anatomy requiring special attention at surgery.
Anatomic variants of the biliary and hepatic vascular anatomy are common; they dictate the surgical technique and also may predict the risk for postsurgical complications, in both the case of complex surgeries, such as liver transplantation, and of more common procedures, such as laparoscopic cholecystectomy.
MDCT and MRI, especially when hepatobiliary contrast agents are used (e.g., gadolinium ethoxybenzyl diethylenetriamine pentaacetic acid [Gd-EOB-DTPA], gadobenate dimeglumine [Gd-BOPTA], mangafodipir trisodium), clearly visualize both biliary and arterial anatomic variants, with a high degree of correlation with intraoperative cholangiography and digital subtraction angiography.
Pros and Cons
Contrast-enhanced MDCT and MRI are noninvasive techniques that permit angiographic and parenchymal evaluation of the liver.
MDCT and MR angiography have shown excellent correlation with catheter angiography but are devoid of its invasiveness and many of its complications. Moreover, the radiation burden is reduced in MDCT when compared with catheter angiography and absent in the case of MRI.
Because of the availability of biliary excreted contrast agents, cholangiography now can be performed in a noninvasive way by both MDCT and MRI. Currently, MDCT cholangiography, owing to the higher spatial resolution, allows better visualization of second-order bile ducts than MR cholangiography.
MDCT, MR angiography, and MR cholangiopancreatography (MRCP) protocols, used at our institution, are summarized in Tables 44-1 to 44-3 . Raw data, obtained from MDCT and MRI are postprocessed to maximize the information they can provide; and multiplanar reformatted, three-dimensional reconstruction, maximum intensity projection (MIP), and volume rendering images are obtained.
| Protocol | Hepatic Arterial Phase | Venous Phase |
|---|---|---|
| Range | Entire liver | Entire liver |
| Scan delay | 20-25 sec after start of bolus injection | 60-65 sec |
| Empirical bolus tracking | Automatically triggered at 125 HU in aorta at the celiac artery level | |
| Pitch | 1-1.5 | 1-1.5 |
| Slice thickness | 1-2 mm | 2-5 mm |
| Kilovoltage peak | 120-140 | 120-140 |
| Milliamperes | 200-280 | 200-280 |
| Image reconstruction thickness | 1-2 mm and 50% overlap | 2-5 mm and 50% overlap |
| Protocol | Hepatic Arterial Phase | Venous Phase | Delayed Venous Phase |
|---|---|---|---|
| Scan delay | 15-18 sec | 60 sec | 180 sec |
| TR/TE | Minimum/ 15 ms | Minimum/ 15 ms | Minimum/ 15 ms |
| Flip angle | 100 degrees | 100 degrees | 100 degrees |
| Field of view | 400 mm | 400 mm | 400 mm |
| Effective section | 2-4 mm | 2-4 mm | 2-4 mm |
| Matrix | 160 × 256 | 160 × 256 | 160 × 256 |
| Protocol | T2-Weighted MRCP | 3D SPGR |
|---|---|---|
| Scan delay | None | Gd-BOPTA: 60 min Gd-EOB-DTPA: 20 min |
| TR/TE | 2800-3300/900-1100 ms | 6.5/2.1 ms |
| Flip angle | 0 degrees | 15 degrees |
| Field of view | 400 mm | 400 mm |
| Effective section | 60 mm | 2.4 mm |
| Orientation | Coronal oblique | Axial and coronal |
| Matrix | 160 × 256 | 160 × 256 |
Controversies
Whether MDCT or MRI is the better modality by which to assess hepatic variants remains unclear. Both methods have undergone rapid improvement, and each bears inherent advantages and disadvantages. Currently, the choice of a specific modality over the other is largely dictated by institutional preferences.
Normal Anatomy
Anatomic variants of the biliary, hepatic arterial, hepatic venous, and portal venous anatomy are common. Classic biliary and hepatic arterial anatomy is found in only 58% and 55% of the population, respectively. To understand anatomic variants, a brief description of normal anatomy is provided.
Liver
The liver ( Figure 44-1 ) is a large, wedge-shaped parenchymal organ that occupies most of the right hypochondrium and epigastrium and extends to the left epigastrium with its narrow end. The falciform ligament, the ligamentum teres, and the ligamentum venosum divide the liver into a large right lobe and a smaller left lobe. This anatomic description does not correlate with functional hepatic anatomy and is therefore inadequate for interventional radiology and surgery. Rather, functional anatomy of the liver is based on the vascular and biliary territories ( Figure 44-2 ). Cantlie’s line, running on a coronal oblique plane oriented 75 degrees toward the left, from the middle of the gallbladder to the left side of the inferior vena cava (IVC), divides the liver into right and left. Grossly, this yields the right liver and the left liver, which are two separate functional units, with independent vascular inflows and outflows and autonomous biliary drainage. The middle hepatic vein (MHV) lies along the cranial continuation of Cantlie’s line. The right hepatic vein (RHV), MHV, and left hepatic vein (LHV) divide the liver into four sectors, each one supplied by an independent portal pedicle. They are the posterolateral and anteromedial sectors in the right liver and the posterior and anterior sectors in the left liver. The posterior sector is undivided and constitutes segment II. The anterior sector is divided by the umbilical fissure into a medial segment (IV) and a lateral segment (III). A transverse plane at the level of the main portal bifurcation divides the posterolateral sector into a posterior (VII) and an anterior segment (VI), the anteromedial sector into an anterior (V), and a posterior segment (VIII) and subdivides segment IV into a posterior (IVa) and an anterior segment (IVb). The caudate lobe constitutes segment I, or the Spigel lobe, which, owing to its autonomous vascularization, is considered separate from the others.
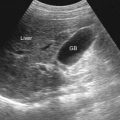
An ultrasound image of normal liver presents a homogeneous pattern of low-level echoes. Vessels and biliary ducts are anechoic ( Figure 44-3 ).
On unenhanced MDCT, the liver exhibits homogeneous intermediate attenuation (50 to 75 Hounsfield units), similar to that of the spleen ( Figure 44-4 ). Vessels and biliary ducts are hypodense. During contrast-enhanced imaging, liver attenuation values progressively increase, with peak enhancement occurring during the portal and hepatic venous phases of enhancement. Maximal arterial enhancement occurs during hepatic arterial phase, usually around 30 seconds after the start of contrast injection; the portal and hepatic veins maximally enhance at approximately 70 seconds after contrast injection. Biliary ducts are unopacified, unless contrast media with biliary excretion are administered.
At MRI, the signal intensity of the normal liver varies by sequence. It presents hyperintense to the spleen on T1-weighted images, hypointense on T2-weighted images, and is always homogeneous ( Figure 44-5 ).
Normal liver enhances homogeneously and transiently after administration of nonspecific gadolinium (Gd)-based contrast media, such as gadopentetate dimeglumine (Gd-DTPA). In contrast, hepatic-specific contrast agents are taken up by liver cells. Reticuloendothelial system–specific contrast agents, composed of iron microparticles, are taken up by Kupffer cells, with resultant reduction of the signal intensity of the liver on T2*-weighted images. Hepatocyte-specific contrast agents include gadoxetic acid (Gd-EOB-DTPA) and gadobenate dimeglumine (Gd-BOPTA), which are selectively taken up by hepatocytes without being metabolized, with resultant progressive increased signal intensity on delayed T1-weighted images and subsequent excretion into, and enhancement of, the biliary system. Biliary excretion accounts for approximately 50% of the administered Gd-EOB-DTPA dose, compared to 5% for Gd-BOPTA. It should be noted that Gd-EOB-DTPA is administered at one-quarter the recommended clinical dose (0.025 mmol/kg vs. 0.1 mmol/kg) compared to nonspecific gadolinium contrast agents because of its relatively high relaxivity; this low clinical dose of Gd-EOB-DTPA may lead to less conspicuous vascular enhancement during arterial and venous phases, as well as to bolus injection/acquisition timing errors because of the small injection volume.
Hepatic Arterial Anatomy
The classic hepatic arterial anatomy, characterized by the proper hepatic artery dividing into right and left hepatic arteries, is observed in approximately 55% of the population ( Figure 44-6 ). The Michel classification of hepatic arterial variant anatomy is illustrated in Table 44-4 .
| Type | Frequency (%) | Description |
|---|---|---|
| I | 55 | RHA, MHA, LHA arise from CHA |
| II | 10 | RHA, MHA, and LHA from CHA; replaced LHA from LGA |
| III | 11 | RHA and MHA from CHA, replaced RHA from SMA |
| IV | 1 | Replaced RHA and LHA |
| V | 8 | RHA, MHA, LHA arise from CHA; accessory LHA from LGA |
| VI | 7 | RHA, MHA, LHA arise from CHA; accessory RHA |
| VII | 1 | Accessory RHA and LHA |
| VIII | 4 | Replaced RHA and accessory LHA or replaced LHA and accessory RHA |
| IX | 4.5 | Entire hepatic trunk from SMA |
| X | 0.5 | Entire hepatic trunk from LGA |
Related posts:

Stay updated, free articles. Join our Telegram channel

Full access? Get Clinical Tree


