Chapter 7
Hepatocellular carcinoma
Ersan Altun1, Mohamed El-Azzazi1,2,3,4, Richard C. Semelka1, and Mamdoh AlObaidy1,5
1The University of North Carolina at Chapel Hill, Department of Radiology, Chapel Hill, NC, USA
2University of Dammam, Department of Radiology, Dammam, Saudi Arabia
3King Fahd Hospital of the University, Department of Radiology, Khobar, Saudi Arabia
4University of Al Azhar, Department of Radiology, Cairo, Egypt
5King Faisal Specialist Hospital & Research Center, Department of Radiology, Riyadh, Saudi Arabia
- Hepatocellular carcinoma (HCC) is the most common primary malignancy of the liver.
- Age-standardized incidence rates vary from 2.1/100.000 in North America to 80/100.000 in China. There is a male preponderance among all ethnic groups.
- HCCs commonly develop in patients with chronic liver disease and cirrhosis.
- Chronic hepatitis C and B are recognized as the major risk factors. The incidence of HCC in patients with chronic hepatitis is 0.5%. Chronic hepatitis C and B account for 75–85% of HCCs. Hepatitis C has 3–4 times increased risk compared to Hepatitis B for the development of HCC. Other risk factors include alcohol consumption and nonalcoholic fatty liver disease, especially nonalcoholic steatohepatitis. The annual rate of developing HCC in patients with cirrhosis is 1–6%.
- The great majority of HCCs occur in patients with cirrhosis (>80%), but they can occur in patients with chronic hepatitis (20%). Note that the term non-cirrhotic liver also refers to chronic hepatitis livers, and should not be confused with a nondiseased (e.g., normal) liver. HCC in a normal liver is extremely rare, and may be observed in < 1 in 5000 HCC cases.
- HCC most commonly arises from preexisting dysplastic nodules (DNs), described as stepwise carcinogenesis. HCC occurring de novo is rare.
- Stepwise carcinogenesis is considered a linear process, progressing from regenerative nodules (RNs), to DNs, to HCC.
- Hepatocyte injury from chronic liver disease, including viral hepatitis, alcohol consumption, and nonalcoholic fatty liver disease leads to the formation of RNs, as a repair mechanism to replace the damaged hepatocytes and hepatic tissue. RNs are benign hyperplastic tissue. Some hepatocytes in RNs may show atypical features and become dysplastic. Dsyplastic cells increase in number and form DNs, which are pre-malignant. HCCs develop within DNs, initially as a small focus, which increases in size. DNs develop neovascularity, which originates from hepatic arterial branches, which perpetuates the growth of DNs, and facilitates development into HCCs.
- Histopathologically HCC is characterized by:
- Soft, hemorrhagic, occasionally bile-stained, nodules or masses with a propensity for necrosis.
- Spontaneous hemorrhage may be present.
- Central scar may be seen.
- Fatty infiltration (tends to be more heterogenous, unlike that of adenoma, which tends to be homogenous) may be seen.
- Soft, hemorrhagic, occasionally bile-stained, nodules or masses with a propensity for necrosis.
- HCC may arise as:
- Solitary (50%)
- Multifocal (40%)
- Diffuse (10%)
- Solitary (50%)
- Solitary and Multifocal HCCs
- Solitary and multifocal HCCs usually appear as encapsulated well-defined rounded tumors.
- HCC is generally a hypervascular tumor (90%) that receives its blood supply from hepatic arterial branches. The most sensitive phase of enhancement for detecting small HCCs is hepatic arterial dominant phase imaging because HCCs demonstrate prominent enhancement in this phase.
- HCCs have a tendency to invade vascular structures, including the portal vein and hepatic veins. The branches of the portal vein are more commonly affected compared to the branches of hepatic veins. This is rare for well-differentiated solitary tumors, and in general is uncommon in solitary and multifocal tumors, but invariably occurs in diffuse HCC.
- On CT
- CT has 80–90% sensitivity, 90% specificity for the detection of HCCs.
- On Pre-contrast CT images
- HCCs are usually hypoattenuated, especially if they are larger than 3 cm.
- HCCs may also be isoattenuated to liver parenchyma, especially if they are less than 3 cm. However, indirect signs can be identified on unenhanced images by
- A hypoattenuated rim, which represents the tumor capsule.
- Focal bulging in the contour of the liver.
- Exophytic mass-like structure.
- A hypoattenuated rim, which represents the tumor capsule.
- Areas of necrosis or fatty infiltration appear as hypoattenuated foci within the mass.
- Recent hemorrhage appears as hyperattenuated foci within the mass.
- Calcifications may occasionally be seen.
- HCCs are usually hypoattenuated, especially if they are larger than 3 cm.
- On dynamic contrast-enhanced CT images
- The tumor enhancement characteristics are:
- Hypervascular enhancement is the most common pattern.
- Enhancement characteristics of hypervascular HCCs are as follows:
- In the hepatic arterial dominant phase: HCCs show prominent enhancement. Enhancement is usually homogeneous if lesion size is smaller than 3 cm, and heterogeneous if the lesion is larger than 3 cm. The capsule of the tumor may appear as a hypoattenuated rim (Figures 7.1 and 7.2).
- In the hepatic venous phase: HCCs typically demonstrate wash-out and become hypoattenuated compared to background liver parenchyma (Figures 7.1 and 7.2). Tumor capsule shows enhancement in this phase. HCCs may also occasionally become isoattenuated in this phase.
- In the interstitial phase: Areas of fibrosis, including the capsule (Figure 7.2) and septa, usually demonstrate prolonged enhancement.
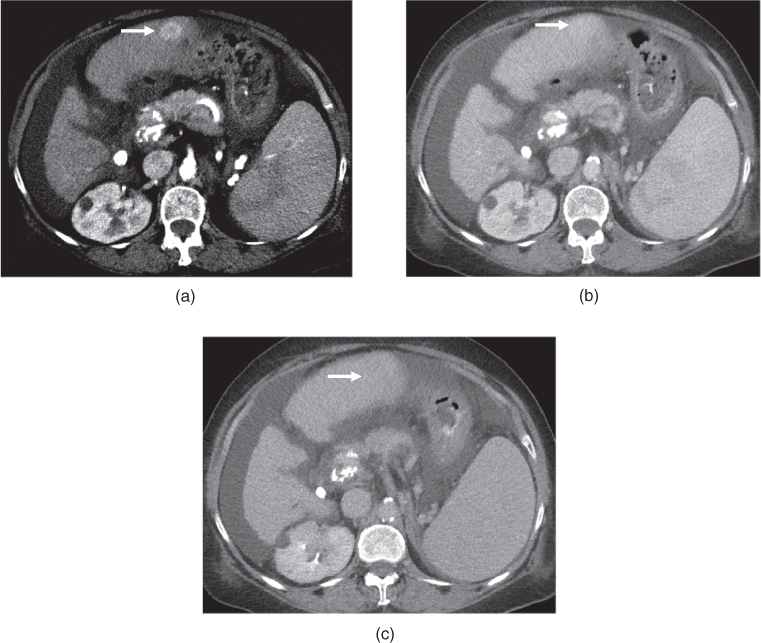
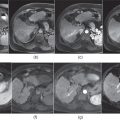
Figure 7.1 Transverse postcontrast hepatic arterial dominant (a), hepatic venous (b) and interstitial (c) phase images show a small hypervascular lesion, which is consistent with HCC, in a cirrhotic patient. The lesion shows prominent enhancement in the hepatic arterial dominant phase (a), fading in the hepatic venous phase (b) and subtle wash-out in the interstitial phase (c). The lesion appears mildly hypodense compared to the other phases due to wash-out. Note the presence of ascites and splenomegaly, suggestive of portal hypertension.
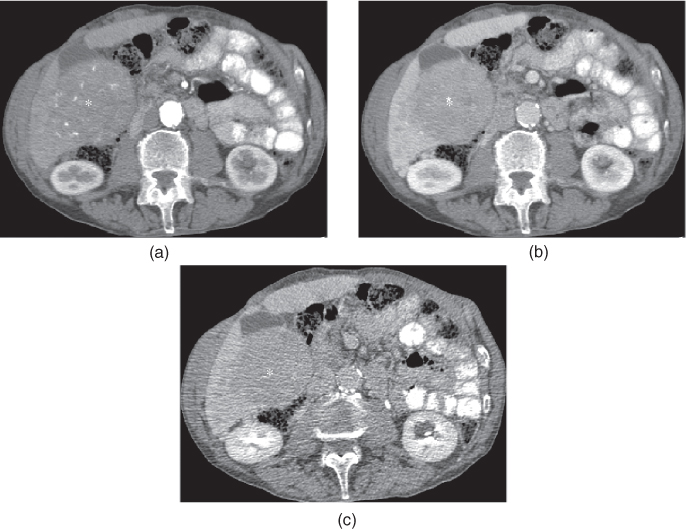
Figure 7.2 Transverse postcontrast hepatic arterial dominant (a), hepatic venous (b) and interstitial (c) phase images demonstrate a large exophytic HCC in a cirrhotic patient. The lesion shows enhancement on the hepatic arterial dominant phase (a) and wash-out on the hepatic venous (b) and interstitial (c) phase images. The lesion appears isodense or slightly hypodense compared to the liver on the hepatic arterial dominant phase (a). The lesion appears markedly hypodense on the hepatic venous (b) and interstitial phase (c) images due to wash-out. Slight capsular enhancement is noted in the interstitial phase (c).
- In the hepatic arterial dominant phase: HCCs show prominent enhancement. Enhancement is usually homogeneous if lesion size is smaller than 3 cm, and heterogeneous if the lesion is larger than 3 cm. The capsule of the tumor may appear as a hypoattenuated rim (Figures 7.1 and 7.2).
- On MRI
- MRI has 90–95% sensitivity and 90–95% specificity for the detection of HCCs.
- The absence of motion artifacts and the optimal timing of postgadolinium imaging in the early phase of enhancement, which is the hepatic arterial dominant phase, are critical factors for the diagnosis of HCCs (Figures 7.3 and 7.4).
- On T2-weighted images:
- HCCs usually show mild hyperintense signal (Figure 7.5) on T2-weighted images, especially if they are larger than 3 cm.
- Small HCCs (<3 cm) are frequently isointense on T2-weighted images, although they may also show mildly low or high signal (Figures 7.6–7.8).
- Isointensity on T2-weighted images may correlate with a more favorable histology for well-differentiated HCC.
- HCCs usually show mild hyperintense signal (Figure 7.5) on T2-weighted images, especially if they are larger than 3 cm.
- On T1-weighted images:
- HCCs are usually isointense on T1-weighted images if they are smaller than 3 cm although they may be hypointense or hyperintense (Figures 7.6–7.8). Larger tumors (>3 cm) usually show low heterogeneous signal on T1-weighted images (Figure 7.5).
- Small tumors less than 3 cm may occasionally demonstrate high signal on T1-weighted images. The hyperintensity on T1-weighted images may be due to
- Protein deposition: More common (Figure 7.9).
- Fatty infiltration: Identified by drop of signal on out-of-phase images (Figures 7.10 and 7.11). The signal decrease on out-of-phase imaging is generally more heterogeneous compared to hepatic adenomas.
- Hemorrhage (Figure 7.12).
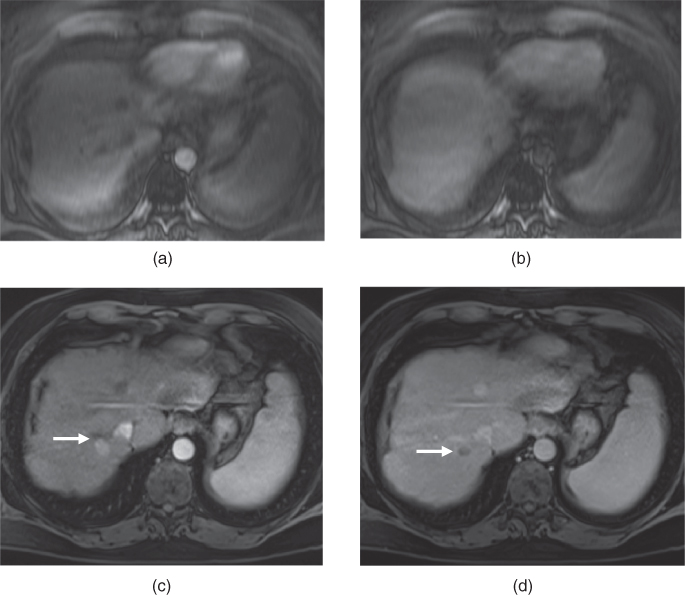
Figure 7.3 Transverse postgadolinium fat-suppressed T1-weighted hepatic arterial phase (a, c) and hepatic venous phase (b, d) 3D-GE images illustrate the importance of breath holding. In the first set of postgadolinium images (a, b), blurring due to motion artifacts are very prominent. In the second set of images (c, d), the same patient shows a hypervascular mass (arrows; c, d) demonstrating early enhancement in the arterial phase (c) and wash-out on the venous phase (d). The diagnosis is HCC in this patient with chronic liver disease. The HCC is not visualized in the first images due to motion artifacts.
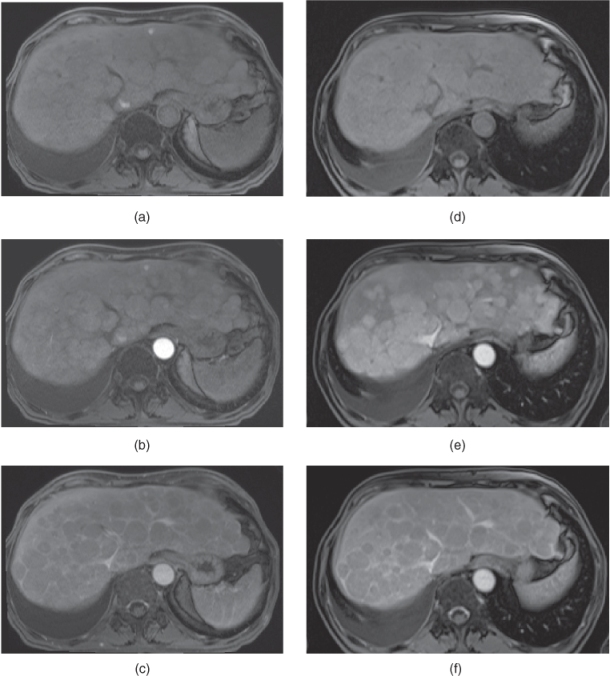
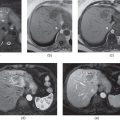
Figure 7.4 Transverse T1-weighted fat-suppressed 3D-GE (a, d), postgadolinium fat-suppressed early hepatic arterial phase (b), hepatic arterial dominant phase (e), hepatic venous phase (e, f) 3D-GE images illustrate the importance of correct timing on postgadolinium images (b–f). The first set of images (a–c) were acquired 1 month before the second set of images (d–f). The timing is suboptimal on postgadolinium images in the first set of images and optimal on postgadolinium images in the second set of images. Multiple nodular enhancing lesions replacing the majority of normal liver parenchyma are well seen in the hepatic arterial dominant phase of the second set of images. Although the nodular lesions are visualized on precontrast (a) and early arterial phase (b) images of the first set, the lesions do not show enhancement due to suboptimal timing. The prominent enhancement of nodular lesions are better visualized in the hepatic arterial dominant phase (e) image of the second set compared to the early hepatic arterial phase (b) of the first set of images. The nodular lesions show wash-out and capsular enhancement on the hepatic venous phase images (c, f). These nodular lesions are consistent with multifocal HCC.
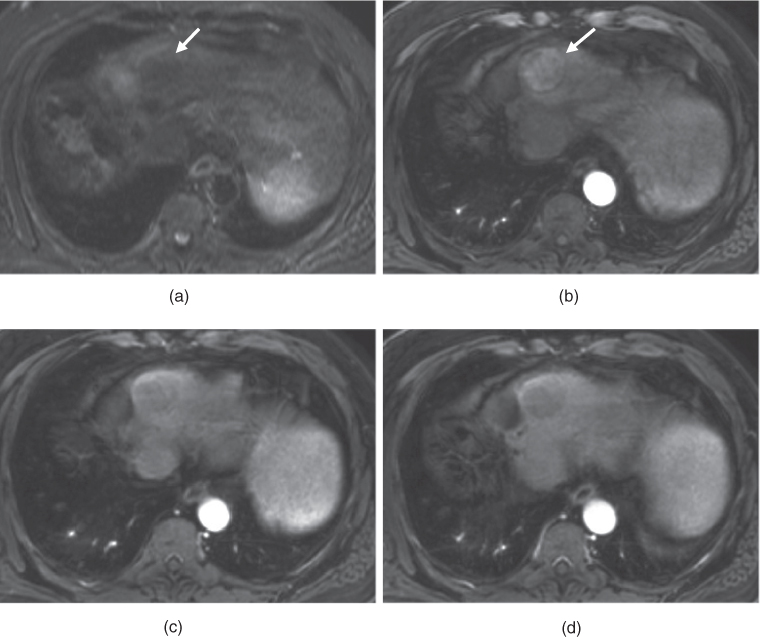
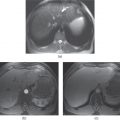
Figure 7.5 Transverse T2-weighted fat-suppressed SS-ETSE (a), T1-weighted fat-suppressed postgadolinium hepatic arterial dominant phase (b), consecutive hepatic venous phase (c, d) 3D-GE images show a medium-sized hypervascular HCC (arrows) located at the dome of the liver, demonstrating typical early homogeneous enhancement (b) and later wash-out with capsular enhancement (c, d). Note that the lesion is mildly hypointense on T2-weighted image.
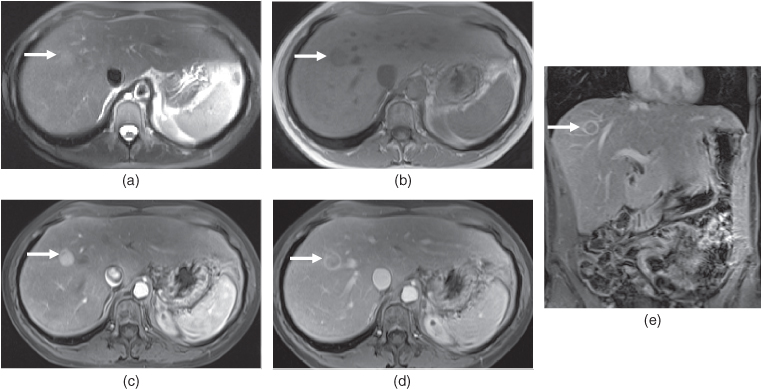
Figure 7.6 Transverse T2-weighted fat-suppressed SS-ETSE (a), T1-weighted 2D-GE (b), T1-weighted postgadolinium fat-suppressed hepatic arterial dominant phase (c), hepatic venous phase (d) and coronal hepatic venous phase 3D-GE images show a small typical hypervascular HCC (arrows) in a patient with chronic hepatitis. The lesion shows mildly high T2 signal (a) and moderately low T1 signal (b) on precontrast images. The lesion shows prominent homogeneous enhancement due to its hypervascular nature in the hepatic arterial dominant phase (c) and typical washout with capsular enhancement in the hepatic venous phase (d, e).
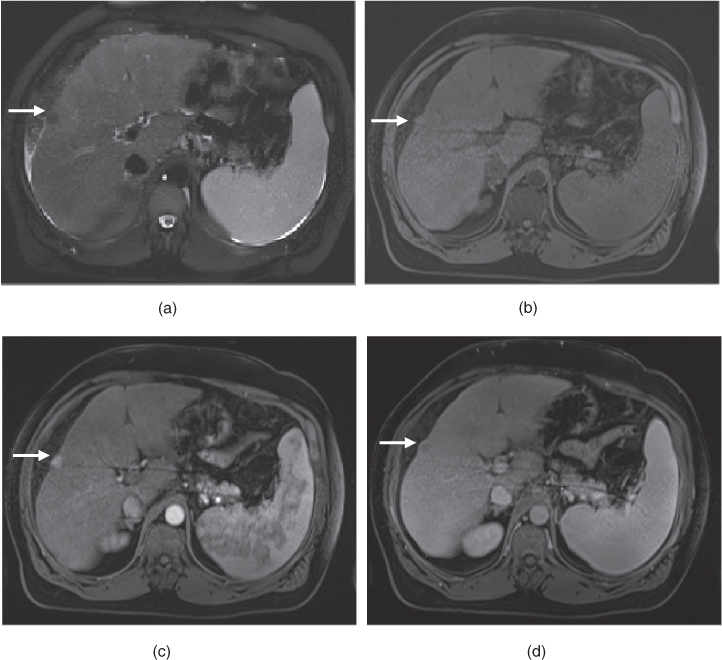
Figure 7.7 Transverse T2-weighted fat-suppressed SS-ETSE (a), T1-weighted fat-suppressed 3D-GE (b), T1-weighted fat-suppressed postgadolinium hepatic arterial dominant phase (c) and hepatic venous (d) phase 3D-GE images show a small hypervascular exophytic HCC (arrows) in the cirrhotic liver. The lesion is hypointense on T2-weighted image (a) and isointense on T1-weighted image (b). The lesion shows typical early homogeneous enhancement (c) and later wash-out with capsular enhancement (d).
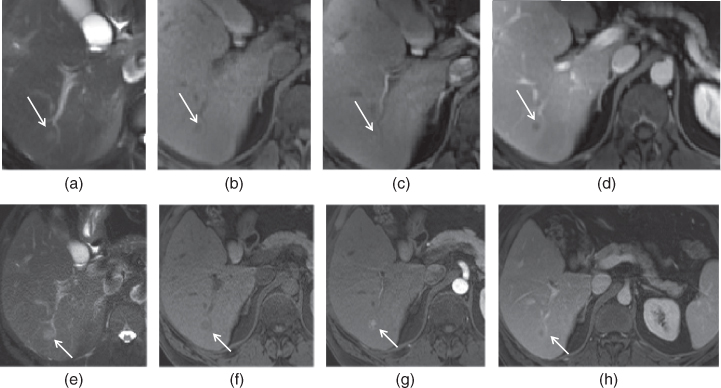
Figure 7.8 Transverse T2-weighted fat-suppressed SS-ETSE (a, e), T1-weighted fat-suppressed 3D-GE (b, f), T1-weighted fat-suppressed postgadolinium hepatic arterial dominant phase (c, g) and hepatic venous phase (d, h) 3D-GE images show a very small hypervascular HCC (arrows) in a patient with chronic hepatitis. The second set of images (e–h) were acquired 3 months after the first set of images (a–d). Although the lesion is very small, homogeneous early enhancement (c) and later wash-out (d) are noted on the first set of images, which are concerning for a small HCC. The followup examination (e–h) performed 3 months later demonstrated the interval enlargement of the HCC.
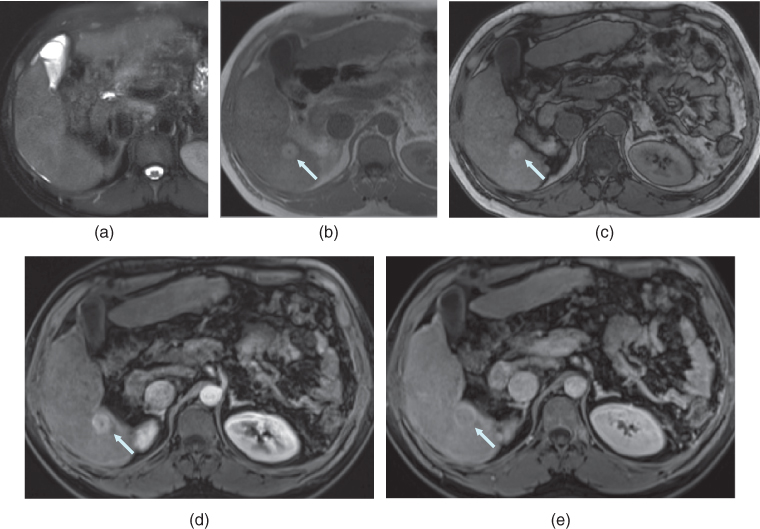
Figure 7.9 Transverse T2-weighted fat-suppressed SS-ETSE (a), T1-weighted in-phase (b) and out-of-phase (c) 2D-GE, T1-weighted fat-suppressed postgadolinium hepatic arterial dominant phase (d) and hepatic venous phase (e) 3D-GE images demonstrate a small HCC with high protein content.
Related posts:

Stay updated, free articles. Join our Telegram channel
- HCCs are usually isointense on T1-weighted images if they are smaller than 3 cm although they may be hypointense or hyperintense (Figures 7.6–7.8). Larger tumors (>3 cm) usually show low heterogeneous signal on T1-weighted images (Figure 7.5).

Full access? Get Clinical Tree


