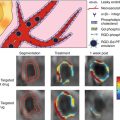
Fig. 8.1
Types of fluorescent imaging agents
8.3.2 Fluorescent Protein
Information about various biological processes and functions (e.g., specific cell types, enzymatic reactions, molecule distribution) can be directly obtained using transgenic mice labeled with fluorescent proteins. Recent progress in developmental biology techniques provides multiple choices for creating reporter mice, including conventional knock-in or transgenic approaches. Fluorescent protein expression can be induced in specific cell types and/or targeted organelles, using Cre/loxP systems. In addition, cell cycling can be directly monitored using “Fucci” mice [15]. Fluorescence resonance energy transfer (FRET) systems can visualize calcium signaling and intracellular enzymatic reactions. But while using these mice is very convenient, experiments need careful optimization and validation, as it is difficult to expect consistent signal specificity, quality, and intensity due to animal variations. In addition, there are technical difficulties related to protein excitation in red spectrum in living animals using a multiphoton setup, due to excitation problems in commercially available titan sapphire lasers with relatively low power for excitation in red-spectrum wavelength.
8.3.3 Nonstaining Approaches
Nonstaining methods include autofluorescence imaging and second harmonic generation observations [16]. Autofluorescence signals are often obtained from specific cytoplasmic organelles or tissue extracellular matrix (e.g., lysosomes, elastin). In some situations, autofluorescence signal is very useful, as it allows identification of specific cell types (e.g., macrophages) or serves as a helpful landmark for tissue orientation (e.g., elastin in the vessel wall).
Second harmonic generation is an optical process, in which photons with the same frequency interacting with a nonlinear material are effectively “combined” to generate new photons with twice the energy and therefore twice the frequency and half the wavelength of the initial photons. Combined second harmonic generation and two-photon excited fluorescence microscopy allows for visualization of collagen in living animals. These techniques are used to observe arterial adventitia, bone, and skin collagenous architecture without staining.
Combining these techniques, we can visualize the vessels, muscles, kidneys, liver, fat, and many other structures, as shown in Fig. 8.2. Imaging depth depends on tissues, but usually varies from 200 to 1,000 μm (Fig. 8.3).
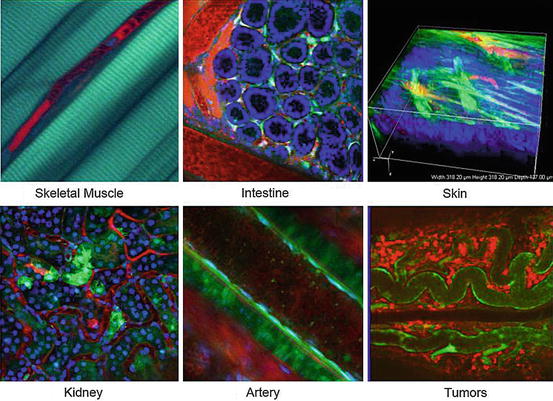
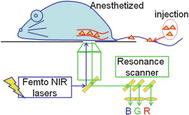
Fig. 8.2
Two-photon microscopy penetrates deep inside the body. CAG-eGFP transgenic mice with ubiquitous expression of eGFP in various tissues were used to visualize the muscle, intestine, skin, kidney, artery, and tumor. Texas Red dextran was injected to visualize vessels and blood cells (red), and Hoechst stain was used for nuclei contract (blue). Second harmonic generation signals were simultaneously obtained
Fig. 8.3
Diagram of the confocal microscope for real-time in vivo imaging. CAG-eGFP transgenic mice with ubiquitous expression of eGFP in various tissues were used to visualize the muscle, intestine, skin, kidney, artery, and tumor. Texas Red dextran was injected to visualize vessels and blood cells (red), and Hoechst stain was used for nuclei contract (blue). Second harmonic generation signals were simultaneously obtained
8.4 Application of Fluorescence Imaging to Cardiovascular Diseases
To understand the molecular and cellular mechanisms underlying cardiovascular disease and its complications, including thrombosis, the fluorescence imaging approach could serve as a powerful tool. Recent progress in optical technologies and evolving knowledge in developmental biology enabled us to visualize biological processes in living animals with minimal invasiveness. Fluorescent imaging has advantages in temporal and spatial resolution, as discussed previously. As shown in Fig. 8.1, ex vivo multi-scale imaging can obtain information not only on specific heart structures, including cardiomyocytes and heart vessels, but also on single sarcomeres.
In contrast, the living tissue imaging method yields three-dimensional images, which enable the visualization of three-dimensional structures in the whole heart. A spinning disk or resonance confocal microscope could be used for living imaging. Lectin is a useful histochemical probe that specifically labels endothelial cells in many species [17]. Information regarding mitochondrial membrane potential, which reflects cardiomyocyte viability, also can be obtained. Lee et al. recently reported on intravital visualization techniques using synchronization and compensation for heartbeat movement [18], and we expect that in vivo observation will improve targeting for specific cell types or molecule behavior (Fig. 8.4).
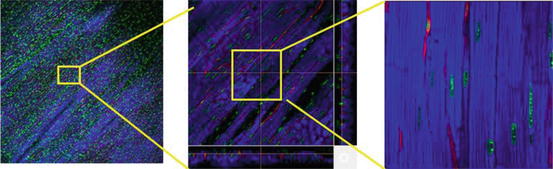
Fig. 8.4
Multi-scale heart tissue imaging. To visualize the heart tissue, endothelial cells were distinctively labeled using fluorescent isolectin dye (red), nuclei were stained with Hoechst 33342 (green), and cardiomyocytes were stained using mitochondria probe (TMRE, blue) in intact living heart tissue
8.5 Imaging of Thrombus
The intravital visualization technique of thrombus formation could serve as a powerful tool to analyze the complex cellular mechanisms underlying this cardiovascular complication, but due to technical difficulties, these techniques are not used broadly to image thrombotic events and their rapid phenomena. We discuss here the technical aspects of in vivo imaging and its application in thrombotic diseases.
FeCl3-induced thrombus formation in carotid arteries is a frequently used animal model for thrombus imaging [19], but the reproducibility of results obtained using this experimental approach is low. In addition, the effects from direct vessel injuries by drug administration cannot be ruled out. Another major limitation is that this technique cannot identify and track single-platelet kinetic during thrombus formation.
With the recent advance of optical technologies, we and others have successfully visualized a single platelet in developing thrombus using the fluorescent microscope or confocal microscope. Jackson et al. recently reported imaging of a single platelet in a developing thrombus and elucidated the effect of shear stress for platelet activations [20, 21]. Their studies suggested a two-stage theory of in vivo thrombus formation. Under low shear stress conditions, platelets become activated and undergo a dynamic shape change; under high shear stress conditions, discoid platelets are incorporated into growing thrombi.
Furie et al. developed the in vivo imaging technique of thrombus formation using laser injuries to endothelial cell layers and following extracellular collagen exposure [22]. They reported that direct laser injuries increased tissue factor expression in the vessel wall, followed by platelet accumulation. After the fibrin network forms, the vessels become occluded by developed thrombus. This process contrasts with classical models in which clot formation is a vital step for thrombus stabilization. Von Willebrand factor (vWF) also plays a vital role in thrombus development after laser injuries, and vWF-deficient mice show decreased platelet attachment on endothelium after laser injuries. These results indicate the presence of both vWF-dependent and vWF-independent pathways for thrombus formation in this model [23].
Exposure of extracellular matrix, including collagen, takes place in platelet activation processes during hemostasis, induced by ferric chloride models [24] or direct laser injuries [22]. This platelet activation can be monitored by P-selectin expression on the platelet surface, using fluorescent antibodies. In addition, intracellular calcium mobilization occurs during platelet activation, and intracellular calcium concentration within platelets can be monitored by several fluorescent indicators (e.g., FLUO-8AM probes) or FRET animals.
8.6 Visualizing Platelets In Vivo
Three different approaches exist for direct platelet visualization in vivo. The first approach utilizes transgenic mice. For example, CAG-eGFP transgenic mice express strong green fluorescent protein that exhibits bright green fluorescence signal in platelets when exposed to light. The second approach is based on antibody binding to specific adhesion molecules detected in platelets, including CD41 and CD42b. These fluorescent antibodies could be injected into living animals. Two clones are commercially available for mouse injection (MWReg30 for CD41 and X488 CD42). But the antibody treatment can produce a “blocking effect,” which should be monitored after injection. The third approach is platelet labeling ex vivo, followed by transfusion into mice. The platelets can be efficiently labeled with 5-TAMRA dye (5-carboxytetramethylrhodamine, succinimidyl ester) without platelet activation (Fig. 8.5).
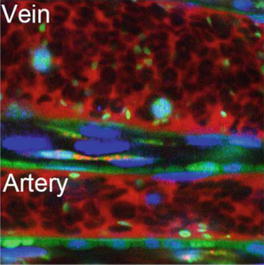
Fig. 8.5
Single platelet visualized by in vivo imaging technique. Multicolor visualization technique shows leukocytes (Hoechst, blue), erythrocytes (with the negative image for injected dextran, red), and platelets (eCAG-GFP signal, green) in both arteries and veins
8.7 Reactive Oxygen Species (ROS)-Induced Thrombosis Models
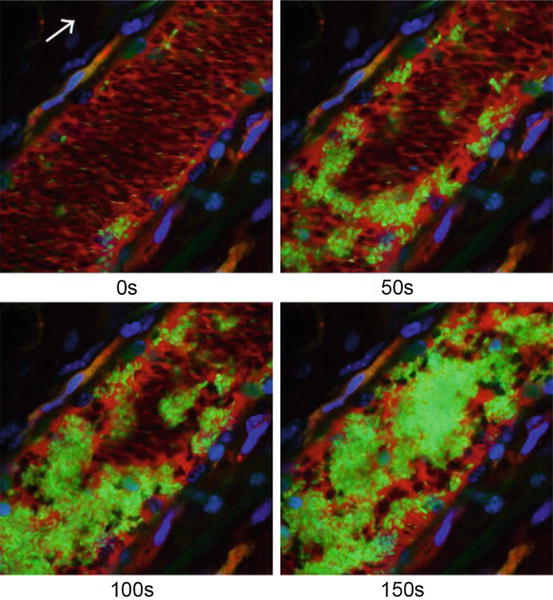
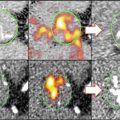
Can platelet aggregation be visualized in real time?
Several methods for platelet activation could be combined with fluorescent imaging in vivo. One of these approaches uses high-power laser irradiation, which completely disrupts the endothelial cell layer [22]. In this technique, after laser injuries, collagen extracellular matrix is exposed, platelets become activated, and thrombus formation is induced and accompanied by in vivo thrombus formation of activated and deformed P-selectin-positive platelets aggregate.
The other method uses photochemical reactions, visualizing single-platelet kinetics within aggregations of discoid platelets in thrombi in single-platelet levels [25, 26]. In contrast, based on the findings that reactive oxygen species (ROS) play a central role in atherosclerotic lesion formation and thrombotic diseases [27], we induced ROS production within the vessel. Porphyrin (hematoporphyrin) was used as a substrate. Thrombus formation could be observed with high reproducibility after ROS production by photochemical reactions. In these models, the platelet keeps its discoid shape, which is an important special feature of our method. We proposed that in our model, thrombus formation was initiated by the binding of platelet GPIb-alpha to endothelial vWF, followed by actin linker talin-dependent activation of alphaIIb-beta3 integrin, required for thrombus stability, in a later phase.
The most important technical advantage of this approach is that a photochemical reaction can be induced by the observation laser, and there is no need for two laser lines. For these purposes, the spinning disk confocal or resonance scanning system can be used.
Results can be quantified by software analysis, originally developed by modifying commercially available products [25]. The dynamic changes in platelet number or thrombus area can be statistically analyzed with high reproducibility. By obtaining intravital images and analyzing the results objectively, the effect gene manipulation can be quantified, and a hypothesis can be obtained in combination with conventional in vitro analysis by molecular biology technique (Fig. 8.6).
 Molecular Imaging of Macrophages in Atherosclerosis
 Ultrasound Imaging of Calcific Aortic Valve Disease
 Pathobiology and Optical Molecular Imaging of Calcific Aortic Valve Disease
 Pathobiology and Mechanisms of Atherosclerosis
 PET/CT Imaging of Inflammation and Calcification in CAVD: Clinical Studies
 Molecular MR Imaging of Atherosclerosis


Related posts:
Molecular Imaging of Macrophages in Atherosclerosis
Ultrasound Imaging of Calcific Aortic Valve Disease
Pathobiology and Optical Molecular Imaging of Calcific Aortic Valve Disease
Pathobiology and Mechanisms of Atherosclerosis
PET/CT Imaging of Inflammation and Calcification in CAVD: Clinical Studies
Molecular MR Imaging of Atherosclerosis
Stay updated, free articles. Join our Telegram channel
Full access? Get Clinical Tree
