Abstract
The cerebellopontine angle (CPA) cistern is a subarachnoid space centered within the posterior cranial fossa at the level of the internal auditory canal and bordered medially and laterally by the cerebellum and petrous temporal bone, respectively. The cranial caudal extent of this region extends from the level of cranial nerve V through the cranial nerve IX-X-XI complex. The vast majority of lesions in the CPA are vestibular schwannomas related to cranial nerve VIII, comprising 70%–80% of the lesions in this location. Meningiomas are the second most common lesion in this location. Although other intraaxial and extraaxial lesions are less commonly encountered, they are readily identified by imaging. These lesions may be congenital masses of the CPA (epidermoid and arachnoid cysts); may originate from the adjacent cerebellum or brainstem (such as gliomas or parenchymal metastases), the vessels in the posterior fossa (arteriovenous malformations or aneurysms), and the adjacent temporal bone (Paget disease); or may be related to systemic leptomeningeal processes (infection or inflammatory processes, such as meningitis or sarcoidosis). The clinical presentation and symptoms related to CPA lesions depend on the lesion location, size, mass effect, and contact on adjacent structures. This chapter reviews the imaging features of common and less commonly encountered lesions of the CPA.
Keywords
Arachnoid cyst, Cerebellopontine angle (CPA), Epidermoid, Internal auditory canal (IAC), Meningioma, Sensorineural hearing loss, Vestibular schwannoma
Introduction
The cerebellopontine angle (CPA) cistern is a subarachnoid space within the posterior cranial fossa. About 6%–10% of all intracranial masses are found in this location. Vestibular schwannomas (VSs) are the most commonly encountered lesion in the CPA, followed by meningiomas. Together these masses account for 85%–90% of all CPA tumors. Other less common entities comprise the remaining 15% of lesions, and although encountered less frequently, these are also readily identified by imaging. The clinical presentation of the various lesions depends on the location and the associated mass effect on adjacent structures. The purpose of this chapter is to review the imaging features of common and uncommon CPA lesions.
Anatomy
The CPA is a triangular subarachnoid space located within the posterior cranial fossa and centered at the level of the internal auditory canal (IAC). The apex of the space is medially positioned within the prepontine cistern. The petrous temporal bone forms the anterolateral border, and the cerebellum forms the posteromedial border. The space extends craniocaudally from the cranial nerve V to the cranial nerve IX-X-XI complex.
The contents of the CPA therefore include the cerebrospinal fluid (CSF) and cranial nerves and vessels. Lesions occurring within this region may originate from any of these structures, from the meninges lining the petrous temporal bone, or from extension of lesions arising from the adjacent temporal bone, brainstem, or cerebellum. The clinical presentation and symptoms associated with the various lesions may be nonspecific clinically and vary depending on where the lesion arises and if there is involvement or compression of adjacent structures.
Imaging Techniques
Magnetic Resonance Imaging
MRI has excellent soft tissue contrast resolution and is the preferred imaging modality for differentiation and characterization of various soft tissues and fluids. In addition to conventional MR sequences of the brain, current imaging evaluation of the CPA includes high-resolution heavily T2-weighted imaging, such as constructive interference in steady-state (CISS), driven equilibrium (DRIVE), fast imaging employing steady-state acquisition (FIESTA), with submillimeter slice thickness, allowing evaluation of the cranial nerves and surrounding CSF without intravenous contrast administration. High-resolution pre- and postcontrast T1-weighted images through the CPA and IAC are also routinely obtained for complete characterization.
Diffusion-weighted imaging (DWI) has been utilized for temporal bone and CPA imaging, particularly when abscesses or epidermoid/cholesteatoma are suspected. Diffusion restriction is seen with these pathologies and this specific sequence can be helpful in differentiation from other conditions (described in greater detail later).
If there is suspicion for a vascular lesion as the etiology of a CPA “mass,” two or three-dimensional time-of-flight techniques may be performed for arterial imaging without intravenous contrast administration. Phase-contrast MR angiography is another technique to demonstrate vascular structures without intravenous contrast administration, which enables the quantitative analysis of flow as well as the visualization of arterial and venous structures. Dynamic contrast-enhanced MR angiography can also be performed as clinically required.
Computed Tomography
CT is often performed for the evaluation of nonspecific clinical symptoms related to the CPA and posterior fossa and may initially identify culprit lesions. CT provides excellent definition of bone and air-filled spaces. However, fluid, nerves, and tumors are similar in density. Therefore, CT usually has difficulty differentiating fluids from soft tissues without contrast. Fat is substantially lower in density and darker than other soft tissues on CT, and fat-containing lesions are readily identified. The administration of intravenous iodinated contrast enables the identification of enhancing lesions and vessels and may increase lesion conspicuity.
Currently, most CT examinations are performed with multidetector-row CT with submillimeter slice thickness through regions of interest. At our institution, temporal bone and CPA imaging is performed with slices of 0.625 mm thickness, which are reconstructed with 0.3 mm interval, with high-quality multiplanar reformatted images obtained from the axially acquired “volume data.” Axial and coronal are the primary planes utilized for imaging evaluation.
Extraaxial Lesions
Extraaxial lesions are often readily identified as separate and distinct from brain parenchyma on CT and MRI. In some cases, differentiation may be difficult and secondary signs of the extraaxial location (including the identification of a CSF cleft between the lesion and the parenchyma and enlargement of the cisterns) may help in localization. Extraaxial lesions may also “push away” cranial nerves and adjacent structures.
Vestibular Schwannoma
VSs are by far the most commonly encountered lesion in the CPA, comprising 70%–80% of the lesions in this location. Most of these lesions develop from the Schwann cell within the IAC and as they grow extend out of the porus acousticus into the CPA. There are no Schwann cells associated with the cisternal segment of the cranial nerve VIII, thus precluding primary origin of the lesion within the segment of the nerve in the CPA.
Aside from symptoms related to cranial nerve VIII origin, additional clinical symptoms caused by VS may be related to the mass effect imposed on adjacent structures in the posterior fossa, more often seen with larger and purely cisternal lesions. Bilateral VSs are a diagnostic feature of neurofibromatosis type II ( Figs. 12.1 and 12.2 ).


On CT examinations, VSs are often isodense to brain parenchyma. Erosion or remodeling of the adjacent temporal bone is often present, although often very subtle.
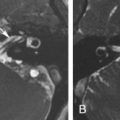
On MRI, VSs demonstrate isointense signal on T1-weighted images, intermediate to hyperintense signal on T2-weighted images, and avid enhancement, although heterogeneity and cystic degeneration is commonly seen with an increase in size. The presence of foci of susceptibility caused by intratumoral microhemorrhage is characteristic and helpful to differentiate from other lesions such as meningioma ( Figs. 12.3 and 12.4 ). VSs may appear as a “filling defect” within the CPA on heavily T2-weighted images or MR cisternography ( Fig. 12.5 ).


Three enhancement patterns have been identified : homogeneous enhancement (50%–60% of cases), heterogeneous enhancement (30%–40% of cases), and central cystic change without enhancement (5%–15% of cases). Studies suggest that the enhancement characteristics may be related to the tumor size and Antoni cell type. Small VSs often comprise Antoni type A cells and demonstrate homogeneous enhancement. Larger lesions (greater than 2.5 cm) often demonstrate heterogeneous enhancement and are more often Antoni type B cells or a mix of Antoni type A and type B cells.
T2 hyperintense signal in the dorsal brainstem is another imaging feature that can be seen with VS and may be related to degeneration of the vestibular nucleus.
Advanced MRI techniques have been utilized to evaluate for imaging characteristics unique to VS. DWI has not shown reliability in differentiating VS from meningioma, although studies suggest that apparent diffusion coefficient (ADC) values are higher in VS when compared with meningioma and that higher ADC values may be related to VS rich in Antoni type B cells. MR perfusion has shown that relative tumor blood volume may be lower in VS compared with meningioma. MR spectroscopy demonstrates a myoinositol peak at 3.55 ppm. Furthermore, the alanine peak seen in meningioma is absent in the setting of VS.
Other Schwannomas
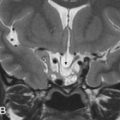
Schwannoma arising from other cranial nerves may also extend into the CPA and may mimic VS. CN V, VII, and IX–XI can be involved. The imaging features of these schwannoma are similar to those of VS, and distinction is made on the basis of clinical symptoms and on the mass following the trajectory of a specific nerve, enlargement of specific skull base foramina, and possible denervation changes of corresponding muscles. For instance, trigeminal nerve (CN V) schwannoma are located cranial to VS, are oriented in a more anteroposterior axis (relative to VS), and may extend into Meckel cave ( Fig. 12.1 ). CN IX–XI schwannomas are located caudal to the CPA and may extend through the jugular foramen.
Facial nerve (CN VII) schwannoma may be difficult to distinguish from VS because of similar lesion location and similar trajectory of the cranial nerve through the IAC. However, facial nerve schwannoma are located superiorly and anteriorly within the IAC and may extend into the temporal bone along the course of the facial nerve canal.
Meningioma
Meningiomas are the most common intracranial extraaxial mass and are the second most common mass found in the CPA (after VS), accounting for 10%–15% of all tumors in this location. Ten percent of meningiomas occur in the CPA.
Given their location in the CPA, symptoms related to CN VIII may be encountered. Facial pain, less common with VS, can occur in up to 30% of patients with CPA meningiomas.
Histopathologically, meningiomas are derived from arachnoid meningoepithelial cells. Within the CPA, meningiomas most often arise from the posterior petrous dura. Meningiomas extend into, but do not enlarge, the porus acousticus, a subtle but important imaging feature. Hyperostosis is more common than bone erosion.
CT usually demonstrates a hyperdense mass with occasional calcification in the CPA, although not necessarily centered at the IAC. Evaluation for subtle hyperostosis of the petrous temporal bone may aid in diagnosis ( Fig. 12.6 ). MRI demonstrates a dural-based extraaxial lesion, isointense to cortex on T1-weighted imaging with intense enhancement ( Figs. 12.6–12.8 ). Enhancing dural tails are a frequent imaging feature, although they are nonspecific and may be related to reactive change as opposed to a neoplastic process.


Meningiomas and VSs may appear similar by imaging, and several studies have utilized advanced MRI techniques for potential differentiation between the two. DWI characteristics of meningioma and VS have been compared, but the ADC values have not shown reliability in distinction between these two lesions. Relative tumor blood volume has also been shown to be higher in meningiomas than in VS. An alanine peak and elevated glutamate/glutamine peak is seen with meningioma with MR spectroscopy. Microhemorrhage on gradient echo sequences has been shown to have high sensitivity and specificity in distinguishing VS from meningioma.
Hemangiopericytoma
Hemangiopericytomas, which are currently accepted as a cellular variant of solitary fibrous tumor, are rare hypervascular lesions that are infrequently encountered in the CPA. These lesions are similar in imaging appearance to meningioma, often with more aggressive features and a much greater risk for recurrence and metastases.
Epidermoid Cysts
Epidermoid cysts are the third most common tumor of the CPA, accounting for 5% of all lesions in this location and 1% of all intracranial tumors. These are congenital lesions arising from the inclusion of ectodermal epithelial tissue during neural tube closure. About 50% of intracranial epidermoid cysts are located in the CPA.
Epidermoid cysts enlarge over time because of the accumulation of keratin and cholesterol produced by the desquamation of the squamous epithelium. These lesions tend to encase and surround (and not displace) adjacent structures, such as cranial nerves and vessels in the CPA. Clinical symptoms therefore tend to arise when the lesions become large. A unique clinical presentation of epidermoid cysts is recurrent episodes of aseptic meningitis related to inflammation induced by the keratin debris.
Epidermoid cysts are hypodense and almost isoattenuating to CSF in the CPA on CT examinations ( Fig. 12.9 ), although marginal calcifications may be seen. These lesions also demonstrate imaging characteristics and a signal intensity similar to that of CSF on conventional MRI whereby they are hypointense in signal on T1 and hyperintense in signal on T2. Fluid-attenuated inversion recovery (FLAIR) images are useful in distinguishing these lesions from the CSF normally located in the CPA, as signal is incompletely suppressed in an epidermoid cyst ( Fig. 12.9 ). Furthermore, the characteristic imaging feature associated with this lesion is the presence of restricted diffusion, not only useful in initial evaluation but also of high utility in the postoperative patient for the evaluation of residual tumor ( Figs. 12.9 and 12.10 ). An elevated lactate peak is seen with this lesion if evaluated by MR spectroscopy.
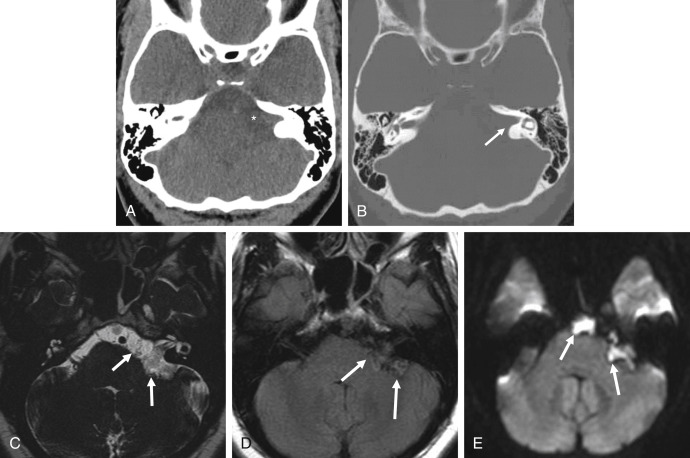

Arachnoid cysts (described in greater detail later) may appear quite similar to epidermoid cysts on imaging. An epidermoid cyst can be differentiated from arachnoid cysts on the basis of incomplete suppression of signal on FLAIR images, the presence of diffusion restriction, and the absence of scalloping or erosion of the adjacent temporal bone.
Arachnoid Cysts
Arachnoid cysts account for less than 1% of lesions in the CPA. These are usually found in the supratentorial location, most commonly in the middle cranial fossa (70% of lesions). Seven percent of all arachnoid cysts are located in the CPA, and of these, 15% develop symptoms, usually related to mass effect.
Arachnoid cysts are CSF-filled masses of uncertain etiology, although they are thought to be congenital lesions. These are usually incidentally found on imaging but can be associated with cranial nerve symptoms caused by mass effect. Posterior fossa and CPA arachnoid cysts may also result in brainstem and cerebellar compression, suboccipital headaches, tonsillar descent, and syringomyelia.
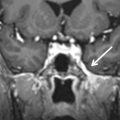
On imaging, these are smooth lesions that displace adjacent structures (such as cranial nerves and vessels in the CPA) and scallop adjacent bones. They are isoattenuating to CSF on CT but can be identified by asymmetric enlargement of a CSF space. Arachnoid cysts follow CSF intensity on all MR sequences, including complete suppression of signal on FLAIR. Differentiation from epidermoid cysts is made by the complete absence of signal on FLAIR images and by lack of diffusion restriction on DWI ( Fig. 12.11 ).

Related posts:
 Imaging in Endoscopic Endonasal Skull Base Surgery
 Imaging of the Postoperative Middle Ear, Mastoid, and Internal Auditory Canal
 Imaging of the Facial Nerve
 Jugular Foramen
 Skull Base Bone Lesions I: Imaging Technique, Developmental and Diffuse Bone Lesions
 Skull Base Bone Lesions II: Benign and Malignant Tumors
Stay updated, free articles. Join our Telegram channel

Full access? Get Clinical Tree


