Anatomy Overview
The Kidney
The kidneys are paired retroperitoneal organs that primarily function in the excretion of metabolic waste. They are bean shaped with a convex lateral border and a concave medial surface known as the renal hilum.
On intravenous contrast-enhanced studies, sequential enhancement of the renal vasculature, cortex, medulla, and collecting system occurs. In the early nephrographic phase, also called the corticomedullary phase, there is marked differentiation between the markedly enhancing renal cortex and relatively unenhanced renal medulla is prominent. As the nephrogram progresses, the entire kidney shows more uniform enhancement. After approximately 2 minutes, the collecting system starts to become dense with opacified urine, which progresses into the ureters and bladder ( Figure 62-1 ).
Most kidneys are supplied by a single renal artery arising from the abdominal aorta. Near the renal hilum the main renal artery divides into a posterior and four anterior segmental renal arteries (upper, apical, middle, and lower) that course through the renal sinus. The segmental arteries give rise to the lobar arteries that branch to form the interlobar, arcuate, and interlobular arteries. Accessory renal arteries can occur and are unilateral in 30% and bilateral in 10%.
The kidney is usually drained by a single renal vein that forms from the sequential fusion of the arcuate, interlobar, and lobar veins. Similar to arterial supply, there can be variant venous anatomy, including multiple right renal veins (30%), a circumaortic left renal vein (17%), and a retroaortic left renal vein (3%).
The kidneys are situated on either side of the lumbar spine within the perirenal space of the retroperitoneum. The perirenal spaces are cone shaped and are confined by the anterior (Gerota) and posterior (Zuckerkandl) renal fascia. Each collecting system consists of the minor calyces, infundibula or major calyces, and renal pelvis. There are 10 to 25 minor calyces in each kidney, each of which has a cuplike shape formed by the impression of a renal papilla.
Introduction to Renal Imaging Modalities
Radiographic studies to evaluate the kidneys and urinary tract include plain abdominal radiography as well as excretory urography, also known as intravenous pyelography (IVP). Abdominal radiographs do not show most pathologic processes but may demonstrate large renal masses or urinary tract calculi. IVP was previously the gold standard for evaluation of the upper urinary tract but has been replaced by computed tomography (CT) urography at many institutions.
Ultrasonography is an important tool in the initial evaluation of the kidneys. It detects the majority of masses greater than approximately 1 cm. Doppler ultrasound imaging is an important tool in evaluating the renal vasculature.
Magnetic resonance imaging (MRI) of the kidneys and urinary tract has had an expanding role in the past decade and is typically performed to further characterize abnormalities discovered using other imaging modalities. Its multiplanar imaging capabilities, superior soft tissue contrast, and ability to demonstrate contrast enhancement with non-nephrotoxic gadolinium compounds have made MRI an attractive tool for evaluating pathologic processes affecting the urinary system. Positron emission tomography (PET) is an emerging imaging modality for the kidneys and urinary tract. Its usefulness is limited by the urinary excretion of fluorodeoxyglucose (FDG), which creates high background uptake of FDG in the kidneys, ureters, and bladder.
Nuclear medicine examinations of the kidneys and urinary tract have the advantage of demonstrating functional information and include radiolabeled mercaptoacetyl triglycine (MAG3), diethylenetriaminepentaacetic acid (DTPA), and dimercaptosuccinic acid (DMSA) scans.
Radiography
The abdominal plain film or kidney/ureter/bladder (KUB) view plays a small role in the evaluation of the urinary tract. Ultrasonography, CT, and MRI have largely supplanted plain radiography in the evaluation of the urinary tract. Unenhanced CT is now the modality of choice for the diagnosis of renal stones, with sensitivity and specificity reported from 95% to 98% and 96% to 100%, respectively. Plain radiography is significantly less accurate, with a reported sensitivity of 70% to 90% for the detection of urinary tract calculi and a sensitivity of 59% for the detection of ureteral calculi. Once diagnosed with calculi, many patients are managed conservatively with the expectation that the stone(s) will pass spontaneously. The expense and relatively high radiation dose of CT make plain film radiography a more practical modality to follow the progress of calculi. This is particularly true for stones larger than 5 mm or for stones that measure greater than 300 Hounsfield units (HU) on the diagnostic CT scan ( Figure 62-2 ). Plain radiography can be used to determine which urinary tract calculi can be visualized fluoroscopically for lithotripsy.
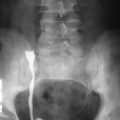
Intravenous Urography
For decades, intravenous urography was the principal imaging study for the evaluation of the upper urinary tract, particularly in the evaluation of flank pain and hematuria. Briefly, the technique generally involves a preliminary radiograph, after which contrast is administered and images are obtained in the nephrographic phase (1 to 3 minutes), followed by a 5-minute film, just as the contrast is beginning to enter the collecting system ( Figure 62-3 ). In some centers, compression may be applied to compress the ureters against the pelvic brim. Images of the collecting system are obtained 10 minutes after contrast ( Figure 62-4 ). The ureters are imaged after compression is released (if applicable), and a number of films or projections may be necessary to image both ureters ( Figure 62-5 ). Radiographs should include the bladder both before and after voiding.
However, unenhanced CT is now the predominant modality used for the evaluation of flank pain. Smith and colleagues showed that unenhanced CT is more sensitive than intravenous urography in the detection of stones and has the added benefit of showing nonurinary causes of flank pain. Similarly, CT urography has become the definitive imaging study in the evaluation of hematuria. Unlike intravenous urography, CT urography allows the evaluation of both the renal parenchyma and the urothelium in a single examination.
Ultrasonography
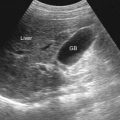
The kidney is well defined at ultrasonography, surrounded by an echogenic fibrous capsule and perirenal fat. The echogenic perirenal fat continues into the renal sinus medially at the renal hilum. The renal cortex is normally equal or slightly less echogenic than the adjacent liver and spleen. The calyces and pelvis are occasionally seen in hydrated patients and in the case of an extrarenal pelvis. These normal variants should not be confused with hydronephrosis.
Technique
Renal ultrasonography is performed with a sector or curved array transducer with a frequency of 3 to 5 MHz. A lower frequency transducer (2.25 MHz) can be used for larger patients, and a higher frequency transducer (7.0 MHz) can be used for smaller patients. Longitudinal and transverse images are obtained sequentially through the upper pole, interpolar region, and lower pole of each kidney. Maximum renal length should be measured for both kidneys. Ideally, images that provide comparison of renal cortical echogenicity with that of the liver and spleen should be provided. The complete ultrasound evaluation of the urinary tract also includes images of the perirenal areas, the retroperitoneum, and bladder. Transverse and longitudinal images of the bladder are obtained. Color Doppler and spectral waveform analysis may be performed to evaluate the renal vasculature.
Indications
Stones
Renal calculi are common, occurring at least once in a lifetime in 12% of men and 5% of women. In fact, stone disease is one of the major indications for imaging of the urinary tract. As discussed, unenhanced CT is the imaging modality of choice in the evaluation of suspected renal colic. Ultrasonography plays a limited role, owing to suboptimal sensitivity for stone detection that ranges from 60% to 96%. Despite these limitations, ultrasonography is the initial imaging modality in the evaluation of suspected renal calculi during pregnancy given the lack of ionizing radiation.
The ultrasound criterion for the diagnosis of a renal stone is an echogenic focus with posterior acoustic shadowing ( Figure 62-6 ). It is important to be aware of potential pitfalls in the evaluation for renal stones. Intrarenal gas, renal artery calcifications, calcified masses, and calcified papilla are some of the disease processes that can be confused with renal stones.
Obstruction
Ultrasonography is a useful screening test in the evaluation of urinary tract obstruction with sensitivity greater than 90%. With the development of obstruction, there is dilation of the calyces, pelvis, and/or ureter, which appears as anechoic regions within the echogenic renal sinus ( Figure 62-7 ). Obstruction can be categorized depending on severity: grade 1 (minimal separation of collecting system), grade 2 (moderate separation of collecting system), and grade 3 (marked separation of the collecting system). However, dilation of the collecting system (hydronephrosis) does not always indicate obstruction and can also be seen in reflux, scarring, pregnancy, high urine output states, and congenitally dilated collecting systems. In addition, normal patients may show mild dilation of the renal pelvis and calyces when the bladder is full. Postvoid images can be helpful to show resolution of this normal finding.
Infection
Traditionally, imaging does not play a role in the evaluation of uncomplicated renal infections. However, imaging does play an important role in the detection and follow-up of the complications of renal infections.
Pyelonephritis represents bacterial infection of the renal parenchyma. Ultrasonography is less sensitive than both CT and scintigraphy for the detection of acute pyelonephritis. Findings that can be seen include renal enlargement, focal regions of hypoechoic (edema) or hyperechoic (hemorrhage) echotexture, loss of corticomedullary differentiation, and a segment of decreased or absent perfusion ( Figure 62-8 ).
Pyonephrosis represents suppurative material in an obstructed collecting system. Prompt relief of the obstruction and treatment of the infection are important to avoid bacteremia and sepsis.
A renal abscess represents progression of acute pyelonephritis to cortical necrosis. A perirenal abscess develops from rupture of either a renal abscess or pyonephrosis into the perirenal space. Both can be detected on ultrasonography as a hypoechoic mass, often with a thick wall, debris, and posterior acoustic enhancement ( Figure 62-9 ).
Tumors
Ultrasonography is less sensitive than CT and MRI in the detection of renal neoplasms. Despite this fact, renal masses are commonly encountered at routine renal ultrasound evaluation. On ultrasonography, most renal masses are solid with variable echogenicity. Doppler evaluation should be included and may reveal venous invasion and tumor vascularity. A full discussion of specific renal neoplasms is presented in Chapter 63 .
Renal Cystic Disease
The renal cyst is the most common focal renal lesion. When strict criteria are used, ultrasonography is extremely accurate in the characterization of simple and minimally complex renal cysts. Ultrasonography also plays a role in the evaluation of the complex renal mass. A full discussion of cystic lesions is presented in Chapter 63 .
Renal Parenchymal Disease
In the setting of renal failure, imaging evaluation usually begins with ultrasonography. Ultrasonography will identify potentially reversible obstructive causes of renal failure and can demonstrate small echogenic kidneys (<9 cm) in patients with irreversible end-stage disease. The normal renal cortex is as echogenic or slightly less echogenic than the adjacent liver and spleen. An increase in the renal cortical echogenicity greater than that of the liver suggests parenchymal disease ( Figure 62-10 ). However, ultrasonography can be normal in cases of early parenchymal disease.
Vascular Abnormalities
Duplex and color Doppler ultrasound imaging can be used to image the renal arterial tree from the main renal artery to the arcuate branches and can demonstrate both normal and abnormal renal vasculature. The normal renal artery has a low resistance pattern with forward flow throughout systole and diastole. Normal intrarenal vessels have a rapid systolic upstroke with an acceleration time (from the start of systole to peak) of 0.07 second or less and an acceleration index (slope of initial systolic peak) of 3 m/s 2 or greater. The resistive index can be calculated as a measure of arterial resistance.
The use of ultrasonography in the screening evaluation of renal artery stenosis remains controversial. Ultrasonography is universally available, inexpensive, and noninvasive. However, the examination is time consuming, operator dependent, and technically difficult. Complete examinations of the renal arteries are achieved in 50% to 90% of patients, with sensitivity for the detection of renal artery stenosis varying from 0 to 93%. Criteria for significant renal artery stenosis include peak systolic velocity greater than a threshold value (100 to 200 cm/s), a renal artery to aortic peak systolic velocity ratio greater than 3.5, and turbulent flow with spectral broadening distal to the stenosis ( Figure 62-11 ). Quantitatively, an acceleration time exceeding 0.07 second or an acceleration index of less than 3 m/s 2 in the intrarenal arteries suggests significant renal artery stenosis.
Renal vein thrombosis can be related to a primary renal process such as membranous glomerulonephritis or can be secondary to an extrarenal process such as dehydration, coagulopathy, extrinsic compression, or tumor thrombus. On ultrasonography, the kidney is typically enlarged and hypoechoic with loss of corticomedullary differentiation. Echogenic clot may be seen in the renal vein, but clot may be isoechoic and not visualized.
Transplants
Renal transplantation has become an important treatment option in patients with end-stage renal disease. These transplants are typically placed extraperitoneally in the right or left lower quadrant with end-to-side anastomoses with the external iliac vasculature and a ureteral neocystostomy to the bladder dome. The superficial location in the right or left lower quadrant often makes ultrasonography the imaging procedure of choice in the evaluation of these complications and in directing interventions.
Approximately 90% of obstructions will occur in the distal third of the ureter, with 50% occurring at the site of ureteral implantation to the bladder. The most common causes of obstruction include postoperative edema at the anastomosis, scarring, technical errors, and ureteral kinking. Stones, clots, fungus balls, papillary necrosis, and extrinsic compression are seen less often ( Figure 62-12 ). It is important to remember that mild hydronephrosis normally can be seen in the denervated transplant from decreased ureteral tone and with a distended bladder. In this instance, postvoid images should be obtained.
Peritransplant fluid collections are common, occurring in approximately 50% of transplant patients ( Figure 62-13 ). These fluid collections include hematomas, urinomas, lymphoceles, and abscesses.
Vascular complications are seen in 1% to 2% of transplants and include renal artery stenosis, renal vein thrombosis, renal artery thrombosis, and postbiopsy arteriovenous fistula or pseudoaneurysm. Color and duplex Doppler ultrasound imaging are excellent to evaluate these complications.
- •
Variant venous anatomy includes multiple right renal veins (30%), a circumaortic left renal vein (17%), and a retroaortic left renal vein (3%).
- •
The renal cortex is normally equally or slightly less echogenic than the adjacent liver and spleen. An increase in echogenicity greater than that of the liver suggests parenchymal disease.
Computed Tomography
CT is the imaging study of choice for the majority of pathologic processes of the kidneys and urinary tract. Modern CT scans are typically performed using multidetector CT (MDCT) scanners. Isotropic imaging allowing for multiplanar reconstructions should be routinely employed, and dynamic imaging can be performed at multiple time points, when necessary.
Common indications for renal or urinary tract CT include suspected renal colic; abdominal trauma; detection and characterization of renal masses; staging of renal, ureteral, or bladder malignancy; and preoperative planning before renal donation or nephron-sparing surgery.
Technical Aspects
CT of the kidneys and urinary tract may be performed without and with iodinated intravenous contrast media. Protocols are customized to the diagnostic question by varying kilovoltage peaks, milliamperes, pitch, and timing of imaging after contrast agent administration. Each examination should be tailored to match the clinical scenario while adhering to ALARA (as low as reasonably achievable) radiation dosing principles.
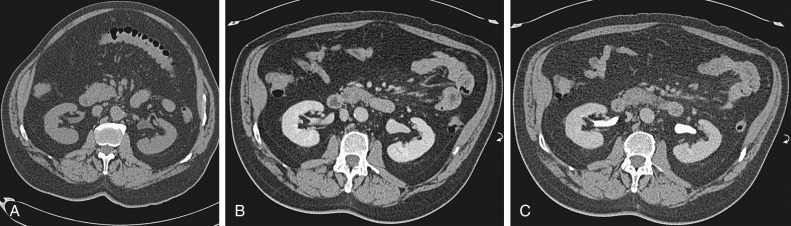
A complete CT evaluation of the kidneys and urinary tract includes assessment of the renal vasculature, the renal parenchyma, and the urinary collecting system. Images are obtained in the angiographic phase (15 to 25 seconds), corticomedullary phase (30 to 60 seconds), nephrographic phase (80 to 120 seconds), and delayed/excretory phase (3 to 10 minutes).
As a general rule, detection of urolithiasis in patients with suspected renal colic should be performed without contrast media.
Multiphasic multidetector volumetric CT evaluation of the kidneys and urinary tract has been termed CT urography. This technique is attractive as a single dynamic comprehensive investigation of the renal parenchyma and urothelium in multiple phases of contrast enhancement. CT urography is most often indicated for the evaluation of hematuria or in patients with known urothelial malignancy.
Specific Indications and Techniques
Urolithiasis and Suspected Renal Colic
Acute flank pain is a common clinical problem and an indication for CT in the emergency setting. CT has been shown to be more sensitive than abdominal radiography and/or IVP for the detection of ureteral calculi, including stones that are small or radiolucent on plain film (e.g., uric acid stones) ( Figures 62-14 and 62-15 ). CT also obviates the need for intravenous administration of contrast media in most cases and may provide an alternative diagnosis in examinations that are negative for urolithiasis. CT has a sensitivity of 100% in detection of ureterolithiasis compared with 67% for IVP and 62% with plain abdominal radiography.
Prone CT imaging of the bladder is sometimes helpful in determining whether a stone in the region of the ureterovesical junction is in the ureter or lying dependently in the bladder. If the ureter is difficult to visualize, intravenous iodinated contrast medium may be administered to determine whether a high-density focus is inside or outside the collecting system. Density measurements of urinary calculi have been used in characterization of the composition of the stones, although results have been less successful in vivo than in vitro. Advances in dual-energy CT have improved the in-vivo detection of renal stone composition.
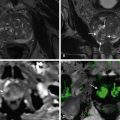
Renal Mass Characterization
Thin-section unenhanced and dynamic contrast-enhanced CT of the kidneys is the study of choice for renal mass characterization ( Figure 62-16 ). Precontrast images detect calcification and provide a baseline density measurement to evaluate the degree and pattern of lesion enhancement. Corticomedullary phase images best depict lesion vascularity, vascular invasion, and vascular anatomic variants. Some lesions, especially smaller masses or the papillary subtype of renal cell carcinoma (RCC) may be difficult to differentiate from normal renal medulla on corticomedullary phase images, necessitating a later phase of enhancement. Nephrographic phase images are the most sensitive for the detection of small lesions. Excretory phase images show whether tumor involves the renal collecting system.
Density measurements of a region of interest within a renal mass on CT may definitively characterize some lesions; for example, a circumscribed mass of water density (HU∼0) without enhancement is a simple cyst. CT can detect whether lesions are multiple, as well as ancillary findings such as lymphadenopathy or venous thrombosis.
In brief, RCCs, most of which are of the clear cell type, are often heterogeneous, with contrast enhancement in some regions and other regions of nonenhancing necrosis. Papillary RCC typically appears hypovascular and homogeneous. Chromophobe RCC may show the spokewheel pattern of contrast enhancement classically associated with oncocytoma. Collecting duct carcinoma and renal medullary carcinoma appear infiltrative, heterogeneous because of intratumoral hemorrhage and necrosis, and hypovascular. Renal tumors are more completely discussed in Chapter 63 ). CT has an accuracy of more than 95% in the detection of RCC.
CT urography is the imaging modality of choice for detection and staging of renal urothelial malignancy, most commonly transitional cell carcinoma (TCC). In the kidney, TCC typically appears as a central soft tissue mass in the renal sinus, which obliterates or displaces the normal hilar structures and renal sinus fat. The mass may be difficult to appreciate or differentiate from normal renal parenchyma, producing the so-called faceless kidney ( Figure 62-17 ). TCC in a calyx or the renal pelvis may appear as a sessile or polypoid filling defect or as diffuse thickening of the urothelial lining. It may cause narrowing or obstruction of the collecting system. Lesions infiltrating the renal parenchyma are best identified on nephrographic phase images, whereas lesions confined to the intrarenal collecting system or renal pelvis are better appreciated on excretory phase images. CT may demonstrate extramural extension and regional nodal metastases.