Ultrasound
Technical Aspects
Ultrasound is a widely accessible, noninvasive imaging method that has many advantages over other imaging methods. It is portable and relatively inexpensive with high spatial and temporal resolution. It does not involve ionizing radiation and can be repeated frequently. Despite increased use of other imaging modalities such as computed tomography (CT) and magnetic resonance imaging (MRI), ultrasound remains, in many settings, the first-line imaging technique for the liver and bile ducts. Indications for liver sonography include screening for pathologic processes, diagnosis, and guidance for interventional procedures.
Technique
Patient Preparation and Positioning.
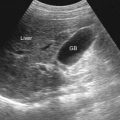
Whenever possible, 4- to 6-hour fasting is desirable, not only to allow the gallbladder to distend but also to reduce the artifacts from bowel gas that interfere in the visualization of the left hepatic lobe. However, in the acute setting or in patients with an unstable clinical status, preparation is not a prerequisite.
A curvilinear probe of 3 to 5 MHz is generally effective for optimal evaluation of the liver. However, in small adults or children when body penetration is not an issue, a linear probe of higher frequency such as 7.5 to 10 MHz is preferred.
Generally, a supine or right anterior supine position allows assessment of the entire liver. However, if excessive overlying bowel gas from the colon or stomach is present, changing the patient’s position to the right anterior oblique or left anterior oblique might help to displace bowel gas.
Scanning Approach and Anatomic Overview.
To adequately scan the parenchyma of the liver and adequately localize a lesion, it is necessary to acknowledge the hepatic segmental nomenclature and separating landmarks.
The majority of the liver parenchyma lies above the costal margin. A subcostal approach with superior angulation allows a good overview of the parenchyma. Intercostal scanning can be helpful to visualize the subphrenic space.
The approaches generally used are those in the longitudinal and transverse planes ( Figures 35-1 and 35-2 ).


When the lower segments of the right lower lobe have not been adequately visualized on the previously mentioned scanning orientations, the patient can be placed slightly on the left, for a left anterior oblique approach. In this setting, the transverse colon and the duodenum are displaced to the midline of the abdomen, allowing better visualization of the right lobe. If the described scans still do not allow good visualization of the parenchyma and vascular structures, the patient can be placed in the left lateral decubitus position.
Normal Anatomy
Relevant Morphologic Features
Each hepatic segment should be carefully evaluated in sagittal and transverse projections. The operator should assess for liver size, contours, echogenicity, and focal masses.
The normal liver size is difficult to determine on ultrasound. It has been estimated that a longitudinal diameter of 16 cm at the midclavicular line can indicate hepatomegaly. However, it is important to consider anatomic variants that can simulate hepatomegaly, such as Riedel’s lobe.
The normal echogenicity of the liver parenchyma is homogeneously mid-echogenic, slightly hypoechoic compared with the spleen, and hyperechoic to isoechoic with respect to the renal cortex. When diffuse abnormal parenchymal echogenicity is encountered, diffuse pathologic processes are suggested.
The border of the liver should be smooth. If nodular or irregular borders are present, cirrhosis or diffuse metastatic infiltration is suggested. It is important to look for small or focal outpouchings of the liver contour and to not dismiss the presence of any focal isoechoic subcapsular lesion, such as focal nodular hyperplasia (FNH), some metastases, and small hepatocellular carcinomas. Therefore, to detect poorly conspicuous lesions, it is important to look for secondary signs, such as deformation of the liver contour, compression of vascular structures, and displacement of the bile ducts and gallbladder.
The portal vein, as well as both of its branches, the hepatic veins, and the hepatic artery should be assessed for thrombosis with color Doppler imaging. Differentiating portal veins and hepatic veins can be difficult. The portal triad contains a branch of the portal vein, hepatic artery, and bile duct, contained within connective tissue, giving the portal veins a more echogenic wall, which hepatic veins do not have.
Normal Hemodynamics
The liver receives a dual blood supply from the portal vein and the hepatic artery. The portal vein supplies approximately 75% of the blood flow, carrying partially oxygenated venous blood from the bowel and spleen. Its intrahepatic portion can be identified within the porta hepatis adjacent to the hepatic artery and common hepatic duct. It is relatively unaffected by the systemic pressure changes from the cardiac cycle, and therefore the portal flow has little or no pulsatility, presenting a monophasic pattern with an approximate flow velocity of 15 to 20 cm/s. The flow within the portal vein should be directed toward the liver (hepatopetal) ( Figure 35-3 ). With the intercostal or subcostal approach, blood flow in the main and left portal veins is directed toward the transducer, whereas the flow in the right portal veins moves away from it.

Reversal of blood flow within the main portal vein or its branches, from the normal hepatopetal to hepatofugal direction away from the liver parenchyma, can be a sign of portal hypertension and is more often present in patients with advanced hepatic disease. The hepatic veins drain into the inferior vena cava near the right atrium, and the flow depends on the right-sided heart cycle. The flow pattern is triphasic, consisting of two anterograde waveforms corresponding to atrial diastole and ventricular systole as well as one retrograde pulse secondary to the right-sided heart contraction of atrial systole ( Figure 35-4 ). The main hepatic artery runs anterior to the main portal vein within the porta hepatis. It provides only 20% to 30% of the liver parenchyma circulation, but it is the main supplier to the biliary tree. The normal hepatic flow pattern is a low-resistance arterial waveform with continuous well-maintained anterograde diastolic flow ( Figure 35-5 ). The normal systolic velocity measures 30 to 40 cm/s with a diastolic velocity of 10 to 15 cm/s. The resistive index in the hepatic artery varies from 0.55 to 0.8.


Diffuse Liver Disease
In many instances, imaging is used to determine the cause of diffuse liver disease, which can be caused by diverse pathologic processes. Ultrasound, although nonspecific, is generally the first-line modality for assessment of the liver parenchyma, with a reported sensitivity ranging from 56% to 89% in detecting abnormalities.
Two patterns of diffuse liver abnormalities have been reported. The most common pattern, the “bright liver,” has been reported in fatty infiltration, chronic hepatitis, and cirrhosis. In this setting, the liver exhibits increased echogenicity and reduced penetration of the sound beam with relatively decreased definitions of portal venules. In the second pattern, in which the parenchyma manifests decreased echogenicity, there is accentuation of the portal venous structures. This is often seen in the setting of acute hepatitis, leukemia, and a few other diseases. According to the findings, the severity of the disease can be categorized into mild, moderate, or severe.
Computed Tomography
Technical Aspects
The advent of multidetector computed tomography (MDCT) scanners has led to alteration and improvement of various CT applications and protocols. Scanners are now capable of producing images as thin as 0.625 mm of isotropic voxel resolution, which improves the detection of liver lesion conspicuity and, more importantly, the detection and characterization of small malignant tumors, with better characterization of the benign pathologic processes and the details of vascular flow. Because of reduction in the hepatic arterial phase acquisition time and thin collimation provided from MDCT, image postprocessing and CT angiography are much better, with a significant reduction in volume averaging artifacts.
Dual-Phase Imaging
Normally, 75% of liver blood supply comes from the portal venous system and the remaining 25% comes from the hepatic arterial system. When iodinated contrast media is injected rapidly (3 to 5 mL/s), the hepatic arterial system is usually the first to opacify—that is, 20 to 30 seconds followed by the portal venous system (50 to 60 seconds); hepatic venous opacification occurs at 65 to 75 seconds. Depending on the scan delay used to acquire the hepatic arterial phase, the images can show mere opacification of hepatic arterial anatomy without parenchymal enhancement (arterial only phase) or with parenchymal enhancement (arterial dominant phase). This is a vital consideration in tailoring MDCT protocols because hypervascular lesions are best visualized in the arterial dominant phase. In other words, better hepatic parenchymal contrast in the hepatic arterial phase is produced as a consequence of better enhancement of only the hypervascular lesions in relation to the rest of the hepatic parenchyma ( Figure 35-6 ). On the other hand, hypovascular lesions are more evident on the portal venous phase and usually appear hypodense compared with the contrast enhancement of background liver parenchyma. Hence, dual-phase CT of the liver is performed in the arterial dominant and portal venous phases ( Figure 35-7 ). The use of triple-phase scanning (arterial only and dominant with portal venous phase acquisitions) has been discouraged because there is no significant benefit to obtaining arterial only scans. Moreover, there is the disadvantage of increased radiation dose to the patient.
Contrast Volume
For optimal image quality, 120 to 150 mL of contrast media of 300 mgI or 100 to 120 mL of 370 mgI is recommended. Patients with cirrhosis require a higher volume of contrast agent to achieve optimal parenchymal enhancement owing to decreased liver perfusion, but authorities have discouraged the use of any iodinated contrast above 150 mL.
Injection rate is a crucial factor while considering the amount of contrast volume that needs to be injected. Although an injection rate of 3 to 4 mL/s may be used for injection of 300 mgI, it is advisable to increase the injection rate to 4 to 5 mL/s to ensure optimal opacification and contrast volume in desired structures. Increasing the injection rate of less volume of high concentration of iodinated contrast media, in other words, compensates for the volume compromise. Thus, with use of higher or lower iodine concentration contrast media, appropriate adjustments in injection rate and contrast volume are needed.
Technical Aspects for Image Postprocessing
The advent and advances in MDCT technology have helped immensely in exploring dimensions of image postprocessing ( Figure 35-8 ). The thinner the axial sections, the better is the image quality; a scan thickness of 2.5 mm is appropriate for ensuring optimal three-dimensional (3D) postprocessing, even for advanced applications such as liver and tumor volume estimations and performance of computer-assisted techniques ( Figure 35-9 ). A reduction in scan length wherever possible should be employed, and appropriate calibration of kilovoltage peak and milliampere settings should be chosen to reduce radiation dose delivery to the patient while simultaneously ensuring absence of image noise.
Postprocessing Techniques for Computed Tomography Angiography
Advances in MDCT scanners have propelled the benefits of image postprocessing and extended its applicability to the clinical scenario. The most frequently employed postprocessing applications are common algorithms such as maximum intensity projection (MIP) and volume rendering (VR), which provide justification to the thin acquisitions if liver CT angiograms are performed for purposes of preoperative planning of tumor and donor surgeries and placement of intraarterial chemotherapy pumps. Certain advanced applications such as volumetry and computer-assisted detection have recently gained importance owing to technical advances in liver and tumor segmentation techniques, which complement a busy workflow.
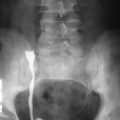
Preoperative knowledge of arterial variants can help avoid complications such as inadvertent ligation or injury of various hepatic arteries, hepatic ischemia, hemorrhage, and biliary leak. Variations in celiac axis anatomy with respect to liver supply are common, and preoperative knowledge is especially important in obese patients who have large amounts of lymphatic and fatty tissue in the duodenal hepatic ligament and the porta hepatis. The techniques usually used for CT angiography of the liver are MIP and VR. Optimal delay time, contrast concentration, and opacification are important. MIP is the most frequently employed postprocessing algorithm for the liver because it provides optimum contrast for highlighting the liver vascular anatomy and its variants, which is crucial for preoperative planning ( Figures 35-10 and 35-11 ). It is essential to visualize and report subtle vascular details in relation to the liver’s segmental anatomy, such as the arterial branch to segment 4. In addition, 3D vascular maps also help surgeons increase their preoperative confidence with localization of such small-diameter vessels, which is essential for prevention of bleeding complications. VR has an additive effect to the MIP images, but at times visualization of very thin diameter vessels may pose a problem. However, as a routine practice, it is advisable for radiologists to view CT angiographic liver studies by reviewing axial data sets followed by MIPs acquired in axial and coronal planes and eventually the 3D vascular maps to confirm their findings. For referring physicians, 3D image maps of MIPs and VR are optimal for providing semblance to the intraoperative picture ( Figure 35-12 ).
Advanced Postprocessing Applications
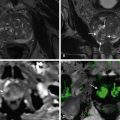
Most workstations are now equipped to provide advanced postprocessing application tools for segmentation, volume estimations, and virtual endoscopy. Segmentation of the liver on CT to estimate total liver volume, partial liver lobe volume, and tumor volumes is an advanced application, the automation of which is being actively investigated ( Figure 35-13 ). Knowledge of total and partial liver volumes is important for planning liver transplants, and estimation of liver tumor volumes is a vital indicator for assessing response to chemotherapy and for planning irradiation. Considering the volume of CT cases of such patients, recent work is more focused on automating these advanced postprocessing applications by computer-aided techniques. Virtual CT cholangioscopy refers to navigation through the common bile duct for assessment of calculi and stenosis, but feasibility of this application for its merger with current workflow is still under investigation.
Dual-Energy Computed Tomography
Dual-energy CT (DECT) is an exciting advance in CT image acquisition and postprocessing, providing radiologists with the ability to improve liver lesion detection and characterization. It offers several potential applications in hepatic imaging previously unavailable with conventional single-energy CT. DECT images are obtained at two distinct energy levels, typically 80 kVp and 140 kVp. This allows for advanced postprocessing of two sets of raw data and the ability to separate materials based on their atomic number. Iodine, water, fat, and calcium can therefore be separated to generate material decomposition (or material density) images. Virtual monochromatic images also can be created to simulate a scan obtained from a monochromatic beam (between 40 and 140 keV), which can be customized to balance contrast and noise.
Increased lesion conspicuity is of particular interest in liver imaging, where detection and characterization can have a big impact on patient imaging, particularly in the oncologic setting. Early experience with DECT has shown that liver lesions are more conspicuous on iodine images obtained at lower energy levels (e.g., 80 kVp) compared to single-energy CT (e.g., 120 kVp). In addition to more easily identifying liver lesions, DECT offers potential for improved lesion characterization. Lesions previously deemed “too small to characterize” on conventional CT can potentially be differentiated as benign cysts or enhancing lesions based on their attenuation on iodine images. Enhancing lesions can be further distinguished based on their pattern of dynamic enhancement, such as arterial enhancement in benign lesions such as FNH ( Figure 35-14 ). Lesion characterization can be further advanced by using water (or virtual unenhanced) images to identify hemorrhage or calcification within a lesion and fat images to evaluate for fat content.
Beyond assessment of liver lesions, DECT can aid in hepatic imaging by helping differentiate tumor thrombus from bland thrombus (i.e., in the setting of hepatocellular carcinoma). Enhancing thrombus can be more easily detected as uptake on iodine images. This has important implications on tumor staging, including determination of liver transplant candidacy. Additional areas of current research include quantification of liver fat content on fat material decomposition images and grading of fibrosis on iodine images based on pooling of iodine in chronic liver disease.
Computed Tomography
Technical Aspects
The advent of multidetector computed tomography (MDCT) scanners has led to alteration and improvement of various CT applications and protocols. Scanners are now capable of producing images as thin as 0.625 mm of isotropic voxel resolution, which improves the detection of liver lesion conspicuity and, more importantly, the detection and characterization of small malignant tumors, with better characterization of the benign pathologic processes and the details of vascular flow. Because of reduction in the hepatic arterial phase acquisition time and thin collimation provided from MDCT, image postprocessing and CT angiography are much better, with a significant reduction in volume averaging artifacts.
Dual-Phase Imaging
Normally, 75% of liver blood supply comes from the portal venous system and the remaining 25% comes from the hepatic arterial system. When iodinated contrast media is injected rapidly (3 to 5 mL/s), the hepatic arterial system is usually the first to opacify—that is, 20 to 30 seconds followed by the portal venous system (50 to 60 seconds); hepatic venous opacification occurs at 65 to 75 seconds. Depending on the scan delay used to acquire the hepatic arterial phase, the images can show mere opacification of hepatic arterial anatomy without parenchymal enhancement (arterial only phase) or with parenchymal enhancement (arterial dominant phase). This is a vital consideration in tailoring MDCT protocols because hypervascular lesions are best visualized in the arterial dominant phase. In other words, better hepatic parenchymal contrast in the hepatic arterial phase is produced as a consequence of better enhancement of only the hypervascular lesions in relation to the rest of the hepatic parenchyma ( Figure 35-6 ). On the other hand, hypovascular lesions are more evident on the portal venous phase and usually appear hypodense compared with the contrast enhancement of background liver parenchyma. Hence, dual-phase CT of the liver is performed in the arterial dominant and portal venous phases ( Figure 35-7 ). The use of triple-phase scanning (arterial only and dominant with portal venous phase acquisitions) has been discouraged because there is no significant benefit to obtaining arterial only scans. Moreover, there is the disadvantage of increased radiation dose to the patient.
Contrast Volume
For optimal image quality, 120 to 150 mL of contrast media of 300 mgI or 100 to 120 mL of 370 mgI is recommended. Patients with cirrhosis require a higher volume of contrast agent to achieve optimal parenchymal enhancement owing to decreased liver perfusion, but authorities have discouraged the use of any iodinated contrast above 150 mL.
Injection rate is a crucial factor while considering the amount of contrast volume that needs to be injected. Although an injection rate of 3 to 4 mL/s may be used for injection of 300 mgI, it is advisable to increase the injection rate to 4 to 5 mL/s to ensure optimal opacification and contrast volume in desired structures. Increasing the injection rate of less volume of high concentration of iodinated contrast media, in other words, compensates for the volume compromise. Thus, with use of higher or lower iodine concentration contrast media, appropriate adjustments in injection rate and contrast volume are needed.
Technical Aspects for Image Postprocessing
The advent and advances in MDCT technology have helped immensely in exploring dimensions of image postprocessing ( Figure 35-8 ). The thinner the axial sections, the better is the image quality; a scan thickness of 2.5 mm is appropriate for ensuring optimal three-dimensional (3D) postprocessing, even for advanced applications such as liver and tumor volume estimations and performance of computer-assisted techniques ( Figure 35-9 ). A reduction in scan length wherever possible should be employed, and appropriate calibration of kilovoltage peak and milliampere settings should be chosen to reduce radiation dose delivery to the patient while simultaneously ensuring absence of image noise.