Multiple sclerosis (MS) is a common disease of the central nervous system, with various clinical symptoms and a heterogeneous disease course. MRI can depict focal and diffuse manifestations of the disease, and accurately measure progression over time. The precise pathogenesis of MS is unknown. Nevertheless, genetic influences have been found for susceptibility to MS in linkage and association studies. More recent genome-wide association studies have revealed other genes to be related to disease susceptibility and severity, explaining part of the variability in symptoms, radiological manifestations and disease course. Studies relating genetics and imaging in MS are discussed in this paper.
Key points
- •
Multiple sclerosis is a heterogeneous disease with complex interacting environmental and genetic causative factors.
- •
Several genes have been associated with multiple sclerosis susceptibility and found to be related to imaging patterns.
- •
Magnetic resonance imaging can especially contribute to the current research of genetic associations with disease prognosis and severity.
Introduction
Multiple sclerosis (MS) is a progressive disease of the central nervous system with a usual onset in young adulthood, often leading to severe disability. Patients can experience a wide range of symptoms, including motor and sensory problems, ataxia, fatigue, and cognitive impairment. The disease course similarly varies to a large extent between patients. Nevertheless, a limited number of different clinical phenotypes can be distinguished. Before definite diagnosis, patients who experience an acute clinical attack that is suspect for a demyelinating event can be labeled as clinically isolated syndrome (CIS). Many of these patients subsequently develop a phenotype called relapsing-remitting (RR) MS, in which exacerbations are followed by full or partial remissions. In about two-thirds of patients this disease type is succeeded by secondary progressive (SP) MS, characterized by a gradual worsening without recovery. A small proportion of patients (10%–15%) experience progressive decline from onset, defined as primary progressive (PP) MS. In addition to these disease courses, there are MS variants and diseases that mimic MS clinically and radiologically, such as neuromyelitis optica (NMO).
There are multiple findings indicating that environmental factors have a causative role in MS that may interplay with genetic variables. The risk of MS is strongly influenced by region of residence in early life, and the global prevalence of MS is related to distance from the equator, being highest in northern Europe and southern parts of Australia and New Zealand. Furthermore, women are more often affected than men and in recent years they may be increasingly affected. Environmental factors suspected to be (partly) causative have been infections such as Epstein-Barr virus, vitamin D deficiency, smoking, and other toxins. However, from familial recurrence rates of 15% to 20% it can be assumed that part of the risk for the disease is influenced by genetic variables. Maybe even more interesting are effects that genes have on MS disease course and progression of disability, although twins concordant for the diagnosis of MS can have different disease courses. In this context, magnetic resonance (MR) imaging parameters can be used as more accurate and pathologically representative outcome measures than any other clinical parameter.
This article summarizes genetic and imaging findings in MS, reviews correlations between genetics and MR imaging parameters, and discusses implications for current knowledge. It also proposes future perspective and research strategies.
Genetics of multiple sclerosis
A large part of genetic research in MS has been focused on genetic susceptibility to MS. Many studies have found clues for a genetic role in susceptibility in the familial clustering of MS. The risk of developing MS is highest for a monozygotic twin; approximately 20% when the other twin is already affected. The risk decreases with the number of shared genes to approximately 2.5% for siblings and 1.5% when one of the parents has MS. Although a low risk, it is still greater than the prevalence of MS in the general population (0.1%–0.3%).
In the past decade, most associations found by linkage studies and candidate gene studies concentrated on the human leukocyte antigen (HLA) locus on chromosome 6. The strongest of associations have been found with the HLA-DRB1*1501 allele of the HLA-DRB1 gene, which is part of a set of genes involved in self versus nonself immune recognition: the major histocompatibility complex (MHC) class II region. Other alleles in immunity-related genes found in these studies have weaker associations to MS susceptibility (odds ratios that are smaller than 2).
The recent ability to use genome-wide association (GWA) studies by assessing single-nucleotide polymorphisms (SNPs) has allowed the detection of new genetic variations with even smaller effects on susceptibility, although these studies require large groups of patients with MS. The GWA studies have resulted in the notion that MS is a complex multigenetic disease, in which several genes are likely to interplay with each other and with environmental factors.
In addition to the aforementioned hypothesis-generating studies, in several studies specific genes have been subject of investigation; for example, those known to be related to neurodegeneration in general, such as brain-derived neurotrophic factor (BDNF) and apolipoprotein E (ApoE).
Imaging of multiple sclerosis
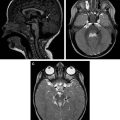
Focal white matter lesions in the brain can be depicted with T2-weighted and fluid-attenuated inversion recovery (FLAIR) images, representing a combination of inflammation, demyelination, axonal loss, and gliosis. Locations considered to be characteristic for MS are the periventricular and juxtacortical areas ( Fig. 1 ), the posterior fossa, and the spinal cord. The appearance of new lesions is considered to be a measure of disease activity, and lesion enhancement on postgadolinium T1-weighted images represents blood-brain barrier leakage in the acute stage of a lesion. These MR imaging features of MS contribute to the most recent diagnostic criteria.
Axonal degeneration in MS occurs both in acute and in chronic MS lesions, and when focally extensive it is mirrored by persistent T1 hypointensity (also referred to as T1 black holes [T1BH]). However, widespread axonal loss can also be found outside focal lesions in the normal-appearing and diffusely abnormal white matter, where it can be detected by more advanced quantitative MR imaging techniques ( Box 1 ), such as diffusion-weighted imaging (DWI)/diffusion tensor imaging (DTI), magnetic transfer imaging (MTR), and MR spectroscopy.
Conventional MR imaging
T2 lesions
- •
Non-specific mixture of pathologic processes including demyelination, gliosis, inflammation, axonal loss
- •
T1 enhancing lesions
- •
Disruption of the blood-brain barrier by active inflammation
- •
Persistent T1 hypointense lesions (black holes)
- •
Associated with severe tissue damage
- •
Brain atrophy
- •
Significant volume loss occurs in MS, correlated with neurodegeneration
- •
Spinal cord imaging
Nonconventional MR imaging
Diffusion-weighted imaging (DWI)/diffusion tensor imaging (DTI)
- •
Measures diffusional motion of water, relates to axonal loss and demyelination
- •
Magnetic transfer imaging
- •
Estimate of tissue structure disruption, associated with axonal damage and demyelination
- •
1 H (proton) MR spectroscopy
- •
Metabolites (eg, N -acetylaspartate and glutamate) can be quantified both in lesions and normal-appearing brain matter
- •
Functional MR imaging
- •
Can be measured during task or rest
- •
Changes may represent functional reorganization
- •
Voxel-based techniques
In the last decade, it has come to light that gray matter pathology in MS are abundant and clinically meaningful. Focal gray matter lesions are more difficult to identify with conventional MR imaging than white matter lesions, although their visualization can be improved by a more sensitive MR imaging technique called double-inversion recovery (DIR; see Fig. 1 ) and by using (ultra)high-field MR imaging. Loss of brain volume (BV) over time, or atrophy, can be reliably measured for both white matter and gray matter ( Fig. 2 ), and assesses the end-stage of the disease process.
Spinal cord abnormalities, either focal or diffuse, are found in most patients with MS and are strongly related to prognosis. They can be accurately depicted with proton density–weighted and T2-weighted imaging. Similar to the brain, quantitative MR imaging measures of the spinal cord are more specific with respect to the underlying pathophysiologic process and correlate well with disability. The extent of spinal cord abnormalities varies greatly between patients with MS and is not strongly related to the extent of brain abnormalities within patients.
MR imaging is able to characterize imaging phenotypes that are more directly influenced than clinical outcome measures by pathophysiologic mechanisms, and therefore can be more straightforwardly linked to genotypes. The use of MR imaging in MS genotype-phenotype studies does not only add an objective and repeatable measure of disease severity, it also allows selection of patient groups based on imaging patterns. The goal of using MR imaging as an intermediate phenotype in MS can be 2-fold: it may allow detection of new genetic polymorphisms that relate to MS and thereby induce new insights in disease mechanisms, and it can also provide new prognostic markers for disease severity.
Associations of multiple sclerosis susceptibility genes with brain magnetic resonance imaging
Several studies have investigated whether susceptibility genes can explain differences in disease severity. For example, large variation can be found between patients with MS with regard to the number and volume of T2 lesions in the brain. An association between the allele with the strongest effect on MS susceptibility, HLA-DRB1*1501, and T2 lesion volume was found by Okuda and colleagues. However, this association was not confirmed in other studies. Likewise, although some studies have reported associations between susceptibility genes with T1BH, in others no significant relations could be found. The dissimilar results between the studies described above could in part be caused by the heterogeneity of the patient groups, often consisting of several disease types.
In patients with CIS, associations between HLA status and number and volume of gadolinium-enhancing lesions were found. However, in a longitudinal study by the same group with 179 patients with CIS and 16 susceptibility SNPs, including HLA-DRB1, no relations with T2 lesion load (T2LL) or BV were found.
In most of the studies using BV as an outcome measure, no associations with known susceptibility genes have been found ( Table 1 ). Among the SNPs investigated have been HLA genes, KIF1B (a gene involved in axonal transport), and interleukin receptor genes.
| Study, Year | Patients (CIS/RR/SP/PP) | HC | MR Imaging | Most Important Findings |
|---|---|---|---|---|
| Baranzini et al, 2009 | 987 (100/659/137/72) a | 883 | T2LL, BV | GWA; T2LL and BV associated with multiple (non-HLA) SNPs, not with HLA-DRB1*1501 |
| Gourraud et al, 2013 | 484 (76/343/45/20) | — | LPM | GWA; 31 SNPs associated with lesion pattern |
| Healy et al, 2010 | 532 (17/351/123/37) b | 776 | T2LL, BV | HLA B44 associated with higher BV and lower T2LL |
| Hooper-van Veen et al, 2003 | 492 (-/221/172/99) c | 228 | T1BH, T2LL, BV | No associations interleukin-1 polymorphism with MR imaging |
| Hooper-van Veen et al, 2006 | 489 (-/220/175/440) d | 180 | T1BH, T2LL, BV | Change in T1BH associated with CD28, IFNGR2, IL1B-511 |
| Horakova et al, 2011 | 205 (CIS only) | — | T2LL, T1Gad, BV | HLA-DRB1*1501 associated with higher T1Gad, not with BV |
| Jensen et al, 2010 | 1006 (RR and SP e ) | — | BV (ICR) | No associations 7 susceptibility SNPs with BV |
| Kalincik et al, 2013 | 179 (CIS only) | — | T2LL, BV | No associations 16 susceptibility SNPs with T2LL and BV |
| Karrenbauer et al, 2013 | 100 (-/79/19/2) | — | T2LL, T1BH, lesion location | No associations HLA-DRB1*15 or *04 with MR imaging |
| Okuda et al, 2009 | 505 (88/352/46/14) | — | T2LL, T1Gad, MRS | Higher T2LL and lower NAA in NAWM in HLA-DRB1*1501 + patients |
| Qiu et al, 2011 | 252 (-/119/117/16) | — | T2SC | No associations HLA-DRB1 alleles and number/location SC lesions |
| Sepulcre et al, 2008 | 50 (15/28/3/4) | — | T2LL, BV, LPM | No association HLA-DR2 status with lesion distribution and BV |
| Schreiber et al, 2002 | 71 (21/40/10) | — | T2LL | No associations HLA with T2LL |
| Sombekke et al, 2009 | 150 (-/88/32/30) | — | T2LL, T2SC | HLA-DRB1*1501 not associated with T2LL |
| Sombekke et al, 2011 | 208 (-/126/42/40) | — | T2LL, LPM | MHC II region SNP associated with lesion distribution |
| Van der Walt et al, 2011 | 978 (-/639/339/-) f | — | BV (ICR) | No associations HLA-DRB1 alleles with BV |
| Zivadinov et al, 2003; 2009 | 100 (-/71/16/13) | 122 | T2LL, T1BH, BV | B7 associated with higher T2LL and T1BH; DRB1*12 with higher T1BH and lower BV |
| Zivadinov et al, 2007 | 41 (-/27/7/7) | — | T2LL, T1BH, BV | Multiple HLA alleles associated with MR imaging (eg, HLA-DRB1*1501 associated with lower BV and higher T1BH) |
a MR imaging analysis limited to RR and SP.
b MR imaging available in 375 patients.
c MR imaging available in 96 patients.
d MR imaging available in 94 patients.
e Precise distribution not mentioned.
In addition to the large range of number and volume of lesions in patients with MS, anatomic location of lesions within the brain varies widely among patients. This variety in involvement of the cerebrum, brainstem, and cerebellum may partly be explained by genetic differences. This possibility was investigated by examining the effect of 69 candidate SNPs on a lesion probability map of 208 patients with MS, showing increased probability for lesions in certain brain areas for 5 SNPs and decreased probability for lesions in 6 SNPs. The most statistically robust finding was the increased probability of having a lesion in the cerebral white matter against the frontal and occipital horn of the left lateral ventricle, for the heterozygous genotype of rs2227139, located within the MHC class II region. In another study comparing T1BH and T2 lesion probability maps between 50 patients with MS with negative and positive HLA-DR2 status (determined by the presence of the HLA-DRB1*1501 allele, present in 30% of patients), no significant differences in lesion distribution were found, and neither did gray or white matter atrophy differ. A GWA study found several SNPs associated with one of the lesion distribution patterns found in a group of 284 patients with MS. The genes involved have immunity-related but also neural functions. Also, a different lesion pattern in this study was found between patients with versus without the HLA-DR1*1501 allele.
Cortical lesions were recently found to be abundant in MS, in post-mortem studies as well as in vivo with MR imaging, and to be correlated with disability including cognitive impairment. No studies assessing potential genetic associations with the prevalence of cortical lesions have yet been conducted. In one case report 4 sisters with RR MS were described, each of them having a disproportionally high number of cortical lesions, suggesting a genetic predisposition.
Genetic associations with neurodegeneration in multiple sclerosis
Pathologic and radiological studies have revealed that neurodegeneration is an important feature of MS. This insight is stressed by patients treated with antiinflammatory drugs having fewer exacerbations but nevertheless experiencing gradual ongoing functional loss. MR imaging parameters that may represent neurodegeneration are BV measurements, spectroscopic assessment of N -acetylaspartate (NAA) levels, and T1BH. In this context, longitudinal studies may more accurately create contrasting patient groups for neurodegeneration.
Several genes that have been associated with either neurodegeneration or a neuroprotection in animal analogs of MS or in other diseases have been studied and are reviewed here.
Brain-derived Neurotrophic Factor
BDNF is a growth factor produced in the brain and that is heavily involved in synaptic plasticity and neuronal growth. A well-studied BDNF polymorphism in which the amino acid valine is substituted for methionine at codon 66 (Val66Met) leads to reduced secretion. Although the effect of this polymorphism on cognition in healthy subjects is inconsistent, it has been associated with many neurodegenerative disorders. Release of BDNF by immune cells has been shown in active MS lesions, which hypothetically may have an impact on neuronal preservation. Studies on the BDNF polymorphisms on MR imaging measures in MS have shown inconsistent results ( Table 2 ), although most of the relations found affected gray matter volume (GMV) and only 1 of the studies found a relation with lesion volume. Presence of the BDNF Met66 allele in patients with MS has been associated with lower GMV compared with the homozygous BDNF Val66 allele in patients with MS, and was associated with low GMV values in another study. In contrast, higher GMV was related to presence of BDNF Met66 in a study consisting of 209 patients with MS, with post-hoc analysis using voxel-based morphometry (VBM) specifically showing higher GMV in the cingulate. Lower GMV was found in patients homozygous for BDNF Val66 compared with controls but not in patients with BDNF Met66 in a study by Dinacci and colleagues. In a study in which polymorphisms at another BDNF location (rs2030324) were evaluated, associations with left thalamus volume were found.
Related posts:


Stay updated, free articles. Join our Telegram channel

Full access? Get Clinical Tree


