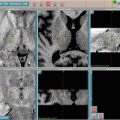
Fig. 2.1
Split window display of image registration of MR and CT for a right parietal brain metastasis for SRS treatment planning in the axial (right image), sagittal (middle image), and coronal (left image) views
MRI Alone for SRS Simulation and Planning
More recently, MRI has been used as a stand-alone modality for SRS treatment planning. Traditionally 1.5 T MR scanners have been used for this purpose. There is increasing interest now in the use of 3 T MR scanners, which have a higher signal to noise ratio and consequently higher spatial resolution and shorter image acquisition time. A recent study by Zhang et al. showed that the geometric accuracy achieved with 3 T MRI is comparable to 1.5 T MRI for SRS treatment planning [2]. The advantage of MRI-based planning is that it removes systematic errors that may occur due to CT-MRI registration and eliminates radiation exposure from the CT scan. However, this must be balanced against potential disadvantages of omitting the CT scan including possible spatial distortion of the MRI scan due to gradient field nonlinearity and magnetic field inhomogeneities, the lack of electron density information used for dose calculation, and the difficulty in patient setup verification during treatment delivery [3]. MRI simulation may also require a larger bore for patient setup to allow for appropriate MRI compatible immobilization devices.
Solutions to these shortcomings of MRI-based plans are being developed. The lack of an identifiable relationship between MR image values and electron densities has been addressed in a variety of ways. Early treatment planning using MRI alone involved assignment of bulk densities (e.g., to bone and the rest of the brain), which resulted in a smaller (1–1.5 %) calculated dose difference between the MRI-based and a CT-based plans when compared to plans without bulk density assignment. More recent work has included use of electron density atlases and statistical modeling of tissue composition to assign attenuation properties. Recent developments which may benefit MRI–PET systems as well as radiation oncology include ultrashort TE (UTE) imaging and even more sophisticated attenuation models [4, 5]. These methods may reduce uncertainties of MR planning in most regions of the brain to a fairly insignificant level in the near future. One issue of note, however, is the potential for local distortion effects, e.g., due to air–tissue interfaces, which may cause displacements of 1–2 mm over very short distances from the interface (<1 cm) [6].
Radiologic and Anatomic Considerations During Treatment Planning
The goal of SRS is not only to give a maximal dose of focal radiation to the target but also to prevent injury to the surrounding normal tissue. Both tumor size and proximity to surrounding structures need to be taken into consideration during treatment planning.
Tumor size dictates the feasibility of radiosurgery. Increasing tumor size results in an exponential increase in the margin of normal brain tissue irradiated and is potentially associated with a higher risk of complications. Results from the RTOG 9005 trial showed significantly higher CNS toxicity in patients with larger tumor diameters [7]. Tumors with diameters between 2.1 and 3 cm have a 7.3-fold increased risk of developing toxicity over tumors with diameters of 2 cm or less. Tumors between 3.1 and 4 cm had a 16-fold increased risk. In general, SRS is recommended for tumors less than 4 cm in size [7].
The safety of SRS and the rates of post–treatment complication can also vary based on the location of the tumor relative to the surrounding cerebral structures. In a review by Flickinger et al., the rate of symptomatic radiation necrosis was highest (threefold increased risk) for arteriovenous malformation (AVM) lesions in the basal ganglia and the brainstem (pons, midbrain, medulla) [8]. In contrast, the risk of radiation injury remained low (even with increased volumes) for lesions irradiated in the frontal and temporal lobes.
Similarly, the proximity of critical neuroanatomic structures to the targeted area is important to consider during SRS planning. Relative contraindications for SRS include close proximity or involvement of the optic tract including the optic nerves and chiasm. The optic apparatus dose is generally limited to 10 Gy to limit the risk of optic neuropathy [9, 10]. In contrast, the remaining cranial nerves have somewhat higher dose tolerances [11, 12].
Physiologic MR Imaging and Metabolic PET Imaging in SRS
Physiologic MR and metabolic PET imaging can add to information obtained by morphological imaging and serve as a surrogate marker for specific biologic processes. These imaging techniques permit in vivo analysis of tumor tissue properties including chemical composition, tumor vasculature, perfusion, and tumor cellularity [13].
Assessing tumor response after SRS can be difficult due to occurrence of early nonspecific imaging changes that can represent either recurrent or progressive tumor, or treatment-related inflammatory and/or necrotic changes such as areas of contrast enhancement and edema on T1-weighted imaging. Underlying processes of radiation injury cause a temporary increase in contrast enhancement on MRI, termed “pseudoprogression,” making the differentiation between true progression and radiation effects extremely difficult. Mechanisms that may contribute to radiation-induced neurotoxicity include vascular injury, glial and white matter changes, and immunological mechanisms.
Advanced MR imaging techniques are now becoming routinely available and will continue to play an increasingly important role in aiding in the precise definition of at risk target volumes as well as the assessment of treatment response [14–16]. In this section, a brief overview of these imaging techniques will be described.
Dynamic Susceptibility Contrast MRI
Dynamic susceptibility contrast (DSC) T2*-weighted imaging is the preferred method to map whole-brain perfusion properties [17–19]. Dynamic acquisition of T2*-weighted MR imaging during intravenous injection of Gd-DTPA allows estimations of cerebral (tumor) blood volume (CBV), cerebral (tumor) blood flow (CBF), and mean bolus transit time (MTT). These parameters can be measured in the imaged volume by mathematical deconvolution of the arterial input function (from a cerebral artery) and the tissue response signal. These perfusion parameters provide assessment of tumor viability, tumor vascular properties, and transport kinetics following therapy [13]. Several studies have shown a correlation between cerebral blood volume and the histological grade of the tumor [20, 21].
Dynamic Contrast-Enhanced MRI
Dynamic contrast-enhanced (DCE), MR imaging using T1-weighted imaging provides a method for quantitative assessment of tumor vascular permeability. DCE MRI is obtained following dynamic acquisition over several minutes during intravenous injection of a bolus of Gd-GTPA. Estimations of vascular permeability with DCE MRI require the application of pharmacokinetic models with an arterial input function and therefore are more complex than CBV estimation. DCE MRI has been shown to be important in assessment of treatment response following both anti-angiogenic agents and radiation [22].
MR Spectroscopy Imaging
MR spectroscopy is a technique to detect proton metabolites in tissue, in vivo. This imaging technique provides information regarding tumor proliferation, cell membrane breakdown, neuronal activity, and tumor necrosis [15, 23]. Most commonly detected metabolites include choline-containing compounds, creatine, lactate, lipid, and N-acetylaspartate. Spectroscopic images are obtained with either two-dimensional or three-dimensional means of acquisition. This is achieved by mapping the concentration of each of the compounds within voxel sizes of approximately 1 cm3. Malignant tumors are characterized by an elevated choline to N-acetyl aspartate (NAA) ratio due to greater cell membrane phospholipid turnover from increased tumor proliferation as well as decreased NAA compared to the normal brain [24, 25]. Several studies have demonstrated the utility of MR spectroscopy in pretreatment evaluation and radiotherapy planning as well as in differentiating radiation necrosis from recurrent tumor [26–28].
MR Diffusion and Diffusion Tensor Imaging
Diffusion MRI measures the mobility of water within tissues at the cellular level and therefore can detect microenvironment changes in tumor tissue. Changes in diffusion can occur due to cell swelling, necrotic/apoptotic cell death after therapy, or extracellular water space changes as a result of edema [29]. Changes in tumor such as cytolytic cell death following successful therapy lead to transient increases in regional diffusion, which may be an important early indicator of treatment response. The extent of directional diffusion can be estimated with an apparent diffusion coefficient (ADC). Diffusion has traditionally been analyzed using average ADC values throughout an entire tumor, which can significantly underestimate regional changes following therapy [30]. The parametric response map (PRMADC) has been developed as a voxel-wise approach for evaluating ADC changes and has been found to be an independent, early predictor of overall survival [31]. ADC maps are largely independent of the MRI system, vendor, and field strength. Therefore, it provides an accurate and noninvasive method of performing longitudinal studies [32].
Diffusion tensor imaging (DTI) is a diffusion technique that allows visualization of white matter architecture and has been increasingly investigated as an imaging biomarker for detecting physiological changes prior to any changes on conventional imaging [33]. Previous studies have suggested that changes in diffusion index of normal appearing brain white matter structures following radiation may also be an indicator for delayed radiation-induced neurotoxicity [34]. These studies examined changes in diffusion indices including fractional anisotropy (FA) as an index of fiber integrity, mean diffusivity (MD) as an index of overall diffusivity, radial diffusivity (RD) as an index of demyelination, and axial diffusivity (AD) as an index of fiber degradation [35]. Surgical series have demonstrated the utility of DTI in reducing the risk of morbidity of brain tumor resections near critical structures. Similar incorporation of DTI tractography imaging in SRS may be valuable with regards to delineation of normal tissue avoidance structures in treatment planning for lesions near eloquent regions (Fig. 2.2) [36]. Incorporation of tractography data in SRS treatment planning has been shown in studies to lead to decreased dose to critical structures including the optic tract and pyramidal tracts [37].
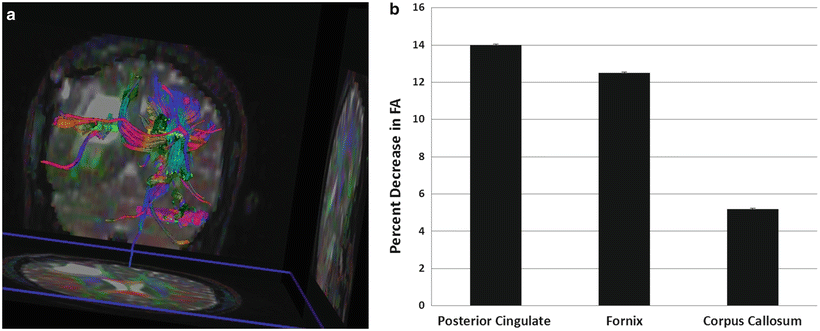

Fig. 2.2
(a) MR diffusion tensor imaging and tractography illustrating a right parietal–occipital mass and the bilateral corticospinal tracts. Peritumoral edema appears to infiltrate and displace the posterior and superior part of the right corticospinal tract compared to the left. (b) Quantitative DTI analyses were performed on specific white matter structures including the posterior cingulate, fornix, and corpus callosum. Fractional anisotropy (FA) values in the cingulum and fornix show significant decreases compared to the corpus callosum 1 month following radiation, suggesting increased radiation sensitivity. Preliminary data showing a correlation between early diffusivity changes and late decline in verbal recall suggest that DTI imaging may be a useful biomarker for late CNS toxicity [34]. Means and standard errors of the percentage decrease in FA 1 month post-RT are plotted
Metabolic PET Imaging
With a number of tracer compounds available, PET and SPECT allow for noninvasive measurements of tumor hypoxia, proliferation index, and markers of apoptosis [38, 39]. The cellular and physiological information obtained may be used in combination with MR imaging, which still has relatively superior spatial resolution, to improve target volume definition in radiotherapy planning [40].
11C Methionine (MET)-PET visualizes increased radiotracer uptake by metabolically active tumor. It is able to detect increased cellular metabolism in brain tumors involving increased protein transport mediated by l-type amino acid carriers at the blood–brain barrier level compared with normal brain tissue [41]. It is able to better differentiate tumor from background brain signals than 18F-labeled 2-fluoro-2-deoxy-d-glucose (FDG)-PET, which is more difficult to interpret due to the high level of intrinsic glucose uptake in the brain.
18F-fluorothymidine (FLT)-PET uses the alternative tracer FLT, which is a thymidine analogue that is incorporated exclusively into DNA. This allows measurement of the activity of cellular thymidine kinase, which increases several folds as cells enter the S phase and begin DNA synthesis. Therefore, increased FLT uptake is a direct measure of cellular proliferation rate and correlates with Ki-67 staining [42].
Imaging Consideration in the SRS Treatment of Malignant Tumors
Brain Metastases
Whole-brain radiotherapy has been the mainstay of treatment of brain metastasis. However, there has been a recent shift toward greater use of stereotactic radiosurgery in patients with a limited number of brain metastases and with controlled systemic disease in order to increase dose to tumor and minimize neurocognitive morbidity [43].
SRS target volume definition for brain metastasis is typically accomplished using conventional thin-cut CT or T1-weighted MR imaging with contrast enhancement.
Studies have reported on improved outcomes with the addition of a 1–2 mm margin to account for microscopic disease in the SRS treatment of brain metastases [44, 45]. The additional margin may be necessary to account for possible infiltrative tumor growth beyond the enhancing border as well as the limited accuracy of delineation of the enhancing border based on current imaging methods. A study by Baumert et al. evaluated specimens from 76 metastatic brain lesions and found that 63 % of the specimens showed tumor infiltration beyond the metastases boundary, with small-cell lung cancer and melanoma showing a maximum depth of infiltration of >1 mm and other histologies <1 mm [45]. Non-small cell lung cancer, melanoma, and sarcoma also showed the most number of infiltration zones outside the boundary. Another study by Noel et al. found that the addition of a 1 mm margin on MRI to account for microscopic disease extension for brain metastases improved the 2-year local control rate from 51 to 90 % [44].
SRS is also frequently used as adjuvant treatment to maximize local control following surgical resection, with reported control rates of approximately 80 % [46]. In planning treatment in the adjuvant setting, one also needs to take into consideration changes in the size of the surgical cavity when delineating the target volume. In a study by Atalar et al. on 68 lesions, the postresection cavity volume was smaller than the preresection tumor volume by a median percent volume change of 29 % [47]. The authors found that the greatest volume change occurred immediately after surgery during postoperative days 0–3, with no significant change occurring up to 33 days after surgery. Thus, there may not be a benefit to an extended waiting period prior to proceeding with SRS. A planning margin for microscopic extension has also been shown to improve control in the adjuvant setting. A study by Soltys et al. analyzed 76 resection cavities that were treated with radiosurgery [48]. Less conformal treatment plans with a 2.4 mm margin of brain tissue around the cavity had a 100 % local control rate, compared with 78 % for a 1.7 mm margin, 52 % for 1.5 mm, and 43 % for 0.8 mm. Toxicity was minimal and therefore the inclusion of a 2 mm margin to improve local control was recommended.
Assessment of Treatment Response
Novel imaging techniques in addition to conventional contrast-enhanced MRI are now more frequently used to assess brain metastasis response following radiosurgery.
MR diffusion imaging has been used in the evaluation of SRS treatment response (Fig. 2.3). Several studies have noted that longitudinal ADC values may be important in predicting early tumor response to SRS treatment. In a prospective study by Huang et al., 21 patients with 32 brain metastases were analyzed. ADCs were measured both prior and following SRS [49]. ADC values for the group showing radiation-induced central necrosis was significantly higher than those demonstrating recurrent tumor growth. Similar results were noted in a prospective trial of 38 patients treated with gamma knife radiosurgery for brain metastases with significant increases in mean ADC values indicative of stable disease and unchanged ADC levels indicative of tumor recurrence [50]. The changes in ADC occurred before any definitive change in volume were evident on further imaging studies. In another study, posttreatment ADC patterns compared with initial diffusion imaging were used to predict ultimate treatment outcomes on serial MR imaging in 25 metastatic tumors [51]. The authors found that the normalized ADC patterns outperformed initial posttreatment tumor volume in predicting long-term response to treatment.
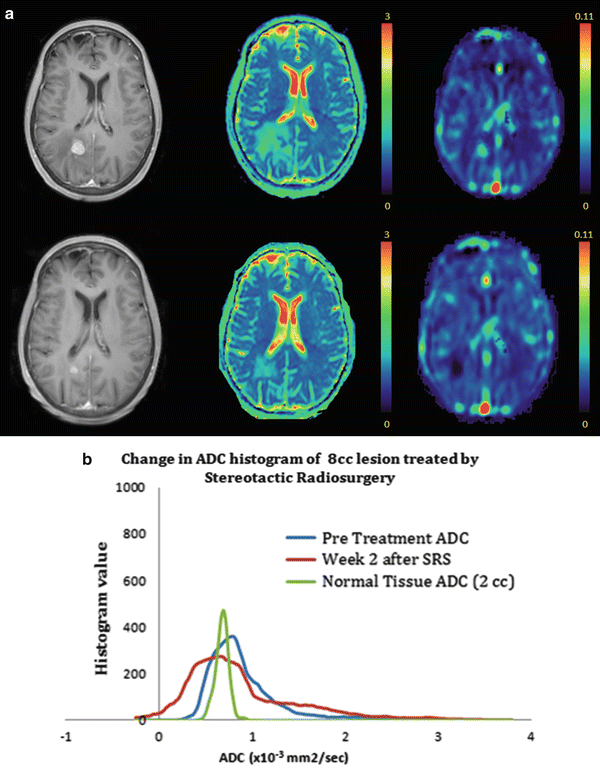

Fig. 2.3
(a) T1-weighted images (right), ADC map (middle), and perfusion map (left) are shown at baseline prior to SRS for a right parietal brain metastases (top row) and 1 month post SRS treatment (bottom row). Qualitatively, there are significant decreases noted in tumor volume, diffusion, and perfusion 1 month after treatment. (b) Mean ADC histogram analyses performed for the normal tissue (green), a region of interest corresponding to a brain metastases at baseline (blue) and 2 weeks after SRS (red ). Quantitative ADC histogram analysis demonstrate the fractional tumor subvolume with low ADC appeared to increase 2 weeks after SRS consistent with a nonresponsive or progressive tumor confirmed on subsequent follow-up imaging at 4 months
At the University of Michigan, alterations in vascular volume and permeability in brain metastases, as measured using dynamic contrast-enhanced MRI hve been analyzed to predict subsequent volumetric response following radiation. In a recent prospective study that evaluated 43 lesions from 20 patients, results showed that the percentage decrease in the high-CBV-defined subvolumes of the tumor was greater in the group of responsive tumors than in the group of stable and progressive tumors (P < 0.007). Perfusion changes were a significantly better predictor for post-RT response than changes in the gross tumor volume observed during the same time interval (P = 0.012), suggesting that physiological changes occur prior to volumetric changes [52].
PET imaging, including FDG PET, has also been evaluated for differentiating between recurrence and posttreatment changes. Studies have shown that areas of radiation injury have lower glucose metabolism than normal brain tissue due to lower cellular attenuation [53]. Varying degrees of accuracy of FDG-PET in detecting tumor recurrence versus radiation necrosis have been reported. Several retrospective analyses have shown sensitivity in detection of tumor recurrence ranging from 80 to 100 % and specificity higher than 80 %; however, these studies lacked histopathological validation [54, 55]. In a study of 15 patients with a histopathologically confirmed diagnosis, Thompson et al. showed that FDG-PET was sufficiently sensitive to differentiate recurrent tumor from radiation effect in only 43 % of the cases and was least accurate when the lesion volume was less than 6 cm3 [56].
MET–PET may provide a better method for differentiating radiation necrosis from recurrent tumor. In 21 patients with suspected recurrent metastatic brain tumor or radiation injury, MET-PET scans showed a sensitivity of 78 % and specificity of 100 % in detecting tumor recurrence [57]. In another study of 77 patients, a mean SUV ratio of lesion uptake to contralateral normal gray matter uptake of greater than 1.41 provided the best sensitivity (79 %) and specificity (75 %) for metastatic brain tumor and a value of greater than 1.58 provided the best sensitivity (75 %) and specificity (75 %) for recurrent glioma [58].
Recurrent Gliomas
SRS has been increasingly used as a potential treatment option for recurrent gliomas in combination with anti-angiogenic agents following an initial course of standard fractionation of RT in combination [59].
Novel imaging techniques can be utilized in treatment planning, especially in cases where there is no tissue confirmation of recurrent disease (Fig. 2.4). MR spectroscopy has been shown to potentially improve target delineation. Areas of contrast enhancement on T1-weighted conventional MRI do not always correspond to the most aggressive areas as reflected by high choline concentration. The extent of elevated choline has been found beyond the tumor volume defined by Gd enhancement or hyperintense lesions on T2-weighted or FLAIR images [60, 61]. Several studies have suggested that elevated choline peaks correlate with higher tumor grade. In a study of 247 tissue specimens from 31 untreated patients with low- or high-grade glioma, choline peak height normalized to contralateral creatine and choline or ipsilateral NAA significantly correlated with tumor cell density [62].


Fig. 2.4
Multimodality MR imaging for target volume definition for a left temporal glioblastoma. T1 post-gadolinium notes a contrast-enhancing lesion (far left image) with significant peritumoral edema shown on MR FLAIR imaging (second image from left). Perfusion map shows areas of high CBV (red) extending beyond the contrast-enhancing tumor rim as defined by T1 post-gad (third image from left). This shows the potential for perfusion MRI to identify aggressive subvolumes in gliomas [11]. C MET PET (far right image) also provides additional information for target volume definition compared with conventional MR regarding tumor extension along the white matter tract
The degree of spatial overlap between tumor volumes with elevated choline and the radiosurgical target volume has been correlated with clinical outcome. A retrospective study in patients with recurrent GBMs treated with SRS found an improvement in survival if the target volume overlapped with the pretreatment MR spectroscopy metabolic lesion by 50 % or greater (median OS 15.7 versus 10.4 months, P < 0.01) [63].
Newer imaging techniques are also crucial in posttreatment follow-up of recurrent gliomas as posttreatment contrast-enhancing lesions often consist of a mixture of tumor cells and tissue with radiation injury and therefore are difficult to accurately differentiate noninvasively.
MR spectroscopy is one modality that is being increasingly used to distinguish the two in the posttreatment setting. However, there is currently no consensus in the literature on which calculated ratios can best differentiate tumor recurrence from radiation injury. One study of 100 tissue biopsy samples from 44 patients with grade 2-4 gliomas, a choline/NAA ratio cutoff threshold of 2.5, was able to differentiate recurrent tumor from normal, edematous, and necrotic brain tissue, with an approximate 90 % sensitivity and 86 % specificity [64]. Another study showed the ability to differentiate tumor recurrence from radiation injury in 27 of 28 patients by using a cutoff value of 1.8 or greater for the choline/NAA or choline/creatine ratio representing tumor recurrence [28].
MR perfusion imaging has also shown its utility in post SRS treatment evaluation. One study prospectively evaluated 42 image-guided tissue specimens from 13 patients with high-grade glioma using threshold relative CBV values to distinguish recurrent tumor from radiation changes [65]. The authors found that the treatment-related group had relative CBV values from 0.21 to 0.71, while the recurrent tumor group had CBV values from 0.55 to 4.64. A threshold value of 0.71 therefore optimized differentiation between the two groups with a sensitivity of 91.7 % and specificity of 100 %.
Imaging Considerations in the SRS Treatment of Benign Lesions
Acoustic Neuroma (Vestibular Schwannomas)
Acoustic neuromas are benign neoplasms derived from Schwann cells of the myelin sheath that show a predilection for involvement of sensory nerves. Acoustic neuromas account for approximately 5–8 % of intracranial tumors and 80–90 % of cerebellopontine angle tumors. Retrospective data have shown excellent tumor control rates with stereotactic radiosurgery [66]. A University of Pittsburgh study of 216 patients with unilateral acoustic neuromas treated with Gamma knife (marginal tumor dose of 12–13 Gy) showed a 10 year resection-free control rate of 98.3 %, low toxicity with good rates of hearing preservation (Robertson–Gardner serviceable hearing 45 %), and high preservation rates of trigeminal and facial nerve function [67].
Contrast-enhanced MRI is used to evaluate treatment response. Following SRS treatment, clinical data suggest that acoustic neuromas may temporarily expand in size initially and then stabilize. Thus, a longer period of follow-up is required before determining disease progression. A retrospective review of 75 patients showed that 23 % had evidence of pseudoprogression with onset of enlargement at 6 months, of which 9 % remained larger than initial volume at last follow-up. No further progression was seen beyond 24 months for all patients [68]. Another study involving 87 patients showed that peak tumor volume expansion was observed at 8.6 months after SRS [69]. At 5 years follow-up, the mean reduction in tumor volume was 31 %. However, there were still 10 % of tumors that remained larger than their initial volume.
Considering the potential for pseudoprogression, follow-up recommendations include posttreatment MR imaging to establish a baseline and at 24 months, followed by yearly imaging. In general, salvage therapy is not recommended before 2 years unless there is clinical deterioration.
Hydrocephalus can also be seen on follow-up imaging, a potential complication following SRS treatment of acoustic neuromas. In a retrospective review of 444 patients treated with radiosurgery, symptomatic communicating hydrocephalus developed in 5.6 % of patients, with a median time to symptom development of 7 months [70]. Patient monitoring for development of hydrocephalus is recommended following SRS treatment for up to 3–4 years.
Trigeminal Neuralgia
Trigeminal neuralgia is a painful syndrome resulting in intense and often severe episodes of lancinating pain occurring in the distribution of cranial nerve V. Although benign, trigeminal neuralgia can significantly diminish a patients’ quality of life. Common treatment options include antiepileptics, neuroleptics, opioids, and antidepressant medications. When medication fails to alleviate the effects of trigeminal neuralgia, available treatments include microvascular surgical decompression, ablation, and SRS. SRS has been highly successful in pain control, with excellent response in 70–90 % of patients [71]. In a prospective clinical trial, 100 patients were treated with Gamma Knife radiosurgery to a median dose of 85 Gy [72]. Of the total, 83% of the patients were pain free at a minimum follow-up time of 12 months and 70 % had stopped taking medications during the study. Post treatment complications were minimal, with facial paresthesia in 6 % and hypesthesia in 4 %.
MRI is of paramount importance for the accurate planning of SRS treatment of trigeminal neuralgia. Studies have shown relatively limited use of imaging in predicting effective treatment outcome because the evidence of treatment benefit or treatment failure is most often readily apparent before enhancement occurs. Posttreatment follow-up with contrast-enhanced MRI taken at 6 months can provide for target confirmation due to the high prevalence of contrast enhancement. The posttreatment imaging characteristics of trigeminal neuralgia were assessed by Massager et al., who reported that at 6 months post-treatment, contrast enhancement on T1-weighted MRI was seen in 83 % of trigeminal nerve roots [73]. However, they found no correlation between the occurrence of focal enhancement of the nerve root and pain outcome, or development of trigeminal dysfunction. Repeated serial imaging is generally not considered helpful in those patients who did not initially present with radiologic or neurologic changes on the initial posttreatment scan. Nor is serial repeat imaging recommended for those patients who respond well clinically unless neurological deficits emerge. Imaging may be used for the assessment of potential radiation-related injury to the brainstem.
Stay updated, free articles. Join our Telegram channel

Full access? Get Clinical Tree


