Chapter 5 Imaging with x-ray, MRI and ultrasound
Introduction
Diagnostic ultrasound imaging has several advantages over other imaging modalities [1]. It is relatively cheap, safe, gives real time images and has good soft tissue contrast. As well as anatomical detail, ultrasound can exploit the Doppler effect to give information about blood flow and the vascularity in tissues. The distortion of tissue under pressure in ultrasound images can give images related to the elasticity of tissues.
Radionuclide imaging, including PET-CT, which is primarily concerned with the function of organs and tissues is dealt with in Chapter 6.
X-ray imaging
Production of x-rays for imaging
The general topic of x-ray production is covered in Chapter 2. This section highlights some aspects of specific relevance to imaging.
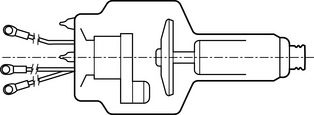
At megavoltage energies, as in linear accelerators used for radiotherapy, the x-rays are produced mainly in the forward direction of the electron beam and hence a transmission target is used. At kilovoltage energies, as used in diagnostic x-ray equipment, radiotherapy simulators and CT scanners, x-rays are produced more isotropically and a reflection target is used. This allows the tube to be constructed with a rotating anode (Figure 5.1), which permits the heat generated to be dissipated over a much larger area than with a stationary anode. This is important because more than 99% of the electron beam energy is converted to heat in the anode and less than 1% appears as x-rays. Moreover, to produce images with good spatial resolution, the focal spot must be as small as possible and short exposure times are used to reduce blurring due to patient movement. With a stationary anode, a large quantity of heat would be deposited in a short time over a very small area, resulting in serious damage to the target. In fact, most x-ray tubes offer two sizes of focal spot, the larger being used for higher exposure factors which impose higher heat loading demands on the tube.
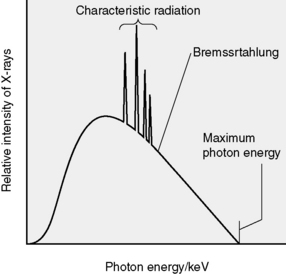
The x-rays produced have a spread of energies, i.e. a spectrum as shown in Figure 5.2, and there are two main components. One is the bremsstrahlung produced when electrons experience large accelerations as they pass close to atomic nuclei. This produces the major part of the spectrum, the smooth curve. Superimposed on this is the second component, the line spectrum due to characteristic radiation emitted when orbital electrons move to lower energy levels to fill vacancies which have been caused by ionization. The area under the spectrum represents the total quantity of radiation produced.
Information from absorption/scattering
Differential attenuation in the primary beam
Consider the simple situation in Figure 5.3, which shows a slab of some homogeneous material A of thickness xA and linear attenuation coefficient μA, which contains a region of some other material B of thickness xB and linear attenuation coefficient μB. Suppose a parallel x-ray beam of intensity IO is incident on this slab. Then the intensity of the primary beam transmitted through A is:
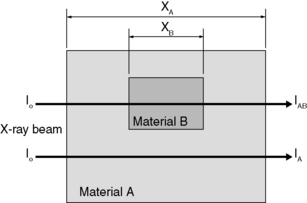
 5.1
5.1and that transmitted through both A and B is:
Hence the ratio of the transmitted intensities is:
 5.2
5.2By taking the (natural) logarithm of both sides, this may also be expressed as:
 5.3
5.3Scatter as unwanted background
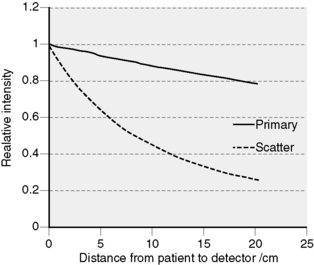
Scattered radiation generally contributes a more or less uniform background signal to the image, which does not convey useful information but which reduces contrast. The amount of scattered radiation emerging from the patient can be several times greater than the transmitted primary beam, increasing with the energy of the x-ray beam, the size of the area irradiated and the thickness of the body part being imaged. It is possible to reduce the amount of scatter reaching the detector by using anti-scatter grids or by using an air gap technique. The latter relies on an appreciable separation between the patient and the image detector, which is often the case when using a radiotherapy simulator. The principle is illustrated in Figure 5.4, which shows that the amount of scatter reaching the detector falls off much more rapidly than the intensity of the primary beam as this distance is increased.
Anti-scatter grid
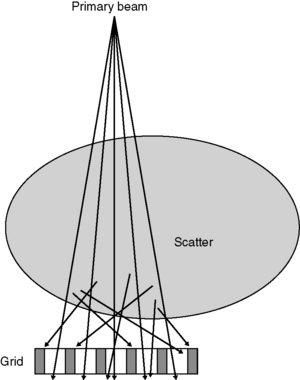
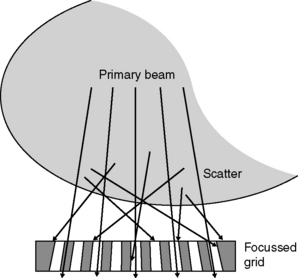
The anti-scatter grid consists of an array of long, thin lead strips, separated by some relatively radiolucent spacer material (Figure 5.5). Only radiation travelling perpendicular to the grid can pass through to the detector. Most of the scattered radiation is travelling at other angles and is intercepted and absorbed by the lead strips. Some primary radiation is absorbed too, but the net effect is greatly to increase the ratio of primary to scattered radiation reaching the detector, thus improving image contrast. If the angle between the primary beam and the perpendicular to the grid becomes too great, e.g. towards the edge of large fields, then a significant fraction of primary radiation will be absorbed. This can be overcome by using a focused grid, as shown in Figure 5.6. To avoid shadows from the lead strips producing distracting lines on the image, it is possible to move the grid to and fro laterally during the exposure and thus to blur out those lines.
Planar imaging
Film/screen detection
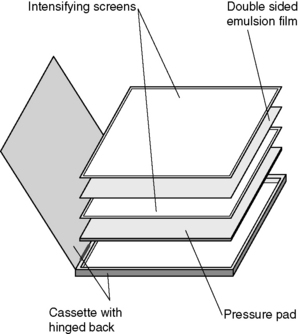
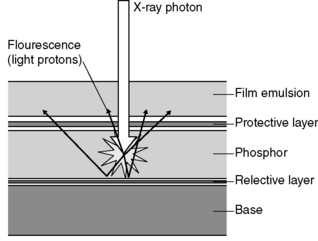
For many years, radiographic film has been used as a combined detector, storage and display device for x-ray images. It is usually used in conjunction with intensifying screens, which have a higher absorption efficiency than film for x-rays and which emit many visible light photons for each x-ray photon absorbed (Figure 5.7).
Exposed films are normally processed automatically, in several stages:
1. development of the latent image using an organic reducing agent
2. fixing the developed image by dissolving away undeveloped silver bromide from the emulsion
3. hardening the emulsion to protect it from damage; and
The intensifying screen (Figure 5.8) uses a fluorescent material which emits visible light when irradiated with x-rays and it is this visible light which is then detected by the film. (The same principle is used in image intensifier systems and in some digital imaging devices: see below.) A cassette is used which contains a separate screen for each side of the film and is constructed so as to ensure close contact between screen and film over their whole area. Many visible photons are produced for each x-ray photon absorbed and so the exposure required to produce a given degree of blackening on the film is greatly reduced compared with direct exposure of the film to x-rays. With modern rare earth screens, this reduction may be by a factor of about 1/100.
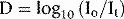
Characteristic curve
 5.4
5.4A graphical plot of D against log(exposure) is called the characteristic curve. A typical example is shown in Figure 5.9. If an unexposed film is developed, its optical density is a little greater than zero because the film base is not perfectly transparent and also because some of the silver bromide crystals are reduced to metallic silver (film fog). Over a range of exposures, the characteristic curve is approximately linear, and the gradient (slope) in this region is known as gamma for that film/screen combination. At very high exposures, all the silver bromide crystals are reduced on development and no increase in D occurs for higher exposures: the film/screen response is said to be saturated.
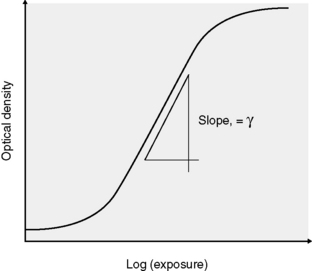
If only a relatively small exposure is required to produce a given density, as in curve A on Figure 5.10, the film/screen combination is said to be fast. Conversely, a slow combination requires a greater exposure to produce the same density (curve B). It might be thought that fast systems would always be desirable, to minimize the patient dose required to produce the image, but this is not necessarily so for two reasons:
1. the image has a more ‘grainy’ appearance because faster films have larger silver bromide crystals which produce larger individual spots of silver in the developed image
2. fewer x-ray photons (quanta) are used to produce the image and this increases quantum mottle, or noise (see below).
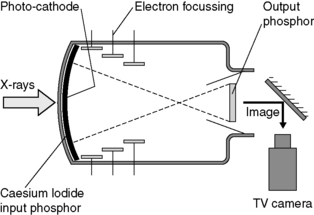
Fluoroscopic imaging with image intensifier/TV chain
It is possible to view a time-varying (dynamic) image by using a fluoroscopic system, in which the x-rays are absorbed by a fluorescent material which emits visible light, as in the intensifying screens used with film. Because the brightness of this image is low, an image intensifier is used to increase the brightness and this secondary image is viewed by a TV camera system (Figure 5.11). The TV signal may be recorded in either analogue or digital format.