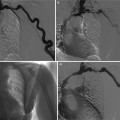
Fig. 1
(a) Abdominal radiograph and (b) unenhanced axial abdominal CT scan in a 46-year-old woman with hematuria demonstrate curvilinear calcification in the right renal region on radiograph (black arrows) that correlates to large exophytic solid right renal lower pole mass with peripheral calcification (white arrow)
Extensive use of cross-sectional imaging in recent years has resulted in detection of such carcinoma incidentally at an early stage. Approximately 36 % of RCCs are discovered incidentally (Leslie et al. 2003). The average size of RCC at the time of diagnosis has decreased significantly over the past two decades (Hollingsworth et al. 2006). At the same time, the proportion of early clinical stage (T1–T2) tumors have increased from 49 to 74 %, while the percentage of patients with M1 disease decreased from 20 to 10 % (Luciani et al. 2000).
2 Histopathological Subtypes
Several distinct histologic subtypes of RCC are recognized and are classified based on 2004 WHO classification (Table 1) into clear cell RCC, papillary RCC, chromophobe RCC, hereditary cancer syndromes, multilocular cystic RCC, collecting duct carcinoma, medullary carcinoma, mucinous tubular and spindle cell carcinoma, neuroblastoma-associated RCC, Xp11.2 translocation–TFE3 carcinoma, and unclassified lesions. Each subtype carries a different prognostic profile (Prasad et al. 2008). For example, clear cell RCC has a less favorable prognosis (stage for stage) than do papillary RCC and chromophobe RCC. Similarly, collecting duct carcinoma and renal medullary carcinoma are associated with poor prognosis and aggressive clinical behavior (Storkel et al. 1997; Bruder et al. 2004).
Table 1
Histological subtypes, prevalence, and cell origin of RCC based on 2004 WHO classification
Histological subtype | Prevalence (%) | Putative cell of origin |
|---|---|---|
Clear cell RCC | 70 | Epithelium of proximal convoluted tubule |
Papillary RCC | 10 | Epithelium of proximal convoluted tubule |
Chromophobe RCC | 5 | Cortical collecting duct, type B intercalated cell |
Hereditary cancer syndromes | 5 | |
Multilocular cystic RCC | <1 | |
Collecting duct carcinoma | <1 | Medullary collecting duct |
Medullary carcinoma | <1 | Medullary collecting duct |
Mucinous tubular and spindle cell carcinoma | <1 | Possibly the loop of Henle |
Neuroblastoma-associated RCC | <1 | |
Xp11.2 translocation–TFE3 carcinoma | <1 | |
Unclassified lesions | 4 |
3 Imaging of Conventional (Clear Cell) Renal Cell Carcinoma
Clear cell RCC is also known as conventional RCC since it accounts for nearly 70 % of all RCCs. Imaging manifestations are based on the contents of the tumor and typically have predominant soft tissue, adipose tissue, or cystic contents. However, RCCs may demonstrate significant tumor heterogeneity and may appear entirely cystic or necrotic or may show a small proportion of macroscopic fat or areas of hemorrhage. Clear cell RCC originates from the renal cortex and typically exhibits an expansile growth pattern. Multicentricity and bilaterality are rare with clear cell RCC (Corica et al. 1999).
3.1 Plain Radiography
Plain radiographs were the mainstay of diagnosis before the advent of ultrasound or cross-sectional imaging on computed tomography (CT) or magnetic resonance imaging (MRI). Occasionally, RCC may be found on an abdominal or kidney–ureter–bladder (KUB) radiograph, usually appearing as an expansile lobulated mass extending from the kidney or as an ill-defined mass distorting the renal soft tissue outline. Approximately 15 % of RCCs contain calcifications (Fig.1) that can be detected on a plain abdominal radiograph. If the calcification is gross, it is of significant importance indicating the high likelihood of RCC.
The patterns of calcification may vary from thin peripheral rim calcification to irregular central calcification, or a combination of both. Roughly 80 % of the masses with thin, peripheral rim calcification are benign cysts, and 20 % are cystic renal malignancies. In contrast, the renal masses that contain central, irregular calcification are more likely to be malignant (87 % of lesions). Masses that have a combination of both central and peripheral calcification have a 50 % chance of being malignant. Nearly 60 % of renal masses that contain visible calcium on an abdominal radiograph, regardless of the pattern of calcification, are RCCs (Bracken 1987).
Other plain radiographic findings that may be important are lytic skeletal abnormalities due to hematogenous metastases. The lesions are characterized by slow growth with bubbly appearance and focal expansion of the bone, mimicking other types of bone lesions, including primary bone neoplasms and myeloma. Finally, patients with tuberous sclerosis, a disease associated with RCC, can have multiple osteomas, which predominate in the skull and spine (Barker and Zagoria 2006).
3.2 Intravenous Urography
Intravenous urography (IVU) used to be the primary investigating modality in the past to determine the nature of a suspected lesion and the residual function of the involved kidney. Currently this technique is rarely utilized when other cross-sectional modalities such as CT and MRI are available.
IVU can be performed in the following way. A preliminary abdominal or KUB radiograph is followed by 100 ml of 30 mg% contrast administration over 30–60 s. The first minute coned radiograph of both kidneys and the nephrotomogram is followed by a 5-min coned radiograph of both kidneys with abdominal compression. Then, a 10-min coned radiograph of both kidneys with continued abdominal compression is taken and compression is released. A penultimate 15-min abdominopelvic plain radiograph, frontal and both obliques, is followed by a final postvoid abdominopelvic plain radiograph. The scout radiograph is analyzed to detect any abnormal calcifications. RCC is typically an expansile lesion which can be a focal bulge extending from the kidney, deforming the normal contour and displacing the normal renal structures. These changes are optimally detected with nephrotomography. Large masses characteristically cause calyceal splaying, stretching, and draping. Occasionally, an exophytic RCC can spare the calyces with no detectable mass effect exerted on the calyceal system. However, RCCs that extend solely in the anterior or posterior direction from the kidney may be difficult to detect with IVU, because the mass contour can be obscured by superimposed normal kidney.
Other IVU signs of RCC include the renal pelvis notching or the ureteral notching from enlargement of ureteric and renal pelvic vessels (which are recruited to feed or drain a hypervascular RCC), obstruction or invasion of the collecting system, and diminished or absent renal function. Hydronephrosis, either focal or diffuse, occurs due to a large RCC compressing the major calyces, the renal pelvis, or the upper ureter. Less commonly, an RCC involves the adjacent structures by infiltration rather than by expansion, which can secondarily encase the ureter or invade the urothelium and cause its malignant constriction.
Limitations of excretory urography are that it lacks specificity and characterization of lesions and therefore requires further imaging with another technique such as ultrasound, CT, or MRI.
3.3 Ultrasound
The most cost-effective imaging modality is renal ultrasound with Doppler. The ultrasound can easily differentiate approximately 80 % of detected renal masses as simple cysts and avoid further diagnostic evaluation (Einstein et al. 1995). The remaining 20 % of renal masses can be differentiated based on their characteristics of echogenicity, blood flow, extension into adjacent structures, and calcification, but it does require further study with cross-sectional (CT or MR) imaging (Barker and Zagoria 2006).
On ultrasound, RCCs appear as expansile, solitary renal masses and are typical but not diagnostic. They may appear hypoechoic, isoechoic, or hyperechoic in comparison with the renal parenchyma, with heterogeneous echo patterns in larger lesions with internal cystic areas (Barker and Zagoria 2006). Approximately one-third of small RCCs are markedly hyperechoic (Fig. 2), but many small RCCs are slightly hyperechoic (Forman et al. 1993) and may mimic a benign angiomyolipoma (AML). Ultrasound finding of a mass lesion with anechoic perimeter or internal cystic areas strongly favors RCC, though CT or MRI is required for further evaluation (Yamashita et al. 1993). AML with intratumoral fat is easily detected on both CT and MRI (Takahashi et al. 1993) and excludes an RCC except in the rare case of a tumor with normal renal sinus or perirenal fat.
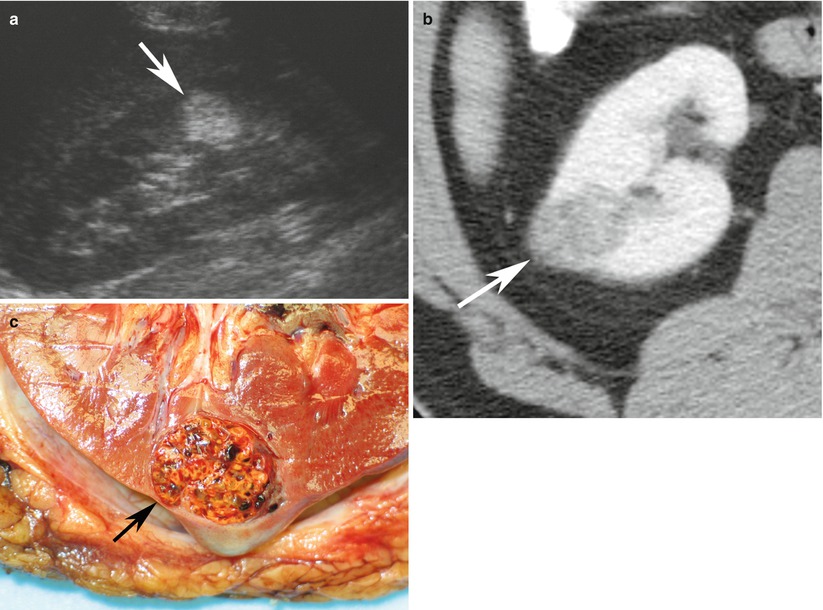
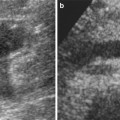
Fig. 2
Renal cell carcinoma in a 66-year-old woman. (a) Longitudinal ultrasound image reveals markedly hyperechoic renal cell carcinoma (arrow) indistinguishable from angiomyolipoma. (b) Axial contrast-enhanced CT scan reveals solid enhancing lesion (arrow) with no detectable fat. (c) Pathology specimen shows yellow-orange mass (arrow) with spongy consistency and areas of hemorrhage. Final diagnosis was conventional RCC (Images reproduced from Barker and Zagoria 2006, with permission)
Another useful feature of ultrasound is the capacity to demonstrate the internal architecture of renal tumors. Ultrasound of lesions with an equivocal appearance (i.e., not clearly cystic, but not obviously malignant) on CT or MRI may demonstrate complexity of the architecture like internal septations, fronds of solid tissue lining the periphery of the mass, or other evidence of malignancy. Ultrasound may also be useful to find the abnormalities secondary to infiltrating RCCs, including hydronephrosis and vascular encasement with diminished Doppler flow to the area of involvement. Alteration of the normal central sinus echo complex may be seen. An infiltrating RCC itself, however, may cause only subtle ultrasound abnormalities or none at all.
Staging of RCC with ultrasound is less accurate than either CT or MRI, and therefore ultrasound should not be used as the sole modality for staging RCC, but as an adjunct to other imaging techniques. The major limitations of ultrasound in staging RCC are the insufficient imaging of the renal vein and the subhepatic inferior vena cava and limited detection of abdominal lymphadenopathy. However, ultrasound is more accurate than CT in evaluating the intrahepatic IVC for tumor thrombi with 95 % sensitivity (Gupta et al. 2004).
Recently, a study showed real-time sonoelastography may be useful in differentiating angiomyolipomas from renal RCCs, by use of both elasticity patterns and strain ratios (Tan et al. 2013). However, this novel imaging technique needs more data and validation from future studies.
3.4 Computed Tomography (CT)
The advent of multidetector-row CT (MDCT) technology allows fast, multiphase, and high-resolution imaging of the abdomen. Very short data acquisition times can be achieved because of short gantry rotation times (0.5 s) combined with multiple detectors providing increased coverage along the z axis. Retrospective thin-section data reconstruction permits routine acquisition of isotropic data that can be displayed in a multitude of multiplanar and three-dimensional (3D) formats, with minimal artifacts. Scanning through the entire kidney is possible in less than 10 s. Multiphase imaging of the kidney permits not only high-resolution imaging of the renal parenchyma but also that of its vasculature and collecting systems. 3D CT provides the urologist with an interactive road map of the relationships among the tumor, the major vessels, and the collecting system (Fig. 3). This information is particularly critical if the tumor extends into the inferior vena cava and if nephron-sparing surgery (NSS) is being planned.
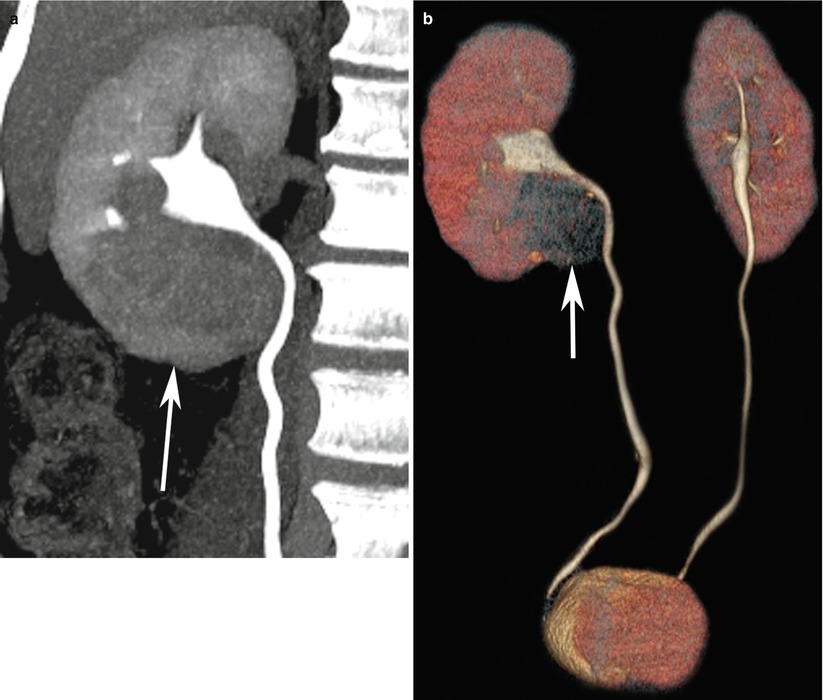
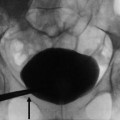
Fig. 3
(a) CT urography with coronal 3D maximum intensity projection of the right upper ureter and (b) 3D volume-rendered display of bilateral ureters demonstrate a mass in the lower pole of the right kidney with mass effect on the pelvicalyceal system and right upper ureter (arrows)
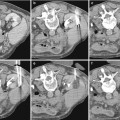
A dedicated renal mass CT protocol (Fig. 4) consists of a precontrast, arterial (15–25-s delay), corticomedullary (35–85-s delay), nephrographic (85–180-s delay), and excretory (3 min or more) phases. An initial series of unenhanced scans through the kidneys should be part of every protocol for evaluation of a suspected renal mass. This provides a baseline to measure the enhancement within the lesion after the administration of intravenous contrast material. This enhancement characteristic is important in distinguishing hyperdense cysts from solid tumors. Because most RCCs have a rich vascular supply, they show significant contrast enhancement. Enhancement values of more than 12 Hounsfield Unit (HU) are considered suspicious for malignancy. Most RCCs are solid lesions with attenuation values of 20 HU or greater at unenhanced CT. Small (<3 cm) tumors usually have a homogeneous appearance, while larger lesions tend to be more heterogeneous owing to hemorrhage or necrosis. Calcifications are detected in up to 30 % of cases of RCC (Fig. 1b).
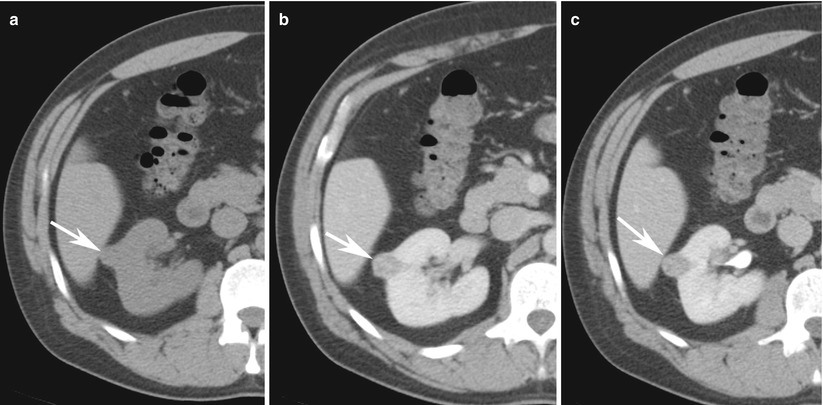
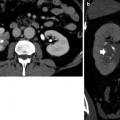
Fig. 4
Renal mass protocol CT evaluation in a 57-year-old man with hematuria demonstrates a 1.3-cm partially exophytic right renal lesion that measures 32 HU on (a) non-enhanced CT, (b) enhances to 65 HU at nephrographic phase of enhancement, and (c) de-enhances to 37 HU at 10-min delayed scans. These enhancement features are highly suggestive of renal cell cancer. Patient subsequently underwent partial nephrectomy and pathology was consistent with clear cell renal cancer
Corticomedullary images are superior in the assessment of renal vascular anatomy, lesion vascularity, and venous involvement of the lesion. During this phase contrast resides in the cortical capillaries, peritubular cells, proximal convoluted tubules, and columns of Bertin. Optimal time delay for the corticomedullary phase depends on the rate of injection, the amount of contrast material administered, and the patient’s cardiac output. Not all renal tumors are well delineated during the corticomedullary phase; small hypovascular lesions of the renal medulla (a low-attenuation region during the corticomedullary phase) and small hypervascular tumors of the cortex (a high-attenuation region during the corticomedullary phase) are difficult to detect. Small hypervascular cortical RCCs may enhance to the same degree as the normal cortex, whereas hypovascular tumors of the medulla may not enhance during this phase (Cohan et al. 1995; Birnbaum et al. 1996; Kopka et al. 1997; Szolar et al. 1997; Yuh and Cohan 1999; Schreyer et al. 2002; Zhang et al. 2007a). Images obtained during a later phase of enhancement (i.e., the nephrographic or excretory phase) must be included to facilitate the detection of such renal masses.
The nephrographic phase is obtained during the passage of contrast material through the renal tubular system. During the nephrographic phase, the renal parenchyma enhances homogeneously. Although the duration of the nephrographic phase is not clearly defined, for practical reasons it may be divided into an early phase and a late phase, with the latter overlapping the excretory phase(Yuh and Cohan 1999; Schreyer et al. 2002). The nephrographic phase is considered the optimal phase for the detection and characterization of small renal masses (Cohan et al. 1995; Szolar et al. 1997; Yuh and Cohan 1999). In one study, 84 more renal masses smaller than 3 cm in diameter were seen on the nephrographic phase scans than were seen on the corticomedullary phase scans (Szolar et al. 1997).
The excretory phase begins when contrast material is excreted into the collecting system, 3–5 min after contrast administration. During this phase, the nephrogram remains homogeneous but its attenuation is diminished. This phase is occasionally helpful to better delineate the relationship of a centrally located mass with the collecting system and define potential involvement of the calices and renal pelvis. Delayed scanning can also be used in lieu of unenhanced scanning to characterize an incidental renal lesion detected on a routine contrast-enhanced CT scan.
In many cases, the pattern of enhancement within a renal neoplasm is dense and irregular, and in such cases, subjective assessment for enhancement is sufficient. Even if enhancement is not particularly dense but is irregular or nodular within the mass, the mass is most likely neoplastic. Conventional clear cell renal carcinoma is the most vascular type among all malignant renal cortical tumors, as shown by its greater degree of enhancement after administration of intravenous contrast material (Jinzaki et al. 2000; Kim et al. 2002; Sheir et al. 2005; Zhang et al. 2007b). A mixed enhancement pattern containing enhancing solid soft tissue and low-attenuation areas that may represent cystic or necrotic changes was most predictive of the clear cell type (Fig. 5). However, in cases of hypovascular masses, enhancement may be more subtle and uniform. In such cases, it is useful to compare attenuation measurements between the precontrast and each of the postcontrast phases.
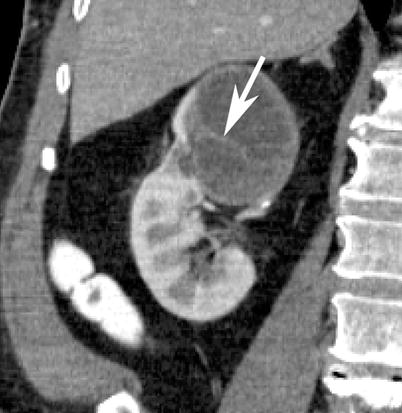
Fig. 5
Contrast-enhanced coronal reformatted CT section of the right kidney depicts a large cystic mass in the upper pole with enhancing septations (arrows). Patient subsequently underwent total nephrectomy and on surgical pathology the lesion was proven to be a cystic clear cell renal cell carcinoma
One pitfall of CT is that attenuation measurements often drift upward slightly, even in a proven simple cyst, because enhancement of the adjacent normal renal parenchyma results in some degree of beam hardening. This drift is more pronounced with smaller, predominantly intrarenal lesions, because volume averaging and beam hardening have a higher statistical impact on the measurement within small lesions, particularly those less than 2 cm in diameter (a phenomenon known as “pseudoenhancement”). As a rule, an increase in attenuation of 10 HU or more within a lesion between the pre- and postcontrast images, in a lesion measuring at least 2 cm in diameter, indicates enhancement. However, because pseudoenhancement may occur, only conclusive evidence of enhancement should be accepted as diagnostic.
Although subtle areas of nodular enhancement can be convincing, lesions with no visual change that have an attenuation increase of 10–20 HU should be considered indeterminate, and further evaluation with ultrasound or MRI should be considered. It is often useful to use MRI to confirm the contrast enhancement, especially in small lesions. Because the enhancement of renal masses is transient, washout of contrast can be as useful as the initial enhancement. A study suggested that measurement of the washout of contrast material from a lesion at 15 min allows differentiation between hyperdense cysts and renal neoplasms (Macari and Bosniak 1999). In their study, there was no change in the attenuation of high-density cysts between the initial contrast-enhanced CT scan and the 15-min delayed images. In comparison, all lesions that proved to be neoplasms at surgery or follow-up studies showed a decrease in attenuation or “de-enhancement” of at least 15 HU at delayed CT, which was attributed to the washout of contrast material from the vascular bed of the tumor (Macari and Bosniak 1999). This may be useful if only a single phase scan of the abdomen was performed and the abnormality is detected before the patient leaves the department.
3.5 Magnetic Resonance Imaging (MRI)
The single greatest advantage of MRI over ultrasound and CT is that MRI generates the highest intrinsic soft tissue contrast of any cross-sectional imaging modality. MRI can be used to stage renal malignancies and can serve as a guide to appropriate choice of therapy. Renal MRI is particularly useful for patients who should not receive iodine-based CT contrast agents, whether due to history of iodine allergy, renal insufficiency, or renal transplantation. It is also useful in follow-up imaging of patients who have had nephrectomy, partial nephrectomy, or percutaneous tumor ablation.
State-of-the-art MRI of renal masses includes the following breath-hold sequences: (1) a T1-weighted in and out of phase gradient-echo sequence, which is helpful in identification of macroscopic and microscopic fat in a renal tumor (Isralel et al. 2005); (2) a T2-weighted half-Fourier single-shot fast spin-echo sequence in axial or coronal planes, which is useful for evaluating the overall anatomy, renal collecting system, and complexity of a cystic renal lesion; and (3) a dynamic contrast-enhanced T1-weighted fat-suppressed sequence (Zhang et al. 2004). For dynamic contrast-enhanced images, three-dimensional fast spoiled gradient-echo sequences are typically performed before and after contrast administration during the arterial, corticomedullary, and nephrographic phases for evaluation of the presence and pattern of enhancement in a renal mass. Multiplanar reconstruction may be performed if necessary to delineate better the spatial relationship of the renal mass to adjacent anatomic structures. If necessary, a dedicated MR angiography sequence during the arterial phase may be performed for better visualization of accessory renal vessels and facilitation of surgical planning. Coronal T1-weighted images may also be obtained during the excretory phase with administration of diuretics, from which maximum intensity projection images can be obtained to produce intravenous pyelography-like images, i.e., magnetic resonance venography (MRV). Presence of venous thrombi can be visualized with this technique (Figs. 6 and 7).
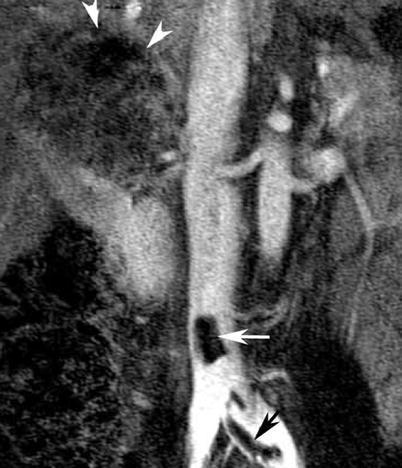
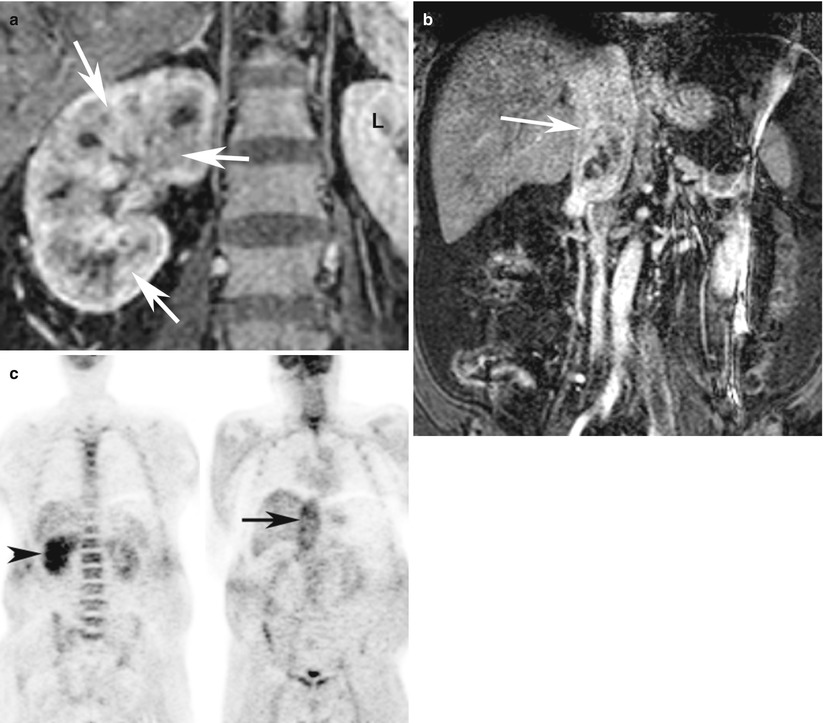
Fig. 6
Renal cell carcinoma in a 47-year-old woman. Coronal subtracted maximum intensity projection (MIP) image of contrast-enhanced magnetic resonance venography (MRV) examination (TR = 3.7 ms, TE = 1.4 ms) demonstrates bland, non-enhancing, nonocclusive thrombus of the inferior vena cava and left common iliac vein (arrows). There is a large right-upper-pole-enhancing RCC (arrowheads)
Fig. 7
A 72-year-old woman with infiltrating clear cell carcinoma of the right kidney with tumor thrombosis of the right renal vein and IVC. (a) Contrast-enhanced coronal T1-weighted MRI at the level of the kidneys demonstrates heterogeneous enhancement of the entire right kidney (white arrows) as compared to the normal left kidney (L) suggestive of infiltrative tumor. (b) Contrast-enhanced coronal T1-weighted MRI of the IVC demonstrates large enhancing thrombus in the IVC (black arrow). (c) Coronal FDG-PET images demonstrate asymmetric uptake of FDG in the right kidney (arrowhead) with enlarged and abnormal uptake in the region of IVC (arrow) suggestive of tumor thrombosis
RCC has a highly variable appearance on MRI, due to the existence of multiple RCC histological types (Shinmoto et al. 1998) and to variability in internal necrosis, hemorrhage (John et al. 1997), and/or intratumoral lipid. On MRI, RCC most commonly appears hypointense or isointense to renal parenchyma on T1-weighted images and heterogeneously hyperintense on T2-weighted images and enhances following gadolinium administration (Fig. 8). Variability is the rule, however, and lesions may be primarily hyperintense, hypointense, or isointense to normal renal parenchyma on both T1- and T2-weighted images. Although RCCs enhance with intravenous gadolinium administration, they tend to enhance less than normal renal parenchyma and are often most easily identified on postcontrast dynamic T1-weighted gradient-recalled-echo (GRE) images. Clear cell RCCs may lose signal on opposed-phase gradient-echo images, due to the presence of microscopic lipid in some of these neoplasms (Fig. 9; Outwater et al. 1997). The presence of intracellular lipid in a renal lesion should therefore not by itself be used to make the diagnosis of AML. The presence of macroscopic lipid within a renal lesion, however, remains very specific for AML, although very rare RCCs which have undergone osseous metaplasia may contain fat.
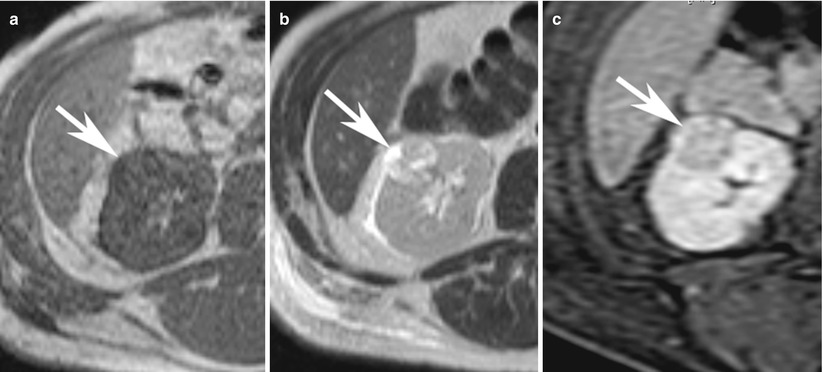
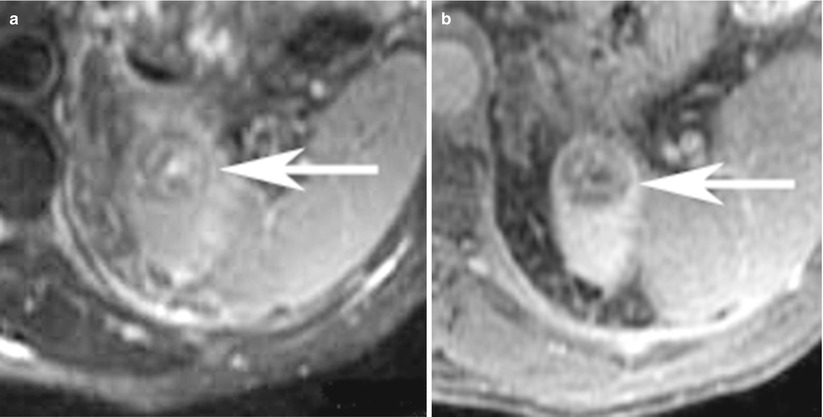
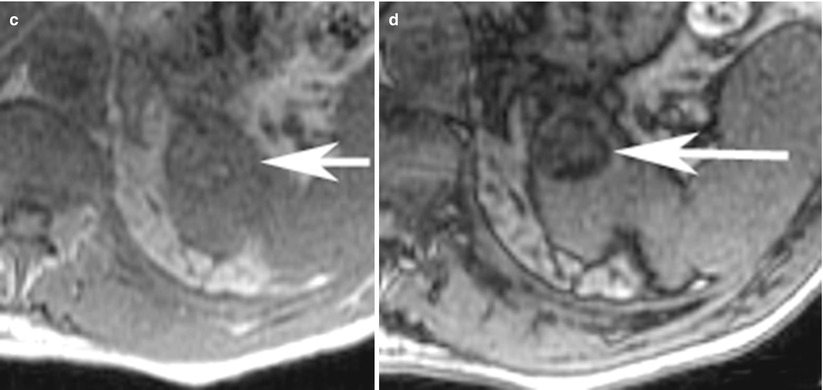
Fig. 8
(a) Axial T1-weighted, (b) T2-weighted, and (c) contrast-enhanced T1-weighted fat saturated images demonstrate typical features of renal cancer on MRI. The lesion (arrow) in the right kidney is hypointense on T1-weighted image and heterogeneously hyperintense on T2-weighted image and shows heterogeneous enhancement (c)
Fig. 9
(a) Axial T2-weighted, (b) contrast-enhanced T1-weighted, (c) T1-weighted in-phase, and (d) opposed-phase images in a 65-year-old-man at the level of upper pole of the left kidney show a minimal T2-hyperintense rounded lesion, with heterogeneous enhancement and dropout of signal on opposed-phase images suggesting the presence of microscopic fat. The lesion was proven to be clear cell cancer on surgical pathology specimen
The MRI features of cystic neoplasms that have been shown to be highly associated with malignancy include mural irregularity, mural nodules, increased mural thickness, and intense mural enhancement. Cystic renal lesions with thicker septations, multiple septations, or bulky calcifications are indeterminate and should be excised (class III). Approximately 10–15 % of RCCs display some cystic component. Lesions with enhancing mural solid nodules (class IV) should be excised, and the majority of these lesions will be cystic RCCs. Surgical cure rates for cystic RCC are very high (Corica et al. 1999).
In addition to the aforementioned conventional sequences, diffusion-weighted imaging (DWI) with apparent diffusion coefficient (ADC) measurements potentially provides a noninvasive method for discriminating benign from malignant renal lesions (Taouli et al. 2009; Goyal et al. 2013). In the past, DWI was difficult to perform in the trunk due to main-field inhomogeneity, local susceptibility gradients, chemical shift, and motion from respiration. Fortunately, recent advances in MRI techniques such as improvements in single-shot echo planar imaging and parallel imaging and the availability of arrays of multiple receiver coils that simultaneously sample the signal returning from more than one part of the body surface and then separate the encoded data provided by each element of the coil have resulted in significantly improved image quality for DWI. A major advantage for routine clinical practice is that DWI does not require administration of intravenous contrast agents and there is no risk of radiation as compared to other currently available functional techniques such as positron emission tomography or perfusion studies.
Malignant tissues generally demonstrate decreased diffusion mainly due to hypercellularity from increased mitosis and cell death from apoptosis that results in decreased net space and surface, respectively, for diffusion of water molecules as compared to benign or normal tissues. Reduced or restricted diffusion of water molecules in a tissue can be effectively imaged and measured on DWI (Fig. 10). In support of this hypothesis, a recent study by Taouli et al. on renal lesions have demonstrated that the DWI can be used to differentiate solid RCCs from oncocytomas and characterize the histologic subtypes of RCC (Taouli et al. 2009). In their study, the mean ADC for RCCs (1.41 ± 0.61 × 10⁻³ mm2/s) was significantly lower (P ≤ 0.0001) than that for benign renal lesions (2.23 ± 0.87 × 10⁻³ mm2/s). In addition to characterization of renal lesions, DWI could be potentially used for detection of local recurrence, regional and distal metastases, and tumor versus bland thrombus differentiation (Fig. 11) and as an alternative imaging tool when contrast study is contraindicated such as when a patient has renal failure.
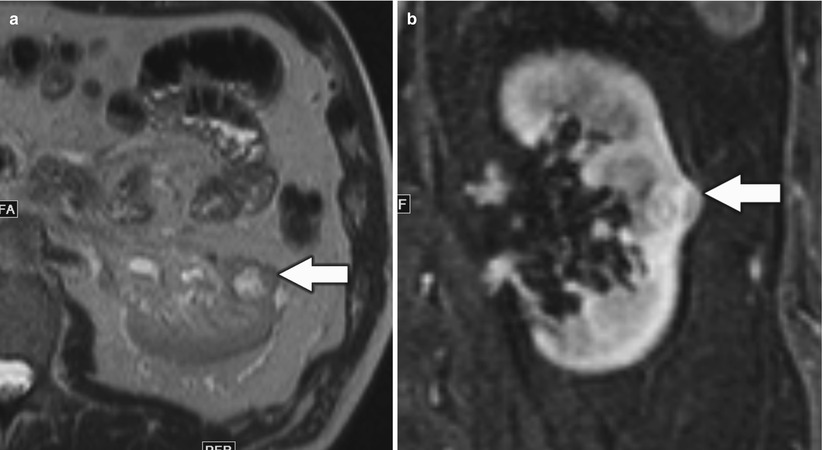
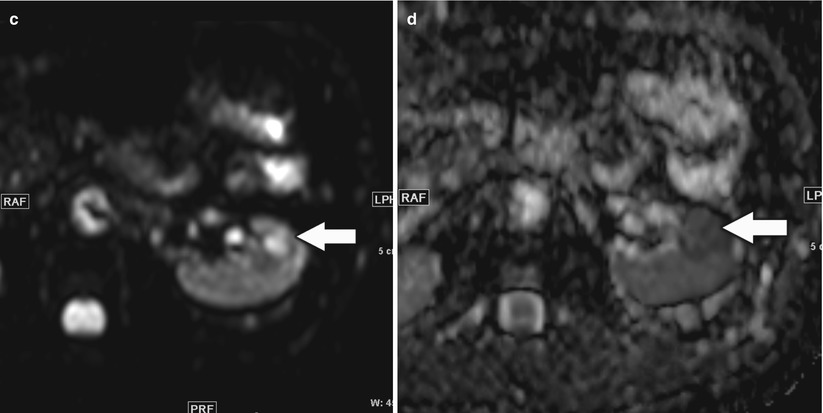
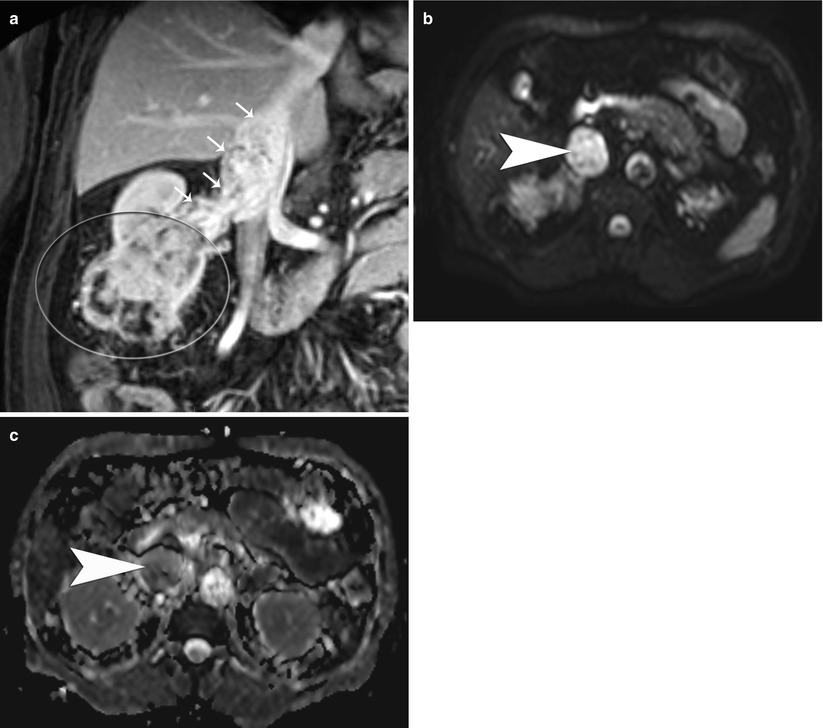
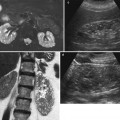
Fig. 10
A 46-year-old man with small left renal papillary renal cell carcinoma. (a) Axial T2-weighted image, (b) postcontrast coronal T1-weighted image, (c) axial diffusion-weighted image (DWI) with b = 600, and (d) corresponding axial apparent diffusion coefficient (ADC) map at the level of inter-polar region of the left kidney demonstrated a mildly T2-hyperintense renal lesion (arrow) with homogeneous enhancement suspicious for renal cell carcinoma. The lesion was hyperintense on DWI and hypointense on ADC map relative to the background kidney suggestive of restricted diffusion and correlated with conventional MRI findings
Fig. 11
(a) Postcontrast portal venous phase coronal T1-weighted image in a 55-year-old man with a large right lower pole renal cancer (big oval) with tumor thrombosis of the right renal vein and the inferior vena cava (IVC, small arrows). (b) The thrombus in the IVC is hyperintense on DWI and (c) hypointense on the ADC map, consistent with tumor thrombosis
3.6 Positron Emission Tomography (PET)
Oncological PET imaging with F-18 deoxyglucose (FDG) is used as an adjunct to CT and MRI and majority of the application involves the post therapy staging. It is based on the increased glucose utilization exhibited by tumor cells (Barker and Zagoria 2006) (Fig. 12). However, its use in diagnosis of primary lesions is limited by physiological radiotracer uptake in the kidney in the background and modest uptake within the tumor itself. FDG-PET has 64–71 % sensitivity in staging and restaging, but the overall sensitivity of in the detection of metastatic foci is limited (Jadvar et al. 2003; Majhail et al. 2003). FDG-PET plays a better complementary role in the restaging of RCC patients related to superior specificity and positive predictive value compared with conventional imaging (Kang et al. 2004).
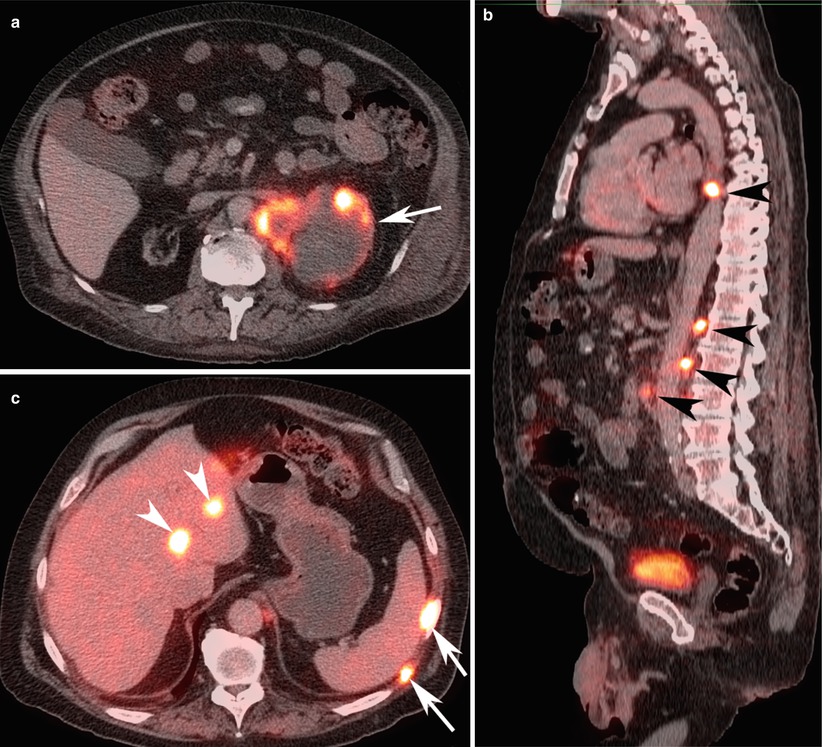
Fig. 12
A 60-year-old woman with metastatic left renal cancer. (a) FDG-PET/CT axial image at the level of left kidney, (b) sagittal image at the level of aorta, and (c) axial image of the right lobe of the liver demonstrate peripherally FDG avid cystic left renal malignancy (arrow) with multiple FDG avid para-aortic lymph nodes (black arrowheads), bone lesions (white arrows), and liver lesions (white arrow heads) consistent with metastatic lesions
3.7 Angiography
Renal angiography (Watson et al. 1968) is reserved for mapping vascular supply to the kidney with a renal mass (Fig. 13) when a partial nephrectomy or nephron-sparing surgery is contemplated. However, newer noninvasive techniques, such as CT or MR angiography, can derive similar information, and thus these techniques have largely replaced catheter angiography at most centers.
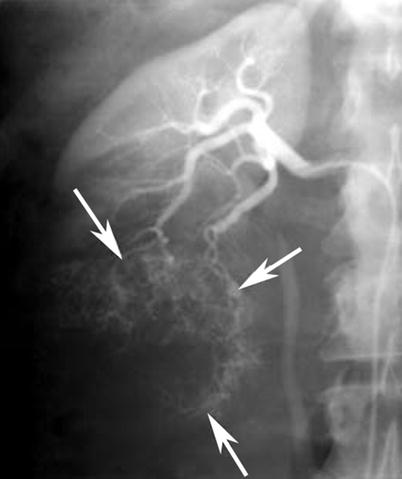
Fig. 13
Renal cell carcinoma in a 67-year-old man who presented with macroscopic hematuria. Anteroposterior selective right renal arteriography image demonstrates typical features of tumor vascularity, including large tortuous and meandering arteries and arterioles and numerous irregular branches (arrows), due to a lower pole renal cell carcinoma
Nevertheless, renal arteriography is useful in embolization treatment of some RCCs. Tumor embolization aims to reduce intraoperative blood loss or can diminish symptoms in inoperable patients. In some cases, angiography may be useful to distinguish among various renal masses. Angiography can be an alternative to open biopsy in the evaluation of infiltrating renal neoplasms, the differential diagnosis for which includes urothelial neoplasm, inflammatory lesion, infarct, or infiltrating RCC. These lesions except for infiltrating RCC are nearly always hypovascular or avascular; therefore, an infiltrating renal mass that is hypervascular suggests an infiltrating RCC. It is important to differentiate among these lesions because treatment for each type of lesion is different: RCC is treated with nephrectomy; transitional cell carcinoma is treated with nephroureterectomy; and many other infiltrating lesions are treated medically (Barker and Zagoria 2006).
4 Imaging of Uncommon Renal Cell Carcinoma
As described earlier in this chapter (Sect. 2), RCCs according to the pathological tumor subtype are classified as papillary, chromophobe, collecting duct, medullary, and sarcomatoid types. Radiological or pathological preoperative diagnosis of cyst-associated RCC (cystadenocarcinoma, multilocular cystic RCC, acquired cystic disease of the kidney, adult polycystic kidney disease) is difficult, and it is especially so in cases of RCC originating in a cyst. RCCs with unusual infiltrative growth may mimic transitional cell carcinoma, with fatty component mimicking AML and severe perinephric infiltration and extensive calcifications mimicking inflammation or other tumor. Each subtype has a different prognosis and tumor behavior. A higher 5-year survival rate is seen in patients with papillary RCC or with chromophobe RCC than with conventional RCC of the same stage (Reuter and Presti 2000).
4.1 Papillary Type
Papillary RCCs present with variable size, and small tumors and true renal cortical adenomas must be distinguished. The classification of RCCs defines any papillary tumor larger than 0.5 cm as a carcinoma (Storkel et al. 1997). Grossly, the papillary type of RCC is well circumscribed, and more than 80 % of tumors are confined to the cortex and eccentrically situated within the renal capsule at the time of nephrectomy. Radiographic finding of reduced or absent tumor vascularity correlates with intratumoral hemorrhage and necrosis seen in 66 % of cases (Press et al. 1984). They are often multiple and are associated with cortical adenomas.
CT features correlate with established clinicopathological and angiographic appearances. Papillary RCC presents at early stages in most cases (stages I or II), with a high frequency of calcification and less enhancement (i.e., diminished vascularity) than a typical RCC. Ultrasound pattern (Fig.14a) is known to be inconsistent. On CT a prospective diagnosis of papillary RCC is reasonable. This is particularly important in nephron-sparing surgery as a clinical consideration (Press et al. 1984). Homogeneity and low tumor-to-parenchyma enhancement ratios on the parenchymal-phase scans correlate with papillary RCC (Fig. 14b, c). Heterogeneity and tumor enhancement ratios do not correlate with the nuclear grade of the carcinoma (Herts et al. 2002).
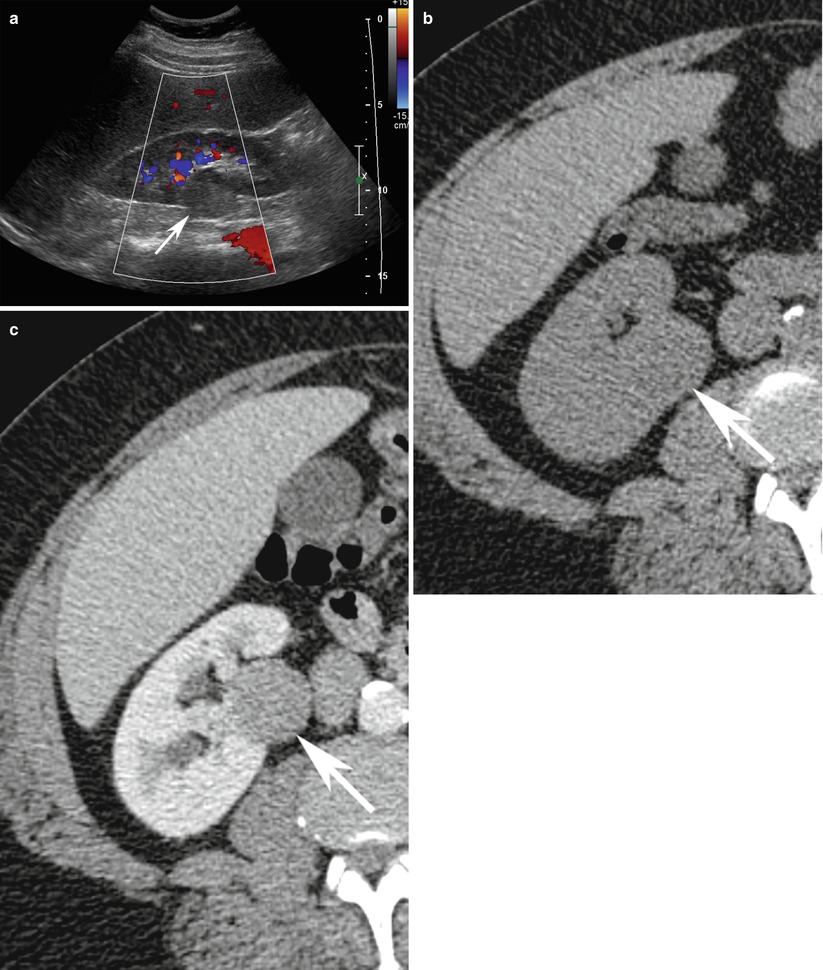
Fig. 14
A 56-year-old man with right papillary renal cell cancer. (a) Sagittal ultrasound of the right kidney with color Doppler demonstrates well-defined isoechoic rounded partially exophytic solid renal lesion in the midpole (arrow) with lack of vascularity. (b) On unenhanced axial CT scan, the same lesion depicts a CT density of 23 HU and (c) measures 30 HU on postcontrast image. Patient subsequently underwent nephrectomy which was diagnosed to be papillary renal cell cancer on surgical histopathology
On MR imaging, papillary RCC typically appears hypointense on T2-weighted images relative to the renal parenchyma and enhances mush less and more homogeneously than clear cell RCC. Intratumoral hemosiderin may manifest as areas of signal loss on longer TE in-phase images relative to shorter TE opposed-phase images.
4.2 Chromophobe Cell Type
This variant constitutes approximately 5 % of renal neoplasms with distinctive histological and cytogenetic features and needs to be distinguished from benign oncocytoma (Thoenes et al. 1988). The lesions are typically well circumscribed and solitary. The cut surfaces mimic an oncocytoma and are pale yellow, tan, or brown. Histologically, there are two major patterns of growth: the classic and the eosinophilic types. Microvesicles may concentrate around the nucleus, producing a distinctive perinuclear halo, which is a distinguishing feature from oncocytoma (Murphy et al. 2004). The clinicopathologic characteristics of chromophobe RCC include hypovascularity/avascularity on angiography, low rate of laboratory abnormalities, low stage/low grade, and a favorable prognosis compared with the common types of RCC (Onishi et al. 1996).
On CT, the lesions are well circumscribed, solid, and iso- to hypodense to renal parenchyma, with relatively low homogeneous contrast enhancement on early and delayed phase in 69 % of cases (Fig. 15). There is neither venous nor lymph node involvement, and no distant metastases. The tumor stage is lower and the prognosis is better even where the nuclear grade is higher (Cho et al. 2002).
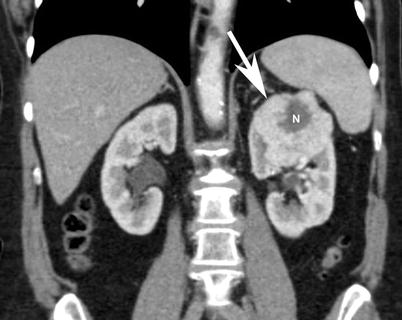
Fig. 15
Contrast-enhanced coronal reformat CT image shows a large heterogeneous peripherally enhancing lesion (arrows) with central necrosis (N). Histopathology discloses chromophobe renal cell carcinoma
4.3 Collecting Duct Type
Collecting duct tumors are aggressively malignant, associated with an extremely poor prognosis, and account for less than 1 % of malignant epithelial renal neoplasms in adults (Srigley and Eble 1998). In the WHO classification, the tumor is designated as carcinoma of the collecting ducts of Bellini, reflecting its presumed site of origin and is grouped with RCC (Eble et al. 2004). Grossly, collecting duct carcinomas are predominantly localized to the medulla but may invade the cortex distorting adjacent calyces and the renal pelvis and infiltrate the adjacent renal parenchyma and produce a desmoplastic response. Hemorrhage, with or without necrosis, is typically present. Histologically, the classic collecting duct type of RCC is composed of a mixture of dilated tubules and papillae. Collecting duct carcinomas at presentation are metastatic to regional lymph nodes in approximately 80 % of cases, to the lung or adrenal gland in 25 %, and to the liver in 20 %. Median survival after nephrectomy has been reported to be 22 months (Dimopoulos et al. 1993).
On CT, collecting duct tumor may show minimum contrast enhancement (Fukuya et al. 1996). Medullary involvement is present in the majority of cases, but cortical involvement or an exophytic component may also be present. A cystic component may be present in the minority of cases. In large tumors, the features are frequently overshadowed by an exophytic or expansile component undistinguished from the more common cortical RCC (Pickhardt et al. 2001).
On ultrasound, the solid tumor component appears hyperechoic to normal renal parenchyma in most cases. On MRI, tumors are hypointense on T2-weighted imaging without a hypointense rim. On urography, lesions appear to show distortion of the intrarenal collecting system. On selective renal angiography, lesions are hypovascular compared with normal renal parenchyma.
4.4 Medullary Type
Medullary RCC is a distinctive entity occurring exclusively in patients with sickle-cell hemoglobinopathies, mostly in patients with the sickle-cell trait (Swartz et al. 2002). The tumor is not considered a subtype of collecting duct carcinoma despite its believed origin in the collecting ducts. At presentation renal medullary carcinoma has a dismal prognosis, with advanced metastatic disease and an overall mean survival after surgery of less than 4 months. Metastasis to the regional lymph nodes, liver, and lung are common (Davis et al. 1995).
Radiologically, renal medullary carcinoma appears as a typical infiltrative lesion, with ill-defined mass in the renal medulla and extension into the renal sinus and cortex. Caliectasis may be seen as a result of the sinus invasion. Larger tumors expand the kidney but tend to maintain its reniform shape. The tumors show heterogeneous appearance on ultrasound and contrast-enhanced CT, due to the presence of characteristic tumor necrosis (Davidson et al. 1995).
4.5 Sarcomatoid Type
Sarcomatoid RCC is present in 1.0–6.5 % (de Peralta–Venturina et al. 2001) of RCCs. It is large and invasive, represents high-grade transformation of different subtypes of RCC, and is not a distinct histological entity. It has foci of high-grade spindle cells and reminisces a malignant fibrous histiocytoma (Eble et al. 2004). The presence of a sarcomatoid component in an RCC is a poor prognostic sign. The presence of a bulging, lobulated, soft, gray-white component indicates the possibility of a sarcomatoid element. Histologically, the sarcomatoid component is characterized by interlacing or whorled bundles or storiform pattern of spindle cells. The imaging features of sarcomatoid type RCC are not well characterized in the literature but can be similar to the subtype within which the sarcomatoid change has occurred, i.e., from well-defined, circumscribed to ill-defined infiltrative lesion.
4.6 Hypovascular or Avascular Renal Cell Carcinoma
Majority of RCCs (up to 80 %) are iso- and/or hypervascular with a typical distinguishing tumor blush after the arterial contrast injection on angiography (Weyman et al. 1980). This characteristic enables it to be differentiated from other renal tumors. Few of the remaining RCCs are hypovascular (Fig. 16


Related posts:
Stay updated, free articles. Join our Telegram channel
Full access? Get Clinical Tree
